. 2022 Aug;130(8):87004.
doi: 10.1289/EHP9957. Epub 2022 Aug 5.

Impacts of Sugarcane Fires on Air Quality and Public Health in South Florida

Affiliations

Impacts of Sugarcane Fires on Air Quality and Public Health in South Florida

Holly K Nowell et al. Environ Health Perspect. 2022 Aug.

Abstract

Background: Preharvest burning of sugarcane is a common agricultural practice in Florida, which produces fine particulate matter [particulate matter (PM) with aerodynamic diameter 2.5μm (PM2.5)] that is associated with higher mortality.

Objectives: We estimated premature mortality associated with exposure to PM2.5 from sugarcane burning in people age 25 y and above for 20 counties in South Florida.

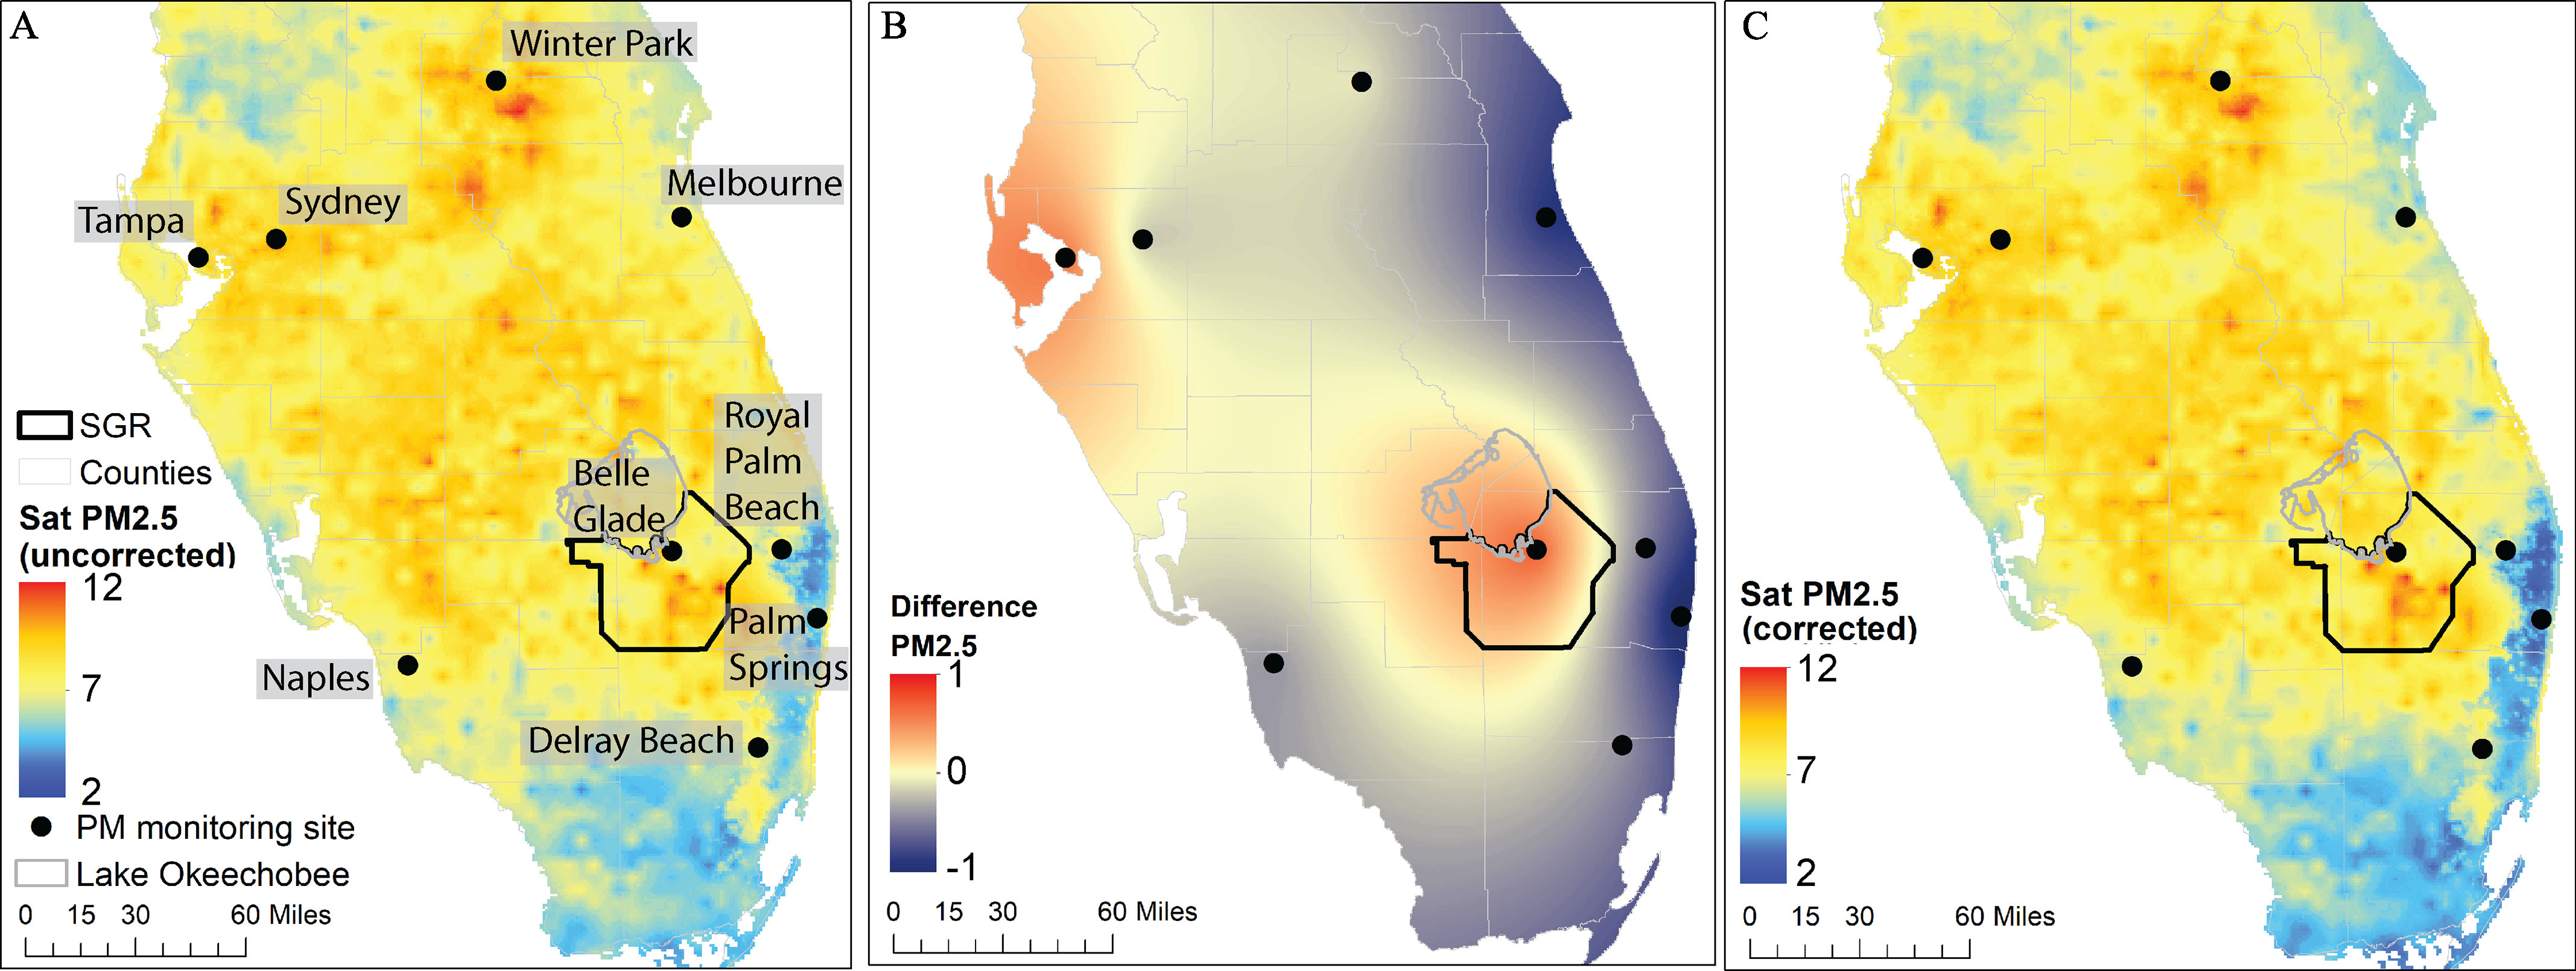
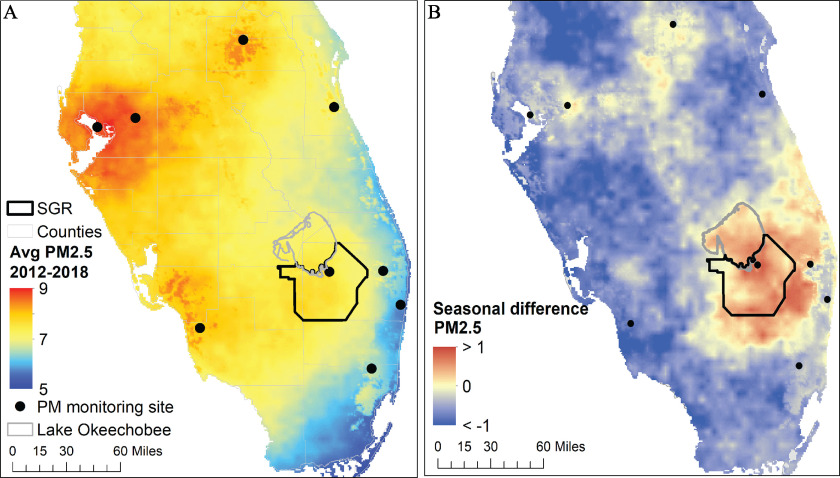
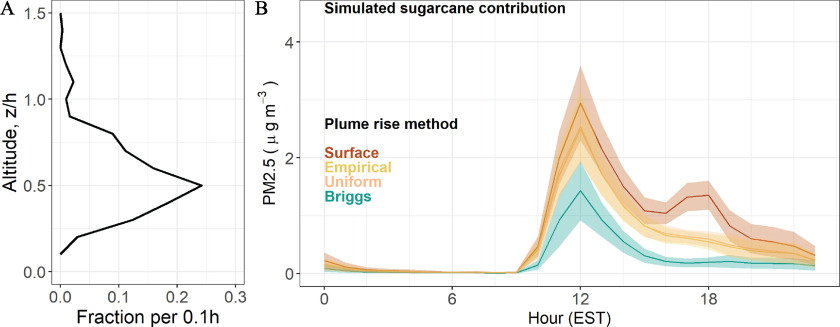
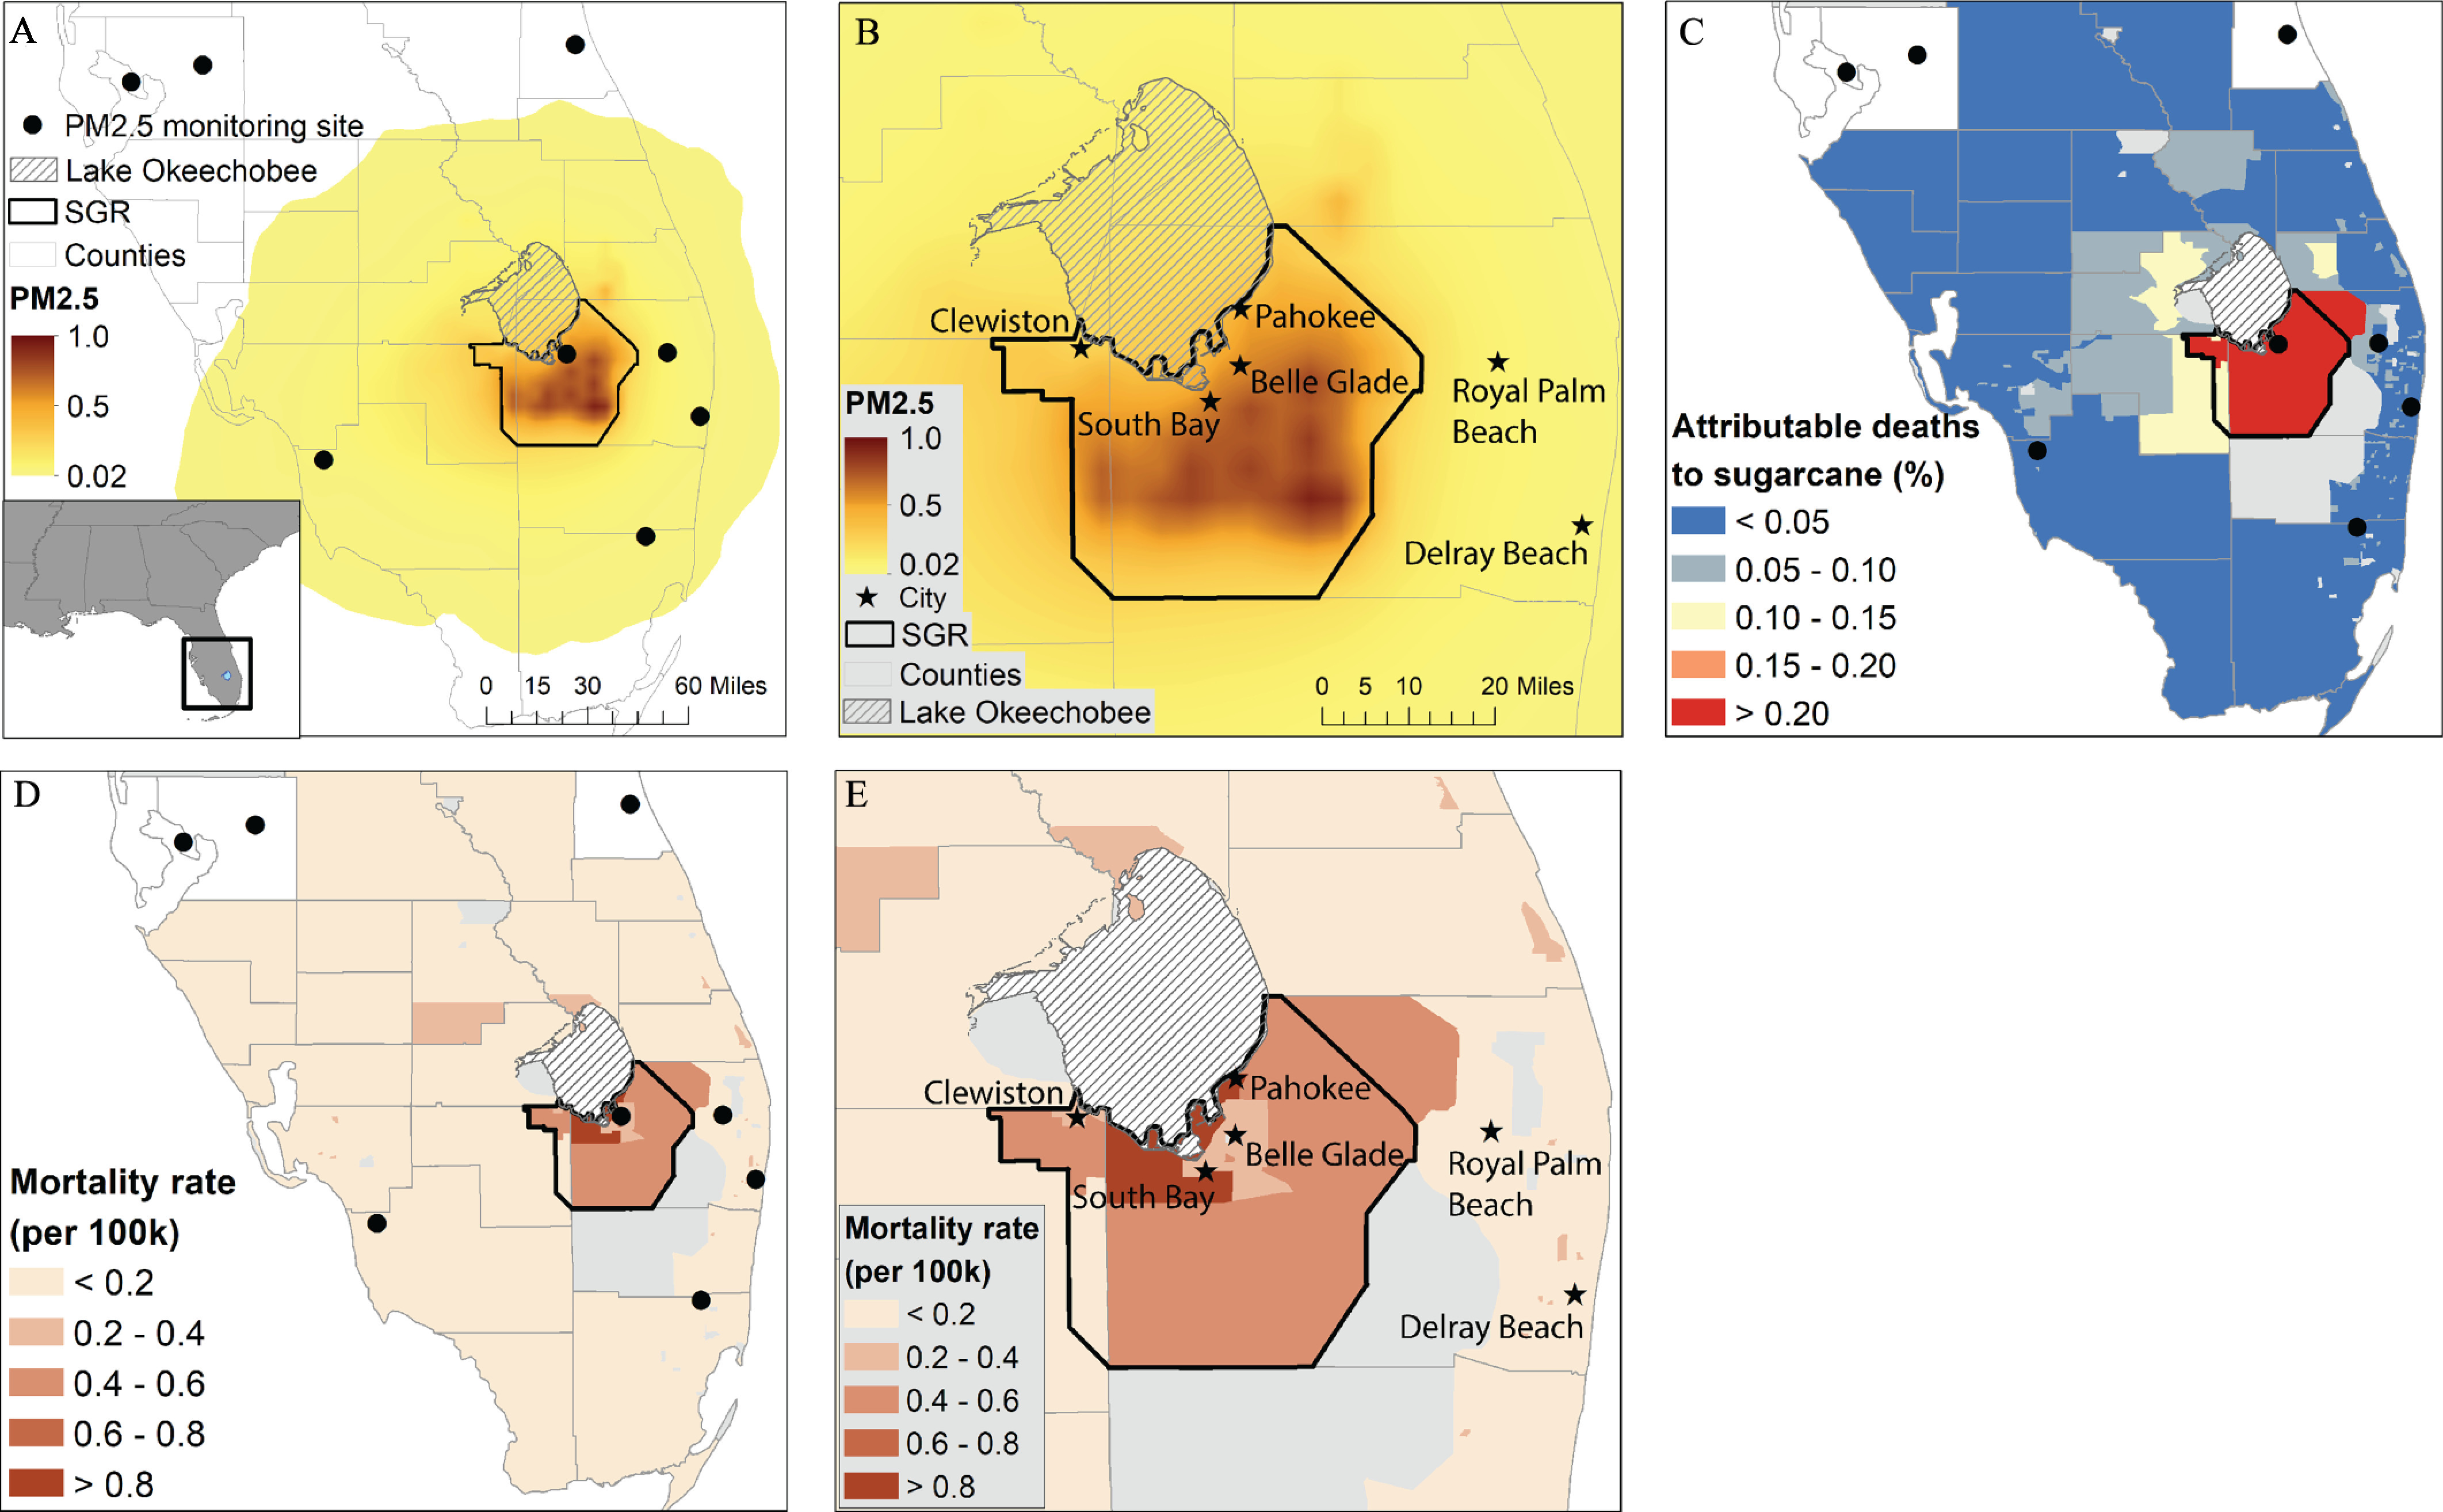
Methods: We combined information from an atmospheric dispersion model, satellites, and surface measurements to quantify PM2.5 concentrations in South Florida and the fraction of PM2.5 from sugarcane fires. From these concentrations, estimated mortalities attributable to PM2.5 from sugarcane fires were calculated by census tract using health impact functions derived from literature for six causes of death linked to PM2.5. Confidence intervals (CI) are provided based on Monte Carlo simulations that propagate uncertainty in the emissions, dispersion model, health impact functions, and demographic data.

Results: Sugarcane fires emitted an amount of primary PM2.5 similar to that of motor vehicles in Florida. PM2.5 from sugarcane fires is estimated to contribute to mortality rates within the Florida Sugarcane Growing Region (SGR) by 0.4 death per 100,000 people per year (95% CI: 0.3, 1.6 per 100,000). These estimates imply 2.5 deaths per year across South Florida were associated with PM2.5 from sugarcane fires (95% CI: 1.2, 6.1), with 0.16 in the SGR (95% CI: 0.09, 0.6) and 0.72 in Palm Beach County (95% CI: 0.17, 2.2).
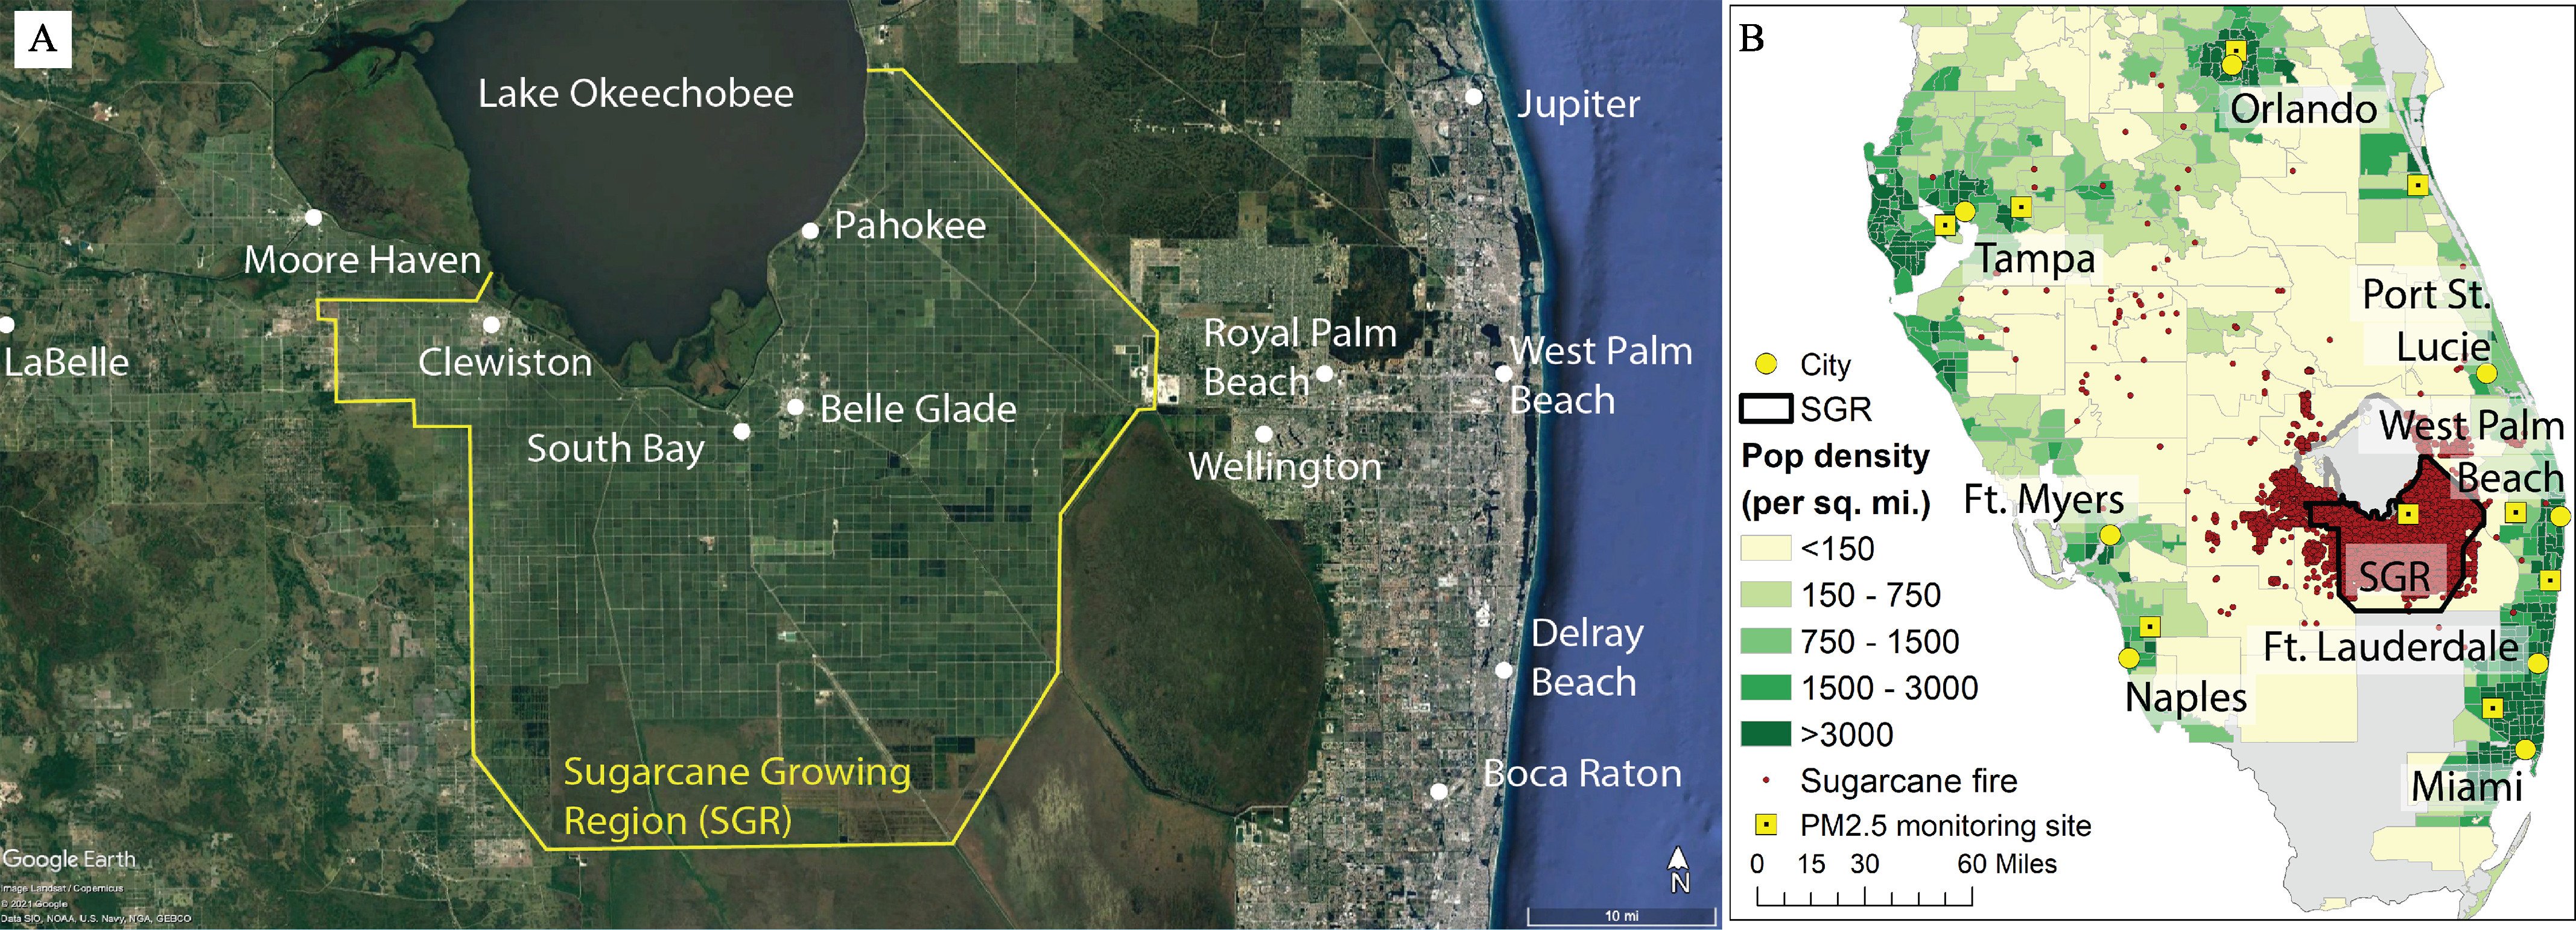
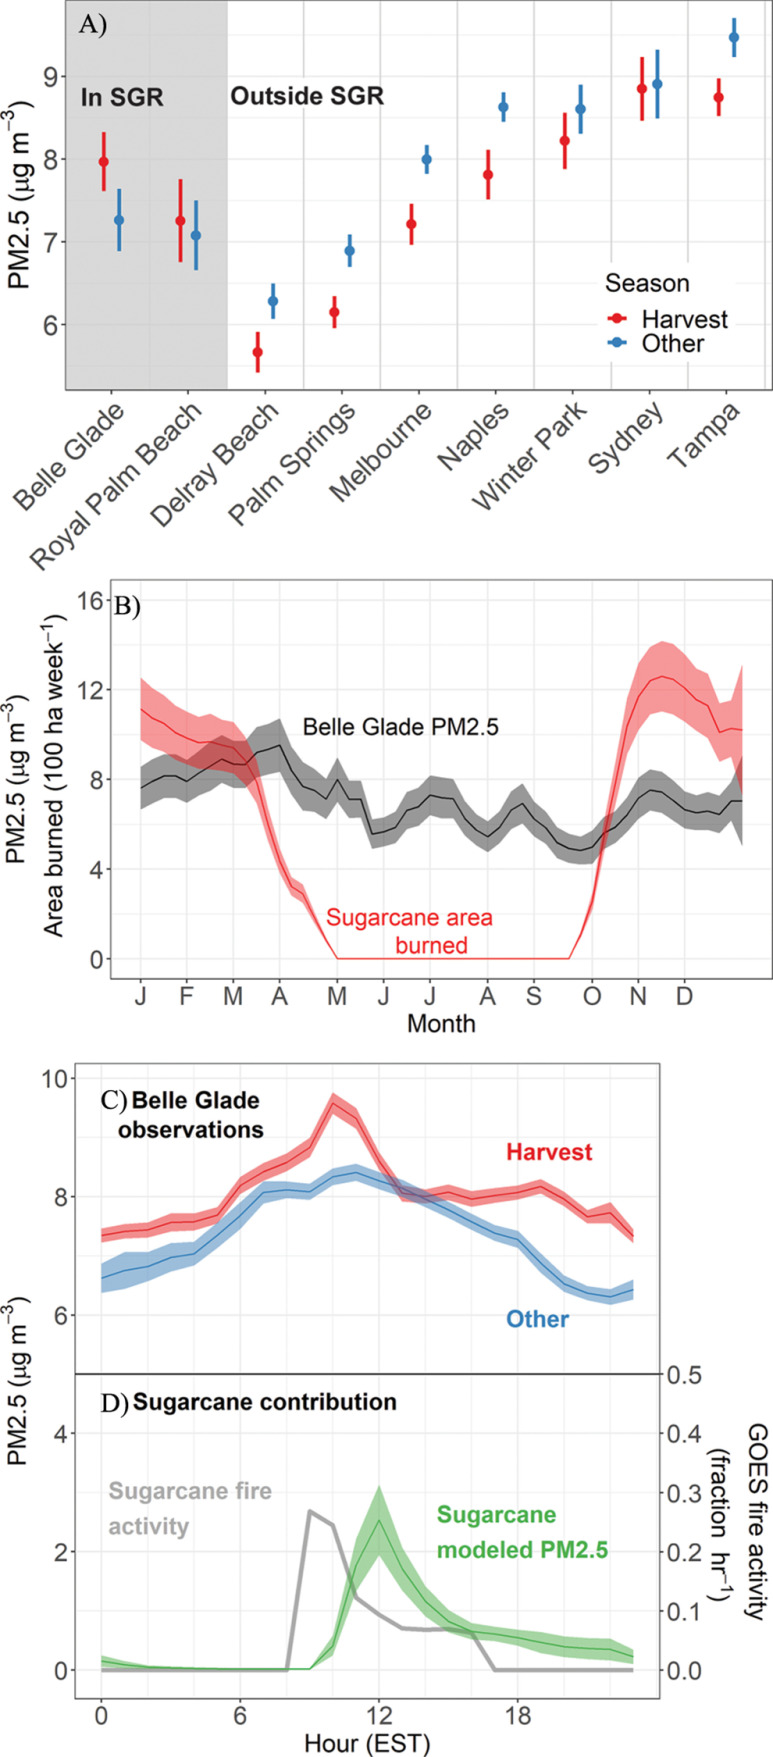
Discussion: PM2.5 from sugarcane fires was estimated to contribute to mortality risk across South Florida, particularly in the SGR. This is consistent with prior studies that documented impacts of sugarcane fire on air quality but did not quantify mortality. Additional health impacts of sugarcane fires, which were not quantified here, include exacerbating nonfatal health conditions such as asthma and cardiovascular problems. Harvesting sugarcane without field burning would likely reduce PM2.5 and health burdens in this region. https://doi.org/10.1289/EHP9957.


Figures

Figure 1A is a satellite view of Florida, United States, depicting the sugarcane growing region and surroundings, including Clewiston, Pahokee, South Bay, and Belle Glade. Figure 1B is a map of Florida, depicting the sugarcane growing region and population density by zip code. The range of population density (per square mile) is divided into five parts, namely, less than 150, 150 to 750, 750 to 1500, 1500 to 3000, and greater than 3000. A scale depicting miles ranges from 0 to 30 in increments of 15 and 30 to 60 in increments of 30.
Figure 1.
(A) Map of the SGR (yellow boundary) and surroundings. Background image is true-color satellite imagery from 10 and 28 January 2021 (Masek et al. 2021). Dark rectangular areas within the SGR are recently burned sugarcane fields. (B) Locations of sugarcane fires and major cities (yellow circles, labeled with names) in peninsular Florida. The SGR is shown in black and colors show population density by ZIP code. Also shown are the U.S. EPA monitoring sites used in analysis (yellow boxes with dots in the center). Note: SGR, sugarcane growing region; U.S. EPA, U.S. Environmental Protection Agency.
Figure 2a is an error bar graph, plotting particulate matter begin subscript 2.5 end subscript (microgram meter begin superscript negative 3 end superscript), ranging from 6 to 9 in unit increments (y-axis) across Belle Glade, Royal Palm Beach, Delray Beach, Palm Springs, Melbourne, Naples, Winter Park, Sydney, and Tampa (x-axis) for Season, including Harvest and other. Figure 2b is a ribbon chart, plotting particulate matter begin subscript 2.5 end subscript (microgram meter begin superscript negative 3 end superscript) area burned (100 hectare week begin superscript negative 1 end superscript), ranging from 0 to 16 in increments of 4 (y-axis) across January, February, March, April, May, June, July, August, September, October, November, and December (x-axis) for Belle Glade particulate matter begin subscript 2.5 end subscript and Sugarcane area burned. Figures 2c and 2d are ribbon plots titled Belle Glade observations and Sugarcane contribution, plotting particulate matter begin subscript 2.5 end subscript (microgram meter begin superscript negative 3 end superscript), ranging from 0 to 10 in increments of 2 (left y-axis) and G O E S fire activity (fraction hour begin superscript negative 1 end superscript), ranging from 0.0 to 0.5 in increments of 0.1 (right y-axis) across hour (E S T), ranging from 0 to 24 in increments of 6 (x-axis) for Harvest and other, and sugarcane fire activity and sugarcane modeled particulate matter begin subscript 2.5 end subscript, respectively.
Figure 2.
(A) PM2.5 concentrations at air quality monitoring sites in Central and South Florida, showing mean concentrations during sugarcane harvest and fire season (October–March) vs. other months outside harvest (April–September). Dots and vertical lines show mean and standard error. Data are averages for 2009–2018, except for Royal Palm Beach, which stopped measurements in 2015. (B) Temporal variability of sugarcane burned area in the SGR and PM2.5 concentrations measured in Belle Glade. Data are averaged for 2009–2019 and smoothed with a 3-wk running mean. (C) Mean diurnal cycle of PM2.5 concentrations measured in Belle Glade from the U.S. EPA sensor from 2009–2019. (D) Simulated contribution of sugarcane fires to the mean diurnal cycle of PM2.5 concentration in Belle Glade and mean diurnal cycle of GOES-16 FRP, which is a proxy for sugarcane fire emissions. The vertical distribution of smoke (B) and GOES-16 FRP are normalized to unit integral. Shading shows standard error of the mean. Note: FRP, fire radiative power; U.S. EPA, U.S. Environmental Protection Agency.
Figure 3a is a map of Florida, United States, depicting the uncorrected satellite particulate matter begin subscript 2.5 end subscript concentration measurements in January 2016. The satellite particulate matter begin subscript 2.5 end subscript (uncorrected) ranges from 2 to 12 in increments of 5. A scale depicting miles ranges from 0 to 30 in increments of 15, and 30 to 60 in increments of 30. Figure 3b is a map of Florida, United States, depicting the interpolated difference between uncorrected satellite particulate matter begin subscript 2.5 end subscript and surface measurements. The difference in particulate matter begin subscript 2.5 end subscript is divided into three parts, namely, 1, 0, and negative 1. A scale depicting miles ranges from 0 to 30 in increments of 15, and 30 to 60 in increments of 30. Figure 3c is a map of Florida, United States, depicting the corrected satellite-derived particulate matter begin subscript 2.5 end subscript (microgram meter begin superscript negative 3 end superscript). The satellite particulate matter begin subscript 2.5 end subscript (corrected) is ranging from 2 to 12 in increments of 5. A scale depicting miles ranges from 0 to 30 in increments of 15, and 30 to 60 in increments of 30.
Figure 3.
Example correction of satellite-derived PM2.5 (micrograms per cubic meter) to match surface PM2.5 concentration measurements in January 2016: (A) uncorrected satellite PM2.5; (B) interpolated difference between uncorrected satellite PM2.5 and surface measurements (surface minus satellite); (C) corrected satellite-derived PM2.5 (micrograms per cubic meter). Black dots show surface measurement sites.
Figure 4a is a map of Florida, United States, depicting the multi-year mean of corrected satellite derived particulate matter begin subscript 2.5 end subscript (microgram meter begin superscript negative 3 end superscript) from the year 2012 to 2018. The average particulate matter begin subscript 2.5 end subscript from 2012 to 2018 ranges from 5 to 9 in increments of 2. A scale depicting miles ranges from 0 to 30 in increments of 15, and 30 to 60 in increments of 30. Figure 4b is a map of Florida, United States, depicting the mean difference in sugarcane harvest and outside or other seasons from the year 2009 to 2018. The seasonal difference in particulate matter begin subscript 2.5 end subscript is divided into three parts, namely, less than or negative 1, 0, and greater than 1. A scale depicting miles ranges from 0 to 30 in increments of 15, and 30 to 60 in increments of 30.
Figure 4.
(A) Multiyear mean of corrected satellite derived PM2.5 (micrograms per cubic meter) for the period 2012–2018. (B) Mean difference in surface PM2.5 concentrations (micrograms per cubic meter) between sugarcane harvest and outside/other seasons, from corrected satellite-derived PM2.5 data for 2009–2018. Positive values in panel B indicate harvest season has higher mean concentration. Black dots show PM2.5 surface measurement sites used in this work.
Figure 5a is a line graph, plotting altitude geometric per geopotential, ranging from 0.0 to 1.5 in increments of 0.5 (y-axis) across fraction per 0.1 hour, ranging from 0.0 to 0.3 in increments of 0.1 (x-axis). Figure 5b is a ribbon plot titled simulated sugarcane contribution, plotting particulate matter begin subscript 2.5 end subscript (microgram per cubic meter), ranging from 0 to 4 in increments of 2 (y-axis) across hour (E S T), ranging from 0 to 18 in increments of 6 (x-axis) for Plume rise method, including surface, empirical, uniform, and Briggs.
Figure 5.
(A) Vertical distribution of sugarcane smoke in the SGR as a fraction of boundary layer height h, derived from MISR. (B) Mean diurnal cycle of PM2.5 from sugarcane fires in Belle Glade simulated for January 2012 with four different plume rise methods. The empirical method is the best estimate, whereas all methods are used for constructing CIs for results. Shading shows the standard error of the mean. Note: CI, confidence interval; MISR, multi-angle imaging SpectroRadiometer; SGR, sugarcane growing region.
Figure 6a is a map of Florida, United States, depicting the simulated estimated increase in annual mean due to sugarcane fires from the year 2012 to 2018. The particulate matter begin subscript 2.5 end subscript ranges from 0.02 to 0.5 in increments of 0.48 and 0.5 to 1.0 in increments of 0.5. A scale depicting miles ranges from 0 to 30 in increments of 15, and 30 to 60 in increments of 30. Figure 6b is a map of Florida, United States, depicting the same as panel a with a focus on the sugarcane growing region. The particulate matter begin subscript 2.5 end subscript ranges from 0.02 to 0.5 in increments of 0.48 and 0.5 to 1.0 in increments of 0.5. A scale depicting miles ranges from 0 to 30 in increments of 15, and 30 to 60 in increments of 30. Figure 6c is a map of Florida, United States, depicting the estimated fraction of mortality attributable to particulate matter begin subscript 2.5 end subscript exposure from sugarcane fires. The attributable deaths to sugarcane (percent) are divided into five parts, namely, less than 0.05, 0.05 to 0.10, 0.10 to 0.15, 0.15 to 0.20, and greater than 0.20. Figure 6d is a map of Florida, United States, depicting the estimated mortality rate per 100000 people per year attributable to sugarcane burning. The mortality rate (per 100 thousand) is divided into five parts, namely, less than 0.2, 0.2 to 0.4, 0.4 to 0.6, 0.6 to 0.8, and greater than 0.8. Figure 6e is a map of Florida, United States, depicting the mortality and mortality from sugarcane fires examined in this study. The mortality rate (per 100 thousand) is divided into five parts, namely, less than 0.2, 0.2 to 0.4, 0.4 to 0.6, 0.6 to 0.8, and greater than 0.8.
Figure 6.
Estimated impacts of sugarcane fires on PM2.5 air quality and human health: (A) simulated estimated increase in annual mean PM2.5 concentration (micrograms per cubic meter) due to sugarcane fires in 2012–2018; (B) same as panel A with a focus on the SGR; (C) estimated fraction of mortality (six causes of death) attributable to PM2.5 exposure from sugarcane fires; (D) estimated mortality rate per 100,000 people per year attributable to sugarcane burning; and (E) same as panel D with a focus on the SGR. Mortality and mortality rate include six causes of death associated with PM2.5 from sugarcane fires examined in this study; see Table S9 for county-specific mortality. Light gray shading in panels C–E indicates unpopulated census tracts. Note: SGR, sugarcane growing region.

Comment in

Similar articles

Cited by

References

    1. Achtemeier GL. 1996. Results from a field study of Florida sugar cane prescribed fires. 22nd Conference on Agriculture & Forest Meteorology with Symposium on Fire and Forest Meteorology, 28 January–2 February 1996. Atlanta, Georgia, 268–271.
    1. Achtemeier GL, Adkins CW. 1997. Ash and smoke plumes produced from burning sugar cane. Sugar Cane 2:16–21.
    1. Achtemeier GL, Goodrick SA, Liu Y, Garcia-Menendez F, Hu Y, Odman MT. 2011. Modeling smoke plume-rise and dispersion from Southern United States prescribed burns with Daysmoke. Atmosphere 2(3):358–388, 10.3390/atmos2030358. - DOI
    1. Afshar-Mohajer N, Wilson C, Wu C-YY, Stormer JE. 2016. Source apportionment of atmospheric polycyclic aromatic hydrocarbons (PAHs) in Palm Beach County, Florida. J Air Waste Manag Assoc 66(4):377–386, PMID: , 10.1080/10962247.2016.1138902. - DOI - PubMed
    1. Aguilera R, Corringham T, Gershunov A, Benmarhnia T. 2021. Wildfire smoke impacts respiratory health more than fine particles from other sources: observational evidence from Southern California. Nat Commun 12(1):, 10.1038/s41467-021-21708-0. - DOI - PMC - PubMed

Publication types