. 2022 Nov 1;28(21):4724-4736.
doi: 10.1158/1078-0432.CCR-22-0301.

Preclinical Characterization of AZD5305, A Next-Generation, Highly Selective PARP1 Inhibitor and Trapper

Affiliations

Preclinical Characterization of AZD5305, A Next-Generation, Highly Selective PARP1 Inhibitor and Trapper

Giuditta Illuzzi et al. Clin Cancer Res. .

Abstract

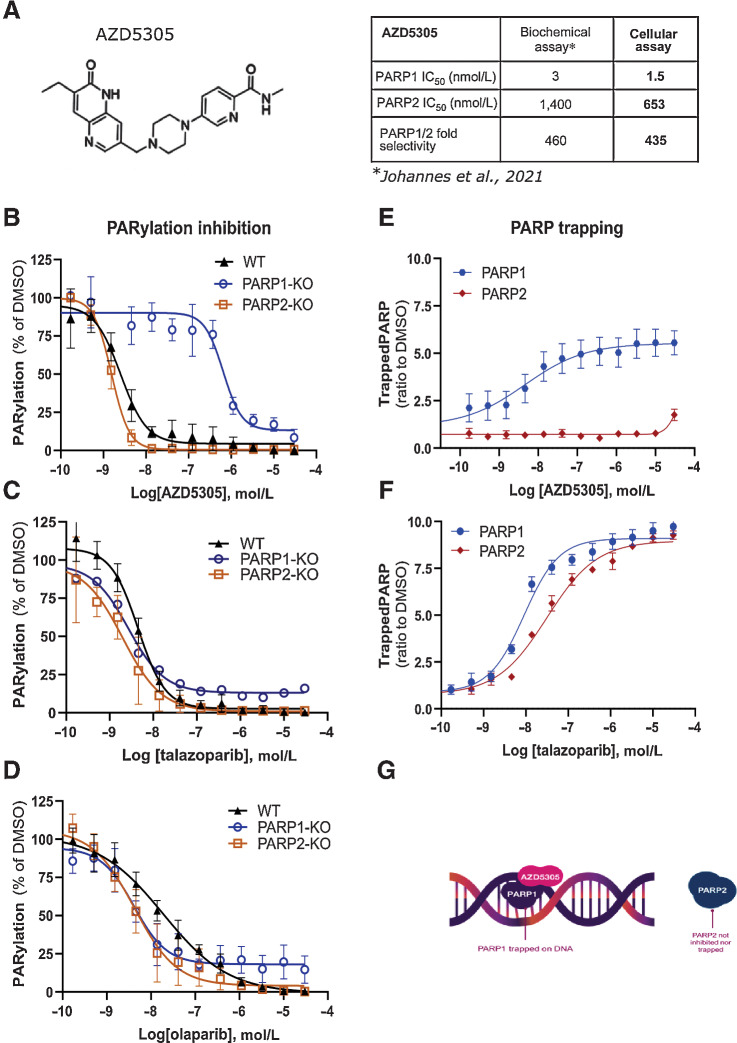
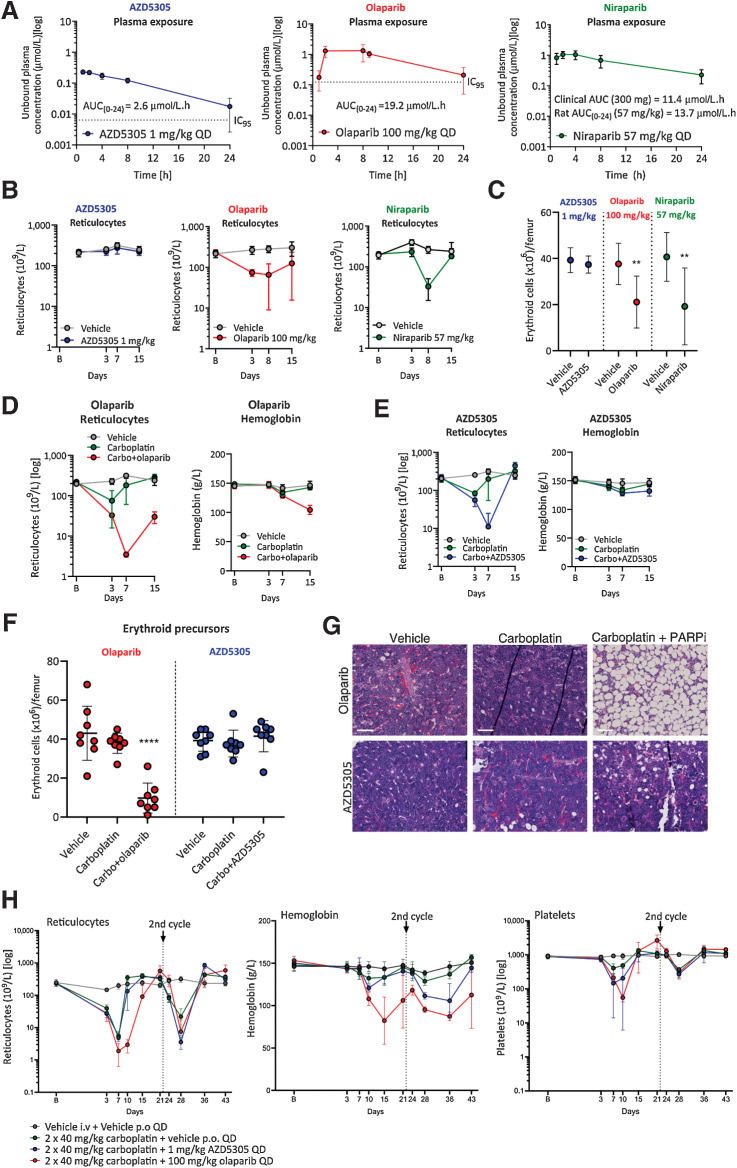
Purpose: We hypothesized that inhibition and trapping of PARP1 alone would be sufficient to achieve antitumor activity. In particular, we aimed to achieve selectivity over PARP2, which has been shown to play a role in the survival of hematopoietic/stem progenitor cells in animal models. We developed AZD5305 with the aim of achieving improved clinical efficacy and wider therapeutic window. This next-generation PARP inhibitor (PARPi) could provide a paradigm shift in clinical outcomes achieved by first-generation PARPi, particularly in combination.

Experimental design: AZD5305 was tested in vitro for PARylation inhibition, PARP-DNA trapping, and antiproliferative abilities. In vivo efficacy was determined in mouse xenograft and PDX models. The potential for hematologic toxicity was evaluated in rat models, as monotherapy and combination.

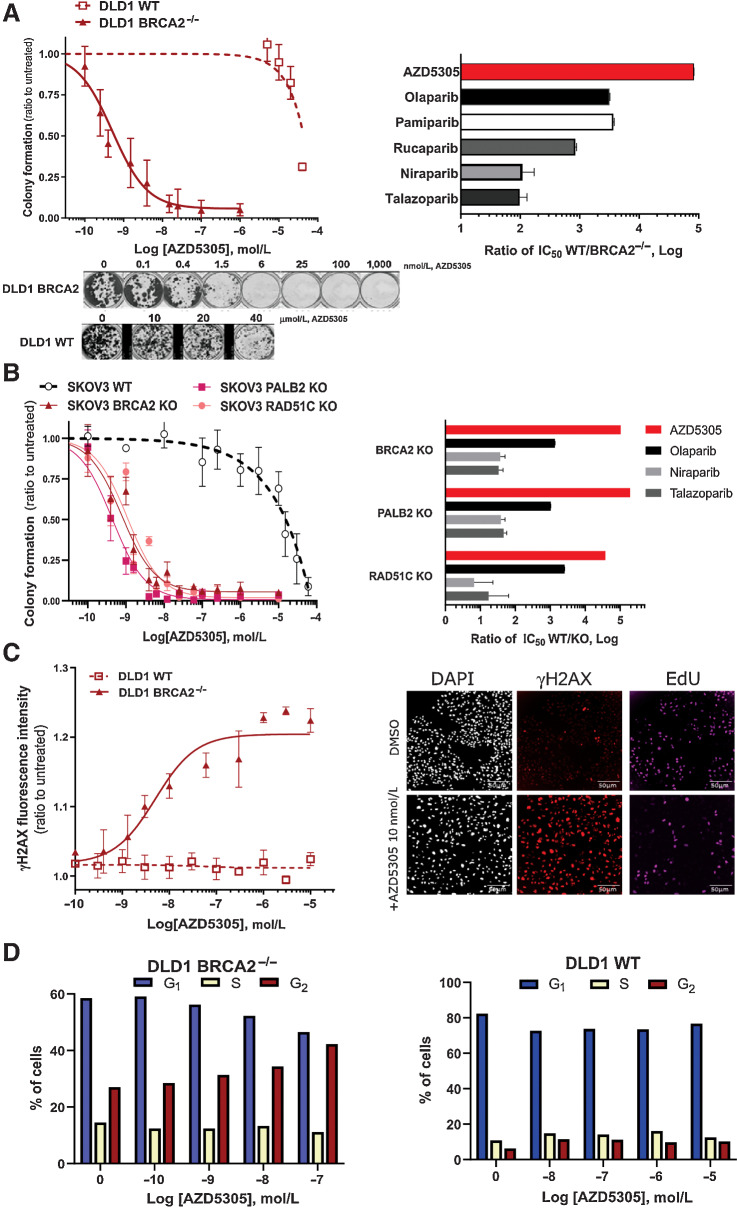
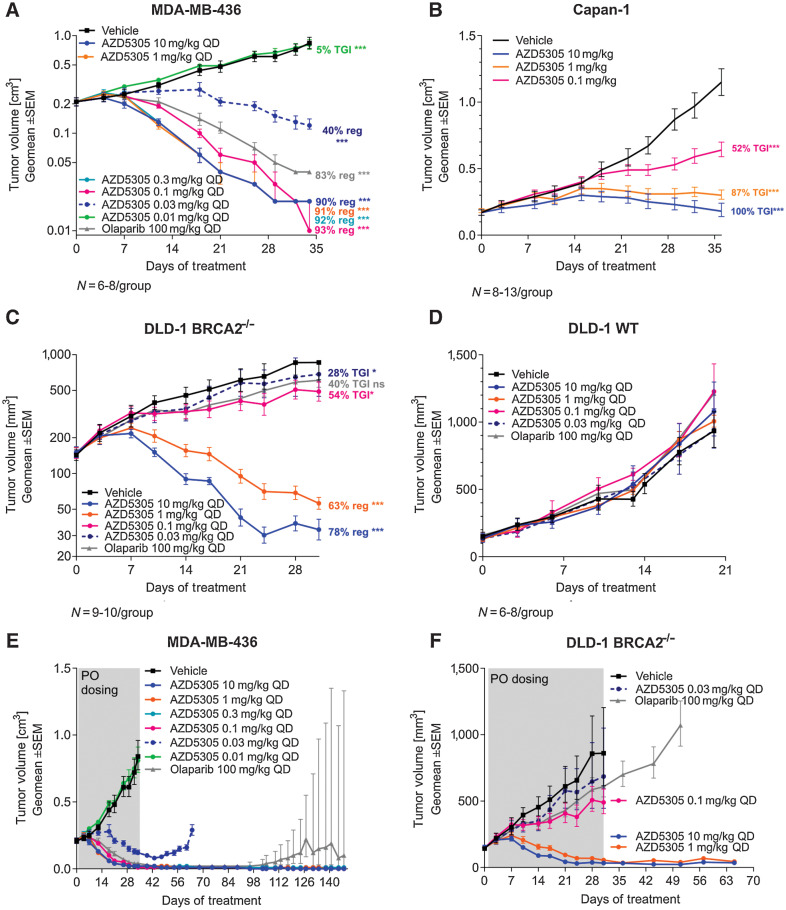
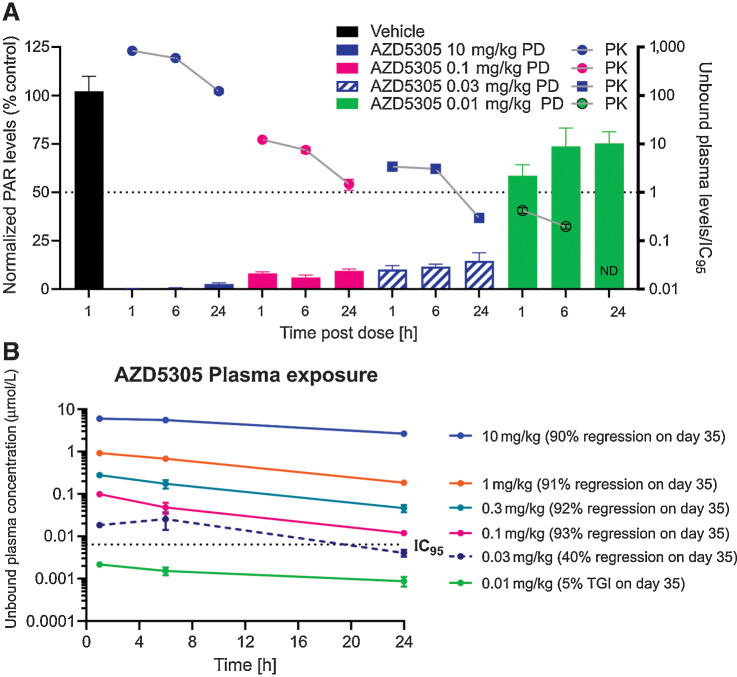
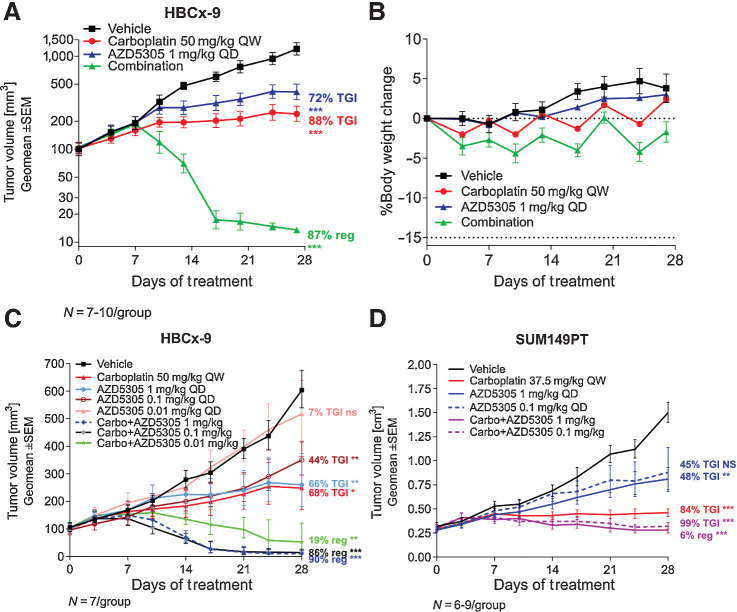
Results: AZD5305 is a highly potent and selective inhibitor of PARP1 with 500-fold selectivity for PARP1 over PARP2. AZD5305 inhibits growth in cells with deficiencies in DNA repair, with minimal/no effects in other cells. Unlike first-generation PARPi, AZD5305 has minimal effects on hematologic parameters in a rat pre-clinical model at predicted clinically efficacious exposures. Animal models treated with AZD5305 at doses ≥0.1 mg/kg once daily achieved greater depth of tumor regression compared to olaparib 100 mg/kg once daily, and longer duration of response.

Conclusions: AZD5305 potently and selectively inhibits PARP1 resulting in excellent antiproliferative activity and unprecedented selectivity for DNA repair deficient versus proficient cells. These data confirm the hypothesis that targeting only PARP1 can retain the therapeutic benefit of nonselective PARPi, while reducing potential for hematotoxicity. AZD5305 is currently in phase I trials (NCT04644068).


Figures

Figure 1. AZD5305 inhibits and traps selectively PARP1 in cells. A, Left: chemical structure of AZD5305. Right: table summarizing AZD5305 IC50 in binding and inhibition of PARP1 and PARP2 in biochemical and cellular assays. B–D, PARylation inhibition in A549 isogenic cell lines: WT (solid triangle), PARP1-KO (empty circle), PARP2-KO (empty square) upon dose-response of AZD5305 (B), talazoparib (C) or olaparib (D). E and F, Trapping profiles of PARP1 (blue circle) and PARP2 (red diamond) in A549 cells, measured upon dose-response treatments of AZD5305 (E) or talazoparib (F). Details of all experiments are described in materials and methods section. Each dose-response curve is the mean of four independent experiments, the error bars indicate ±SEM. G, Scheme representing the selective targeting of AZD5305.
Figure 1.
AZD5305 inhibits and traps selectively PARP1 in cells. A, Left: chemical structure of AZD5305. Right: table summarizing AZD5305 IC50 in binding and inhibition of PARP1 and PARP2 in biochemical and cellular assays. B–D, PARylation inhibition in A549 isogenic cell lines: WT (solid triangle), PARP1-KO (empty circle), PARP2-KO (empty square) upon dose–response of AZD5305 (B), talazoparib (C), or olaparib (D). E and F, Trapping profiles of PARP1 (blue circle) and PARP2 (red diamond) in A549 cells, measured upon dose–response treatments of AZD5305 (E) or talazoparib (F). Details of all experiments are described in Materials and Methods section. Each dose–response curve is the mean of four independent experiments; the error bars indicate ±SEM. G, Scheme representing the selective targeting of AZD5305.
Figure 2. AZD5305 selectively targets cancer cells with HRR-Deficiency, inducing DNA damage accumulation and cell cycle arrest. A, Colony formation assays of DLD-1 isogenic cell line pair (WT in dotted line and BRCA2−/− in solid line) treated with AZD5305 in dose response (A, left) Curves are the mean of six independent experiments, error bars indicate ±SEM. (A, bottom) Representative images of clonogenic assays. (A, right) Bar chart representing the differential activity of each PARPi on the BRCA2−/- isogenic cell line pair. Bars are the IC50 ratio of WT over the BRCA2−/− cells for each indicated PARPi. (B, left). Colony formation assays performed in SKOV-3 isogenic pairs: WT (dotted line, empty circle), BRCA2-KO, PALB2-KO and RAD51C-KO (solid lines and full symbols, as indicated) treated with a dose response of AZD5305. Curves are the mean of three independent experiments, error bars indicate ±SEM. (B, right) Bar chart representing the differential activity of each compound on each isogenic cell line pair. Bars are the IC50 ratio of WT over the indicated KO isogenic pair, measured for each indicated PARPi. (C, left) γH2AX measured by immunofluorescence after 72-hour treatments with a dose response of AZD5305 in DLD-1 BRCA2−/− (solid line and full symbol) or WT cells (dotted line and empty symbol). Curves are the mean of three independent experiments, error bars indicate ±SEM. (C, right), representative immunofluorescence images of DLD-1 BRCA2−/− cells treated with 10 nmol/L of AZD5305 (bottom) or untreated (top). D, Cell cycle analysis by flow cytometry of DLD-1 BRCA2−/− (left) and WT cells (right) treated with AZD5305 for 48 hours at indicated concentrations. Bar charts represent the distribution of cells in the different cell cycle phases, G1, S, and G2; below are representative cell cycle scatter plots, with DNA and EdU intensity signal on x- and y- axes, respectively.
Figure 2.
AZD5305 selectively targets cancer cells with HRR-deficiency, inducing DNA damage accumulation and cell-cycle arrest. A, Left, Colony formation assays of DLD-1 isogenic cell line pair (WT in dotted line and BRCA2−/− in solid line) treated with AZD5305 in dose–response. Curves are the mean of six independent experiments; error bars indicate ±SEM. Bottom, Representative images of clonogenic assays. Right, Bar chart representing the differential activity of each PARPi on the BRCA2−/− isogenic cell line pair. Bars are the IC50 ratio of WT over the BRCA2−/− cells for each indicated PARPi. B, Left, Colony formation assays performed in SKOV-3 isogenic pairs: WT (dotted line, empty circle), BRCA2-KO, PALB2-KO, and RAD51C-KO (solid lines and full symbols, as indicated) treated with a dose–response of AZD5305. Curves are the mean of three independent experiments; error bars indicate ±SEM. Right, Bar chart representing the differential activity of each compound on each isogenic cell line pair. Bars are the IC50 ratio of WT over the indicated KO isogenic pair, measured for each indicated PARPi. C, Left, γH2AX measured by immunofluorescence after 72-hour treatments with a dose–response of AZD5305 in DLD-1 BRCA2−/− (solid line and full symbol) or WT cells (dotted line and empty symbol). Curves are the mean of three independent experiments; error bars indicate ±SEM. Right, representative immunofluorescence images of DLD-1 BRCA2−/− cells treated with 10 nmol/L of AZD5305 (bottom) or untreated (top). D, Cell-cycle analysis by flow cytometry of DLD-1 BRCA2−/− (left) and WT cells (right) treated with AZD5305 for 48 hours at indicated concentrations. Bar charts represent the distribution of cells in the different cell-cycle phases, G1, S, and G2; below are representative cell-cycle scatter plots, with DNA and EdU intensity signal on x- and y-axes, respectively.
Figure 3. Efficacy of AZD5305 in BRCAm xenograft tumor models. Antitumor efficacy of AZD5305 dose-responses in MDA-MB-436 BRCA1 m TNBC xenograft (A), in CAPAN-1 BRCA2 m pancreatic cancer xenograft (B), and in isogenic xenograft tumor models DLD-1 BRCA2−/− (C) and DLD-1 WT (D). Mice were dosed with indicated doses of AZD5305 or 100 mg/kg olaparib once daily orally (PO) for 35 (A, B), 31 (C) or 20 (D) days. E and F, In experiments from A and C treatment was withdrawn as indicated and tumors were monitored for the regrowth. Graphs depict geomean tumor volume ±SEM and percent tumor growth inhibition (TGI) or regression (reg). Statistical significance was evaluated compared with the vehicle group using a one-tailed t test (*, P ≤ 0.05; **, P ≤ 0.01; ***, P ≤ 0.001).
Figure 3.
Efficacy of AZD5305 in BRCAm xenograft tumor models. Antitumor efficacy of AZD5305 dose–responses in MDA-MB-436 BRCA1m TNBC xenograft (A), in Capan-1 BRCA2m pancreatic cancer xenograft (B), and in isogenic xenograft tumor models DLD-1 BRCA2−/− (C) and DLD-1 WT (D). Mice were dosed with indicated doses of AZD5305 or 100 mg/kg olaparib once daily orally for 35 (A, B), 31 (C), or 20 (D) days. E and F, In experiments from A and C, treatment was withdrawn as indicated and tumors were monitored for the regrowth. Graphs depict geomean tumor volume ±SEM and percent tumor growth inhibition (TGI) or regression (reg). Statistical significance was evaluated compared with the vehicle group using a one-tailed t test (*, P ≤ 0.05; **, P ≤ 0.01; ***, P ≤ 0.001).
Figure 4. PK/PD/efficacy relationship of AZD5305 in a BRCA1 m TNBC xenograft tumor model. A, PK/PD relationship for AZD5305 in MDA-MB-436 tumor xenograft model. Mice were dosed with indicated dose levels of AZD5305 once daily orally (PO) for 5 days. Plasma and tumors were collected at indicated time after the last dose. Bars depict pharmacodynamics (PD) effects (total PARylation in the tumor lysates) and symbols with lines depict pharmacokinetics (PK) unbound plasma levels of AZD5305 coverage of target level (IC95). ND – compound not detected. B, Unbound plasma levels of AZD5305. Mice from experiments of Fig. 3A were bled at indicated time points after the oral dose of AZD5305 on day 7.
Figure 4.
PK/PD/efficacy relationship of AZD5305 in a BRCA1m TNBC xenograft tumor model. A, PK/PD relationship for AZD5305 in MDA-MB-436 tumor xenograft model. Mice were dosed with indicated dose levels of AZD5305 once daily orally for 5 days. Plasma and tumors were collected at indicated time after the last dose. Bars depict pharmacodynamic (PD) effects (total PARylation in the tumor lysates) and symbols with lines depict pharmacokinetic (PK) unbound plasma levels of AZD5305 coverage of target level (IC95). ND, compound not detected. B, Unbound plasma levels of AZD5305. Mice from experiments of Fig. 3A were bled at indicated time points after the oral dose of AZD5305 on day 7.
Figure 5. AZD5305 has reduced hematological toxicity in monotherapy and combination with carboplatin in rat pre-clinical models, when compared to dual PARP1/2 inhibitors. Monotherapy (A-C) Rats were dosed once daily (QD) orally for 14 days with the compounds and doses indicated. A, Unbound plasma concentration of AZD5305 (blue; 1 mg/kg), olaparib (red; 100 mg/kg) and niraparib (green; 57 mg/kg) at steady-state on day 14 with resulting unbound AUCs are as indicated. The dotted lines represent the efficacious IC95 (derived from the DLD-1 BRCA2−/− clonogenic assays) for AZD5305 and olaparib. B, Reticulocyte counts at baseline (B on x-axis) and at time points indicated, in animal groups treated with vehicle (gray), AZD5305 (blue), olaparib (red) or niraparib (green). C, Terminal erythroid precursor cell counts in AZD5305 (blue), olaparib (red) and niraparib (green) treatment groups as indicated by the legend. Statistical significance was tested relative to vehicle controls using a one-way ANOVA and Dunnett multiple comparison test, where **, P ≤ 0.01. Dots and error bars represent the mean of eight replicates ±SD. Combination (D-H): Rats were dosed with vehicle or once with intravenous (i.v.) carboplatin alone or in combination with PARPi QD for 14 days. D and E, Reticulocyte counts and hemoglobin levels are shown at baseline (B on x-axis) and over time (days; x-axis) for carboplatin+olaparib (red; D) or carboplatin+AZD5305 (blue) (E) in comparison with vehicle (gray) and carboplatin controls (green). F, Terminal erythroid precursor cell counts on day (d) 15 for the groups indicated, with olaparib study groups in red and AZD5305 study groups in blue. Statistical significance was tested relative to vehicle controls using a one-way ANOVA and Dunnett multiple comparison test, where ****, P ≤ 0.0001. G, Representative hematoxylin and eosin (H&E)-stained sections of bone marrow from vehicle controls, olaparib and AZD5305 monotherapy and carboplatin+PARPi treatment groups as indicated. H, Reticulocyte, hemoglobin and platelet levels over time (days; x-axis) from rats treated with vehicle (gray) or two doses of i.v. carboplatin alone (green) or in combination with continuous daily (QD) AZD5305 (blue) or olaparib (red) as indicated. All error bars represent the standard deviation of the mean of eight (A–C) or four (E) replicates.
Figure 5.
AZD5305 has reduced hematological toxicity in monotherapy and combination with carboplatin in rat pre-clinical models, when compared to dual PARP1/2 inhibitors. Monotherapy (A–C): Rats were dosed once daily (QD) orally for 14 days with the compounds and doses indicated. A, Unbound plasma concentration of AZD5305 (blue; 1 mg/kg), olaparib (red; 100 mg/kg), and niraparib (green; 57 mg/kg) at steady-state on day 14 with resulting unbound AUCs as indicated. The dotted lines represent the efficacious IC95 (derived from the DLD-1 BRCA2−/− clonogenic assays) for AZD5305 and olaparib. B, Reticulocyte counts at baseline (B on x-axis) and at time points indicated, in animal groups treated with vehicle (gray), AZD5305 (blue), olaparib (red), or niraparib (green). C, Terminal erythroid precursor cell counts in AZD5305 (blue), olaparib (red), and niraparib (green) treatment groups as indicated by the legend. Statistical significance was tested relative to vehicle controls using a one-way ANOVA and Dunnett multiple comparison test, where **, P ≤ 0.01. Dots and error bars represent the mean of eight replicates ±SD. Combination (D-H): Rats were dosed with vehicle or once with intravenous (i.v.) carboplatin alone or in combination with PARPi QD for 14 days. D and E, Reticulocyte counts and hemoglobin levels are shown at baseline (B on x-axis) and over time (days; x-axis) for carboplatin+olaparib (red; D) or carboplatin+AZD5305 (blue; E) in comparison with vehicle (gray) and carboplatin controls (green). F, Terminal erythroid precursor cell counts on day (d) 15 for the groups indicated, with olaparib study groups in red and AZD5305 study groups in blue. Statistical significance was tested relative to vehicle controls using a one-way ANOVA and Dunnett multiple comparison test, where ****, P ≤ 0.0001. G, Representative hematoxylin and eosin (H&E)-stained sections of bone marrow from vehicle controls, olaparib and AZD5305 monotherapy, and carboplatin+PARPi treatment groups as indicated. H, Reticulocyte, hemoglobin, and platelet levels over time (days; x-axis) from rats treated with vehicle (gray) or two doses of i.v. carboplatin alone (green) or in combination with continuous daily (QD) AZD5305 (blue) or olaparib (red) as indicated. All error bars represent the standard deviation of the mean of eight (A–C) or four (E) replicates.
Figure 6. Antitumor efficacy of AZD5305 in combination with carboplatin in vivo. A, Antitumor efficacy of AZD5305 in combination with carboplatin in the TNBC HBCx-9 PDX. B, Tolerability of the treatments was assessed by monitoring body weight changes throughout the treatment duration. C and D, Anti-tumor efficacy of dose response of AZD5305 in combination with carboplatin in HBCx-9 (C) and SUM149PT (D) tumor models. Mice were dosed with indicated dose levels of AZD5305 once daily orally (PO) and/or with carboplatin once weekly intraperitoneally (IP) for 4 weeks. Graphs depict geomean tumor volume ±SEM and percent tumor growth inhibition (TGI) or regression (reg). Statistical significance was evaluated compared to the vehicle group using a one-tailed t test (*, P ≤ 0.05; **, P ≤ 0.01; ***, P ≤ 0.001).
Figure 6.
Antitumor efficacy of AZD5305 in combination with carboplatin in vivo. A, Antitumor efficacy of AZD5305 in combination with carboplatin in the TNBC HBCx-9 PDX. B, Tolerability of the treatments was assessed by monitoring body weight changes throughout the treatment duration. C and D, Anti-tumor efficacy of dose response of AZD5305 in combination with carboplatin in HBCx-9 (C) and SUM149PT (D) tumor models. Mice were dosed with indicated dose levels of AZD5305 once daily orally (PO) and/or with carboplatin once weekly intraperitoneally (IP) for 4 weeks. Graphs depict geomean tumor volume ±SEM and percent tumor growth inhibition (TGI) or regression (reg). Statistical significance was evaluated compared to the vehicle group using a one-tailed t test (*, P ≤ 0.05; **, P ≤ 0.01; ***, P ≤ 0.001).

References

    1. Lord CJ, Ashworth A. PARP inhibitors: synthetic lethality in the clinic. Science 2017;355:1152–8. - PMC - PubMed
    1. LaFargue CJ, Dal Molin GZ, Sood AK, Coleman RL. Exploring and comparing adverse events between PARP inhibitors. Lancet Oncol 2019;20:e15–28. - PMC - PubMed
    1. Madariaga A, Bowering V, Ahrari S, Oza AM, Lheureux S. Manage wisely: poly (ADP-ribose) polymerase inhibitor (PARPi) treatment and adverse events. Int J Gynecol Cancer 2020;30:903–15. - PMC - PubMed
    1. Johannes JW, Balazs A, Barratt D, Bista M, Chuba MD, Cosulich S, et al. . Discovery of 5-{4-[(7-Ethyl-6-oxo-5,6-dihydro-1,5-naphthyridin-3-yl)methyl]piperazin-1-yl}-N-m ethylpyridine-2-carboxamide (AZD5305): a PARP1-DNA trapper with high selectivity for PARP1 over PARP2 and other PARPs. J Med Chem 2021;64:14498–512. - PubMed
    1. D'Amours D, Desnoyers S, D'Silva I, Poirier GG. Poly(ADP-ribosyl)ation reactions in the regulation of nuclear functions. Biochem J 1999;342:249–68. - PMC - PubMed

Publication types

Associated data