

Improvement in the Capacity for Activity Versus Improvement in Performance of Activity in Daily Life During Outpatient Rehabilitation
- PMID: 35930404
- PMCID: PMC9750113
- DOI: 10.1097/NPT.0000000000000413
Improvement in the Capacity for Activity Versus Improvement in Performance of Activity in Daily Life During Outpatient Rehabilitation
Abstract
We addressed questions about the potential discrepancy between improvements in activity capacity and improvements in activity performance in daily life. We asked whether this discrepancy is:
Common in routine, outpatient care, or an artifact of intervention studies?
Unique to upper limb (UL) rehabilitation, or is it seen in walking rehabilitation too?
Only seen in persons with stroke, or a broader neurorehabilitation problem?
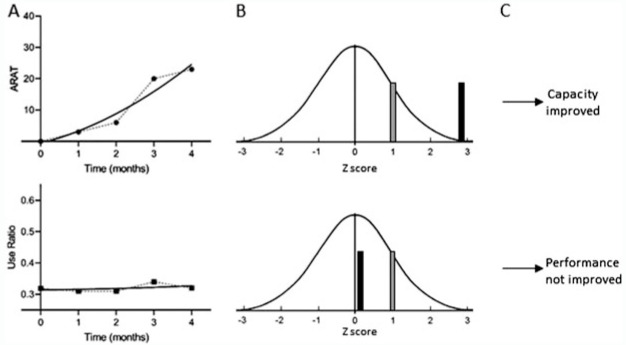
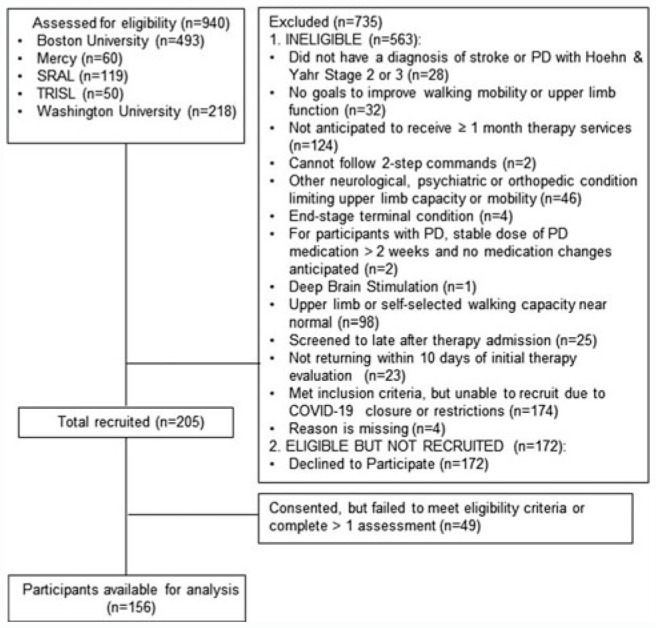
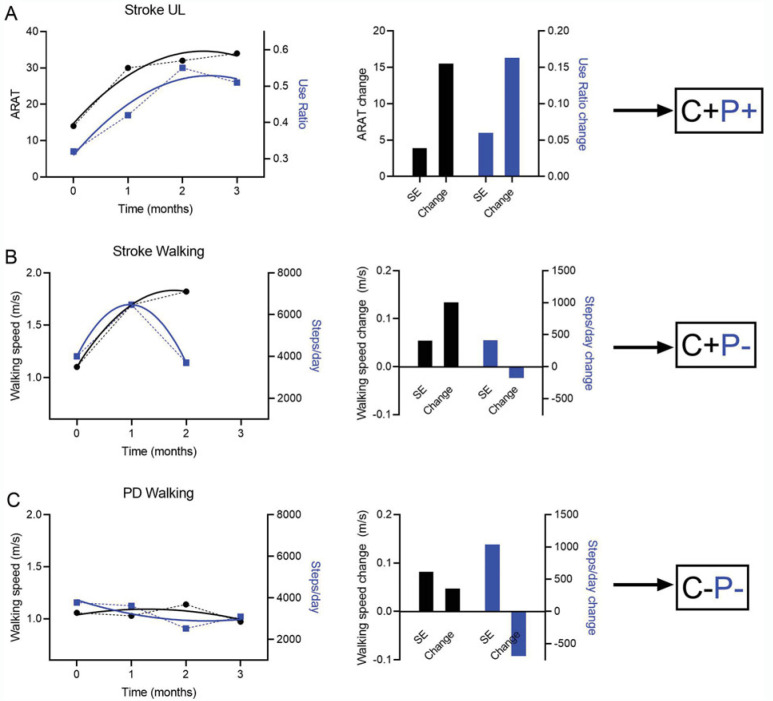
Methods:: A longitudinal, observational cohort of 156 participants with stroke or Parkinson disease (PD) receiving outpatient rehabilitation at 5 clinics was assessed around admission and monthly during their episode of care. Individual, longitudinal capacity (Action Research Arm Test or walking speed) and performance (wearable sensor measurements of use ratio or steps/day) data were modeled to extract predicted change scores. Simulation methods were used to determine whether an individual's change was greater than 1 standard error. Participants were classified into categories based on whether or not they improved in capacity (C+ or C−) and/or performance (P+ or P−).
Results:: A majority (59%) were classified as C+P−. Smaller portions of the sample were classified as C+P+ (20%) and C−P− (21%), with 1 participant (<1%) classified as C−P+. The proportions in the C+P− category were significantly larger in the stroke (χ2 = 48.7, P < 0.0001) and PD (χ2 = 24.3, P < 0.0001) walking subgroups than in the stroke UL subgroup.
Discussion and Conclusions:: The discrepancy between improvements in capacity and performance is a problem in routine, outpatient neurorehabilitation. If performance information were available, patients and clinicians could act to address it.
Video Abstract available for more insights from the authors (see the Video, Supplemental Digital Content 1, available at:
Conflict of interest statement
The authors declare no conflict of interest.
Figures
Similar articles
-
Comparison of unsupervised home-based pulmonary rehabilitation versus supervised hospital outpatient pulmonary rehabilitation in patients with chronic obstructive pulmonary disease.Expert Rev Respir Med. 2019 Dec;13(12):1195-1203. doi: 10.1080/17476348.2019.1675516. Epub 2019 Oct 9. Expert Rev Respir Med. 2019. PMID: 31575305
-
Effects of Comprehensive Outpatient Cardiac Rehabilitation on Exercise Capacity, Functional Status, and Quality of Life in People With Heart Failure: A Systematic Review and Meta-Analysis.Phys Ther. 2023 Nov 4;103(11):pzad119. doi: 10.1093/ptj/pzad119. Phys Ther. 2023. PMID: 37658777 Free PMC article.
-
[Comparison of home-based and outpatient, hospital-based, pulmonary rehabilitation in patients with chronic respiratory diseases].Rev Pneumol Clin. 2013 Feb;69(1):10-7. doi: 10.1016/j.pneumo.2012.11.003. Epub 2013 Jan 8. Rev Pneumol Clin. 2013. PMID: 23305933 French.
-
Efficacy of extended, comprehensive outpatient cardiac rehabilitation on cardiovascular risk factors: A nationwide registry.Eur J Prev Cardiol. 2020 Jul;27(10):1026-1033. doi: 10.1177/2047487319898958. Epub 2020 Jan 14. Eur J Prev Cardiol. 2020. PMID: 31937125
-
[Pulmonary rehabilitation in the in-hospital and outpatient phases].Rehabilitacion (Madr). 2020 Jul-Sep;54(3):191-199. doi: 10.1016/j.rh.2020.02.008. Epub 2020 Apr 27. Rehabilitacion (Madr). 2020. PMID: 32441270 Review. Spanish.
Cited by
-
The association of upper limb sensorimotor capacity, everyday inpatient behavior, and the effects of neurorehabilitation in persons with multiple sclerosis and stroke: a mixed-design study.J Neuroeng Rehabil. 2025 Mar 5;22(1):49. doi: 10.1186/s12984-025-01586-z. J Neuroeng Rehabil. 2025. PMID: 40045323 Free PMC article.
-
"Self-care selfies": Patient-uploaded videos capture meaningful changes in dexterity over 6 months.Ann Clin Transl Neurol. 2023 Dec;10(12):2394-2406. doi: 10.1002/acn3.51928. Epub 2023 Oct 25. Ann Clin Transl Neurol. 2023. PMID: 37877622 Free PMC article.
-
Trends and Innovations in Wearable Technology for Motor Rehabilitation, Prediction, and Monitoring: A Comprehensive Review.Sensors (Basel). 2024 Dec 13;24(24):7973. doi: 10.3390/s24247973. Sensors (Basel). 2024. PMID: 39771710 Free PMC article. Review.
-
Beyond statistical significance: Embracing minimal clinically important difference for better patient care.World J Methodol. 2025 Mar 20;15(1):97814. doi: 10.5662/wjm.v15.i1.97814. eCollection 2025 Mar 20. World J Methodol. 2025. PMID: 40115403 Free PMC article. Review.
-
Perspectives of key stakeholders on integrating wearable sensor technology into rehabilitation care: a mixed-methods analysis.Front Digit Health. 2025 Apr 28;7:1534419. doi: 10.3389/fdgth.2025.1534419. eCollection 2025. Front Digit Health. 2025. PMID: 40357237 Free PMC article.
References
-
- World Health Organization. Towards a Common Language for Functioning, Disability, and Health: ICF. Geneva, Switzerland: World Health Organization; 2002.
-
- World Health Organization. International Classification of Functioning, Disability, and Health: ICF. Geneva, Switzerland: World Health Organization; 2001.
Publication types
MeSH terms
Grants and funding
LinkOut - more resources
Full Text Sources
Medical
Miscellaneous
