. 2022 Dec;11(1):2132-2146.
doi: 10.1080/22221751.2022.2110524.

Airway acidification impaired host defense against Pseudomonas aeruginosa infection by promoting type 1 interferon β response

Affiliations

Airway acidification impaired host defense against Pseudomonas aeruginosa infection by promoting type 1 interferon β response

Yang Liu et al. Emerg Microbes Infect. 2022 Dec.

Abstract

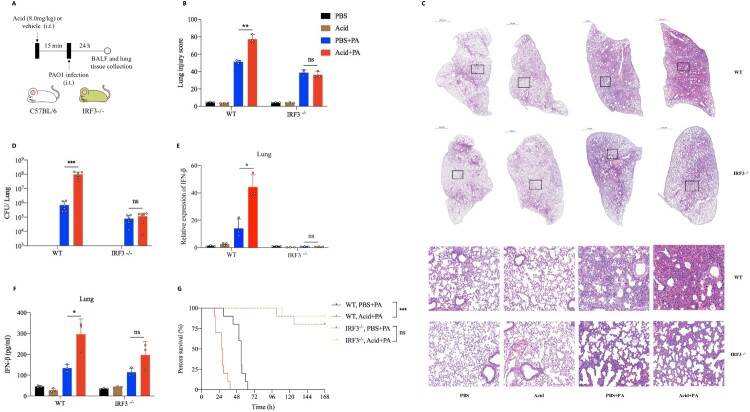
Airway microenvironment played an important role in the progression of chronic respiratory disease. Here we showed that standardized pondus hydrogenii (pH) of exhaled breath condensate (EBC) of bronchiectasis patients was significantly lower than that of controls and was significantly correlated with bronchiectasis severity index (BSI) scores and disease prognosis. EBC pH was lower in severe patients than that in mild and moderate patients. Besides, acidic microenvironment deteriorated Pseudomonas aeruginosa (P. aeruginosa) pulmonary infection in mice models. Mechanistically, acidic microenvironment increased P. aeruginosa outer membrane vesicles (PA_OMVs) released and boosted it induced the activation of interferon regulatory factor3 (IRF3)-interferonβ (IFN-β) signalling pathway, ultimately compromised the anti-bacteria immunity. Targeted knockout of IRF3 or type 1 interferon receptor (IFNAR1) alleviated lung damage and lethality of mice after P. aeruginosa infection that aggravated by acidic microenvironment. Together, these findings identified airway acidification impaired host resistance to P. aeruginosa infection by enhancing it induced the activation of IRF3-IFN-β signalling pathway. Standardized EBC pH may be a useful biomarker of disease severity and a potential therapeutic target for the refractory P. aeruginosa infection. The study also provided one more reference parameter for drug selection and new drug discovery for bronchiectasis.

Keywords: Bronchiectasis; P. aeruginosa; airway acidification; outer membrane vesicles; type I interferonβ.


Conflict of interest statement

No potential conflict of interest was reported by the author(s).

Figures

Figure 1.
Figure 1.
EBC pH was significantly decreased in bronchiectasis and was associated with changes of important clinical indicators. The detailed procedure of the study was shown in panel (A). Comparison of the standardized EBC pH between bronchiectasis patients and healthy control was shown in panel (B); Correlation between the standardized EBC pH and BSI score (r = −0.4822, p < 0.0001) was shown in panel (C); Comparisons of the standardized EBC pH in patients with mild, moderate and severe bronchiectasis were shown in panel (D); Receiver operating characteristic curve for the validity of the standardized EBC pH to discriminate between the health control vs bronchiectasis patients was shown in panel (E), the validity of the standardized EBC pH to discriminate between the severe bronchiectasis vs mild and moderate patients was shown in panel (F); Difference of the time to the first acute exacerbation after enrolment for patients with the standardized EBC pH less than 7.755 and those with EBC pH greater than or equal to 7.755 were shown in panel (G); Correlations between the standardized EBC pH and SGRQ score (r = −0.2320, p = 0.0372) was shown in panel (H); Comparisons of the standardized EBC pH in different subgroups such as the number of lobes involved was shown in panel (I). **p < 0.01; ***p < 0.001.
Figure 2.
Figure 2.
Acidic microenvironment deteriorated P. aeruginosa infection in vitro and aggravated its induced type 1 interferonβ response. (A) Shown was the growth curves of PAO1 in normal or acidic (pH = 6.3) bacterial culture environments; (B) Comparison of the intracellular bacterial survived rate of PAO1 in mice peritoneal macrophages in normal or acidic (pH = 6.3) cell cultures, the peritoneal macrophages were stimulated with PAO1(MOI = 0.1) for 2 h before lysis; (C) Comparison of the adhesion efficiency of PAO1 to A549 cells in normal or acidic (pH = 6.3) cell cultures, the A549 cells were stimulated with PAO1(MOI = 10) for 1 h before lysis; (D) and (E) KEGG enrichment scatterplot and the heat map showed the alteration of important genes expression in mice peritoneal macrophages following by P. aeruginosa LPS (1ug/ml) stimulation for 2 h in normal or acidic (pH = 6.3) cell cultures; (F) and (G) Comparisons of the IFN-β expression following by PAO1 infection in normal or acidic (pH = 6.3) cell cultures, the peritoneal macrophage and immortalized bone marrow-derived macrophages (iBMDM) of mice were stimulated with PAO1(MOI = 2) for 2 h; (H) and (I) Western blot analysis of the proteins in innate immune signalling pathway, which were isolated from peritoneal macrophage and iBMDM of mice. The peritoneal macrophage or iBMDM were stimulated with PAO1(MOI = 10) in normal or acidic (pH = 6.3) cell cultures for different time before lysis; (J) Experiment and analysis scheme for PAO1 infection after acid pretreatment. Six week old female C57BL/6 mice were intratracheally infected with PAO1(2*10^6 cfu in 25 ul PBS, per mouse) or PBS for 24 h with or without lactic acid pretreatment (8.0 mg/kg), and monitored for (K) the IFN-β gene expression and (L) IFN-β protein production in mice lung tissue; **p < 0.01; ***p < 0.001.
Figure 3.
Figure 3.
Acidic microenvironment exacerbated P. aeruginosa lung infection by aggravating type 1 interferonβ response in vitro and in vivo. (A) The intracellular bacterial survived rate of PAO1 in mice peritoneal macrophages that pretreated with vehicle control or 10 ng/ml recombinant human IFN-β for 1 h, then stimulated with PAO1(MOI = 0.1) for 2 h before lysis; (B) Comparisons of the intracellular survived bacteria number in peritoneal macrophages of WT and IFNAR1−/− mice, cells were stimulated with PAO1(MOI = 1) for 2 h in normal or acidic (pH = 6.3) cell cultures before lysis; (C) and (D) The amounts of PAO1 adhered to A549 cells in normal or acidic (pH = 6.3) cell cultures, cells were pretreated with DMSO/IRF3 inhibitor BX795(1uM) or lgG isotype ctrl/purified anti-mouse IFN-β antibody (10ug/ml) for 1 h, then stimulated with PAO1(MOI = 10) for 1 h before lysis; (E) Visualizations of adhered PAO1 to A549 cells in normal or acidic (pH = 6.3) cell cultures by fluorescence microscopy. The A549 cells were pretreated with DMSO/IRF3 inhibitor BX795(1uM) or lgG isotype ctrl/purified anti-mouse IFN-β antibody (10ug/ml) for 1 h, then stimulated with GFP- PAO1(MOI = 10) (green) for another 1 h. Cell membrane was visualized by TRITC-phalloidin (red). Nucleus were stained with DAPI (blue); (F) Experiment and analysis scheme for PAO1 infection in WT and IFNAR1−/− mice after acid pretreatment. IFNAR1 knockout mice with C57BL/6 background and six week age-matched WT mice were intratracheally infected with PAO1 (2*10^6 cfu in 25ul PBS, per mouse) or PBS for 24 h with or without lactic acid pretreatment (8.0 mg/kg), and monitored for (G) and (H) the infiltration of inflammatory cells in lung following by H&E staining and the lung injury scores caused by the infection, (I) the bacterial load in lung tissue, (J) and (K) IFN-β gene expression and protein production of mice lung tissue, (L) and (M) the immune cells classification and quantification identified in the balf of mice by flow cytometry and (N) the survival (n = 10 per group). *p < 0.05; **p < 0.01; ***p < 0.001.
Figure 4.
Figure 4.
PA_OMVs were actively taken up by macrophages through endocytic pathways and activated multiple receptors to induce type 1 interferonβ production. (A) The morphology of PAO1-derived OMVs were shown by transmission electron microscope; (B) Size distribution of OMVs were determined by nano measure 1.2; (C) Western blot analysis of the proteins in innate immune signalling pathway, peritoneal macrophages of mice were stimulated with purified OMVs (0.5 ug/ml) for different time points before lysis; (D) The expression of IFN-β in peritoneal macrophages of mice following by purified OMVs (0.5 ug/ml) stimulation for different time points; (E) The expression of IFN-β following by purified OMVs (0.5 ug/ml) stimulation for different time points in peritoneal macrophages pretreated with DMSO or resatorvid (1uM) for 1 h; (F) The expression of IFN-β following by purified OMVs (0.5 ug/ml) stimulation for different time points in peritoneal macrophages of WT or cGAS KO mice; (G) and (H) The expression of IFN-β following by purified OMVs (0.5 ug/ml) stimulation for different time points in peritoneal macrophages pretreated with bafilomycin A1(1uM) or GSK8612 (1 uM) for 1 h; (I) The expression of IFN-β following by purified OMVs (0.5ug/ml) stimulation for 2 h in peritoneal macrophages pretreated with DMSO or BX795 (1uM) for 1 h; (J) Visualization of internalized OMVs by fluorescence microscopy. Peritoneal macrophages were incubated with Dil-labeled OMVs(0.5ug/ml) for 2 h at 37°C. Cell membrane was visualized by immunostaining with antibodies against the zonula occludens ZO-1 protein followed by Alexa Fluor 488-conjugated secondary antibody (green). Nucleus were stained with DAPI (blue). Internalized Dil-labeled OMVs are visualized in red; (K) and (L) IFN-β gene expression and protein production following by purified OMVs (0.5ug/ml) stimulation for 2 h in peritoneal macrophages pretreated with Nocodazole (25ug/ml) or Chlorpromazine (5ug/ml) for 1 h; *p < 0.05; **p < 0.01; ***p < 0.001.
Figure 5.
Figure 5.
Acidic microenvironment increased IFN-β production by enhancing IRF3 activation signal induced by OMVs stimulation. (A) BCA protein quantitative analysis of OMVs total protein released by PAO1 in normal or acidic (pH = 6.3) bacterial cultures that adjusted by lactic acid; (B) The IFN-β expression following by OMVs (1.0ug/ml) stimulation for 2 h in normal, acidic (pH = 6.3) or alkalic (pH = 8.7) cell cultures; (C) Western blot analysis of the proteins in innate immune signalling pathway, peritoneal macrophages of mice were stimulated with purified OMVs (0.5 ug/ml) for different time points under different culture environments before lysis; (D) The level of IFN-β protein following by OMVs (1.0 ug/ml) stimulation for different time points under normal, acidic (pH = 6.3) or alkalic (pH = 8.7) culture environments; (E) Immunofluorescence analysis of IRF3 translocation and activation in peritoneal macrophages after OMVs (0.5 ug/ml) stimulation for 2 h in normal, acidic (pH = 6.3) or alkalic (pH = 8.7) culture environments. The nuclear translocation and activation of IRF3 was calculated by calculating the proportion of IRF3 that enters the nucleus completely, partially enters the nucleus, and does not enter the nucleus at all. At least 10 microscopic fields with more than 300 cells were calculated on each group; (F) The IFN-β expression following by OMVs (0.5 ug/ml) stimulation for 2 h in normal or acidic (pH = 6.3) cell cultures, the peritoneal macrophages of mice were pretreated with DMSO or BX795(1uM) for 1 h; (G) Western blot analysis of the proteins in innate immune signalling pathway isolated from peritoneal macrophages of mice, which were pretreated with DMSO or BX795(1uM) for 1 h following by OMVs (0.5ug/ml) stimulation for different time points in normal or acidic (pH = 6.3) cell cultures; ***: p < 0.001.
Figure 6.
Figure 6.
Targeted knockout of IRF3 reversed lung damage from P. aeruginosa infection that exacerbated by acidification. (A) Experiment and analysis scheme for PAO1 infection in WT and IRF3−/− mice after acid pretreatment. IRF3 knockout mice with C57BL/6 background and age-matched WT mice were intratracheally infected with PAO1(2*10^6 cfu in 25ul PBS, per mouse) or PBS for 24 h with or without lactic acid pretreatment (8.0 mg/kg), and monitored for (B) and (C) the lung pathological damage following by H&E staining and lung damage scores, (D) the bacterial load, (E) IFN-β gene expression, (F) IFN-β protein production and (G) the survival (n = 10 per group); *p < 0.05; **p < 0.01; ***p < 0.001.
Figure 7.
Figure 7.
A model of acidic microenvironment mediated the amplification effect of type 1 interferonβ response following by P. aeruginosa infection. OMVs were involved in P. aeruginosa mediated the induction of IFN-β. Acidic microenvironment promoted the release of PA_OMVs and enhanced the phosphorylation of IRF3 induced by P. aeruginosa or PA_OMVs, leading to a significant increase in IFN-β production, which in turn led to the impaired host defense against P. aeruginosa pulmonary infection.

Similar articles

Cited by

References

    1. Polverino E, Goeminne PC, McDonnell MJ, et al. . European respiratory society guidelines for the management of adult bronchiectasis. Eur Respir J. 2017 Sep;50(3):1700629. - PubMed
    1. Snell N, Gibson J, Jarrold I, et al. . Epidemiology of bronchiectasis in the UK: findings from the British lung foundation's ‘Respiratory health of the nation’ project. Respir Med. 2019 Oct–Nov;158:21–23. - PubMed
    1. Ringshausen FC, Rademacher J, Pink I, et al. . Increasing bronchiectasis prevalence in Germany, 2009-2017: a population-based cohort study. Eur Respir J. 2019 Dec;54(6):1900499. - PubMed
    1. Choi H, Yang B, Nam H, et al. . Population-based prevalence of bronchiectasis and associated comorbidities in South Korea. Eur Respir J. 2019 Aug;54(2):1900194. - PubMed
    1. Luo RG, Miao XY, Luo LL, et al. . Presence of pldA and exoU in mucoid Pseudomonas aeruginosa is associated with high risk of exacerbations in non-cystic fibrosis bronchiectasis patients. Clin Microbiol Infect: The Off Publ Eur Soc Clin Microbiol Infect Dis. 2019 May;25(5):601–606. - PubMed