. 2022 Aug 5;17(8):e0272569.
doi: 10.1371/journal.pone.0272569. eCollection 2022.

The impact of the SARS COV-2 pandemic on pediatric accesses in ED: A Healthcare Emergency Information System analysis

Affiliations

The impact of the SARS COV-2 pandemic on pediatric accesses in ED: A Healthcare Emergency Information System analysis

Francesca Mataloni et al. PLoS One. .

Abstract

Background: The Emergency Department (ED) services play a fundamental role in managing the accesses of potential Sars-Cov-2 cases. The aim of this study is to evaluate the impact of the SARS COV-2 pandemic on pediatric accesses in Emergency Department of Lazio Region.

Methods: The population includes all pediatric accesses (0-17 years) in the ED of Lazio Region during 2019 and 2020. Accesses were characterized by age, week and calendar period. Four periods were defined: pre-lockdown, lockdown, post-lockdown and the second wave. The trend of ED accesses (total or for specific cause) in 2020 (by period and week) were compared to them occurred in 2019. ED visits have been described by absolute frequency and percentage variation. Percentage variation of adult was also reported to compare the trend in adult and young population. The Chi-square test was used to compare characteristics of admissions in 2019 and 2020.

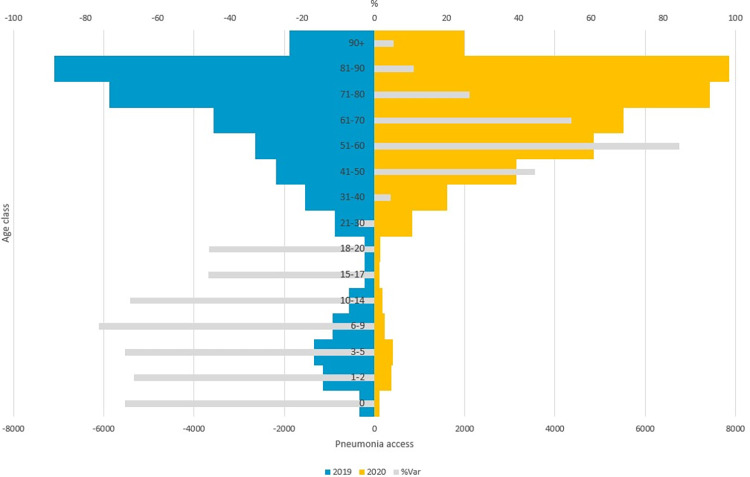
Results: There is a large decrease of pediatric accesses in 2020 compared to 2019 (-47%), especially for younger age-classes (1-2 years: -52.5% and 3-5 years: -50.5%). Pediatric visits to ED in 2020 decreased following the same trend of adults, but more drastically (-47% vs -30%). ED accesses for suspected COVID-19 pneumonia trend show different characteristics between children and adults: in adults there is an increase in 2020, especially during the 2nd wave period (+321%), in children there is a decrease starting from the lockdown period to the achievement of the lowest level in December 2020 (-98%).

Conclusions: This descriptive study has identified a decrease of total pediatric accesses in ED in 2020 compared to 2019 and a different trend of accesses by adult and young population especially by cause. The monitoring of paediatric accesses could be a useful tool to analyse the trend of COVID-19 pandemic in Italy and to reprogramming of the healthcare offer according to criteria of clinical and organizational appropriateness.


Conflict of interest statement

The authors have declared that no competing interests exist.

Figures

Fig 1
Fig 1. Weekly trend of pediatric access to ED for all causes (2019, 2020).
The blue line refers to pediatric ED accesses in 2019, the yellow line to pediatric ED accesses in 2020. The grey bars indicate the percent variation of pediatric ED accesses in 2020 and 2019 and purple bars indicate the percent variation of adult ED accesses in 2020 and 2019. Different colours of the time represent the four phases of the pandemic in 2020: Grey = pre-lockdown, orange = lockdown, light blue = post lockdown and yellow = the second wave.The trend of pediatric accesses by week showed a higher number of visits in ED during the end of January and the first part of February 2020 compared to 2019 and then a huge decreased starting from the end of February 2020 and across the beginning of the lockdown period. From the end of March 2020 to September, pediatric visits to ED start to increase but, in spite of that, are lower compared to 2019. This trend decreases again during the 2nd wave period. The percentage variation of pediatric access in 2020, compared to 2019, had the same trend of what was observed in adult population (%Var adult) in the same period, but the reduction is higher.
Fig 2
Fig 2. Weekly trend of pediatric access to ED for suspected COVID-19 pneumonia (2019, 2020).
The blue line refers to pediatric ED accesses in 2019 for pneumonia, the yellow line refers to pediatric ED accesses in 2020 for pneumonia. The grey bars indicate the percent variation of pediatric ED accesses for pneumonia in 2020 and 2019 and purple bars indicate the percent variation of ED accesses for pneumonia in 2020 and 2019 for the adult population. Different colours of the time represent the four phases of the pandemic in 2020: Grey = pre-lockdown, orange = lockdown, light blue = post lockdown and yellow = the second wave.The trend of pneumonia ED visits in 2020 shows an important decreas starting from the first week of February to mid-April and then became stable with a number of accesses lower than 20 by week. This trend in the adult population is different. For adults there was an increment during the lockdown period, a decrease during the second part of the lockdown period and the summer and then a clear increase during the 2nd wave reaching a growth of access of 321% in November 2020 compared to the same week in 2019 (1,794 vs 426).
Fig 3
Fig 3. ED access for suspected COVID-19 pneumonia, by age class and year (2019, 2020).
The blue bars refer to ED accesses for suspected COVID-19 pneumonia in 2019, the yellow bars refer to for suspected COVID-19 pneumonia in 2020 and the grey bars indicate the percent variation of ED accesses for pneumonia in 2020 and 2019.
Fig 4
Fig 4. Weekly trend of pediatric access to ED for symptom of fever (2019, 2020).
The blue line refers to pediatric ED accesses in 2019 for fever, the yellow line refers to pediatric ED accesses in 2020 for fever. The grey bars indicate the percent variation of pediatric ED accesses for fever in 2020 and 2019 and purple bars indicate the percent variation of ED accesses for fever in 2020 and 2019 for the adult population. Different colours of the time represent the four phases of the pandemic in 2020: Grey = pre-lockdown, orange = lockdown, light blue = post lockdown and yellow = the second wave. In the pre-lockdown period, we found a greater number of accesses in ED with symptoms of fever in 2020 compared to 2019 (+10%). A trend inversion was observed at the beginning of the lockdown period (-76.6%) and continues until the end of the post-lockdown period (-65.6%). At the beginning of the 2nd wave period, 2019 and 2020 trend are quite similar, but the difference increases in the last weeks of the year.

References

    1. Wee LE, Fua TP, Chua YY, Ho AFW, Sim XYJ, Conceicao EP, et al.. Containing COVID-19 in the emergency room: the role of improved case detection and segregation of suspect cases. Acad Emerg Med. 2020. May;27(5):379–387. doi: 10.1111/acem.13984 - DOI - PMC - PubMed
    1. Mannelli C. Whose life to save? Scarce resources allocation in the COVID-19 outbreak. Journal of Medical Ethics 2020; 46:364–366. doi: 10.1136/medethics-2020-106227 - DOI - PubMed
    1. Ordinanza del Presidente n. Z00003 del 06.03.2020 –Misure per la prevenzione e gestione dell’emergenza epidemiologica da COVID-19.
    1. Scaramuzza A, Tagliaferri F, Bonetti L, Soliani M, Morotti F, Bellone S, et al.. Changing admission patterns in pediatric emergency departments during the COVID-19 pandemic. Arch Dis Child. 2020. Jul;105(7):704–706. doi: 10.1136/archdischild-2020-319397 Epub 2020 May 27. . - DOI - PubMed
    1. Parri N, Lenge M, Cantoni B, Arrighini A, Romanengo M, Urbino A, et al.. COVID-19 in 17 Italian Pediatric Emergency Departments. Pediatrics. 2020. Dec;146(6): e20201235. doi: 10.1542/peds.2020-1235 Epub 2020 Sep 23. . - DOI - PubMed