. 2022 Aug 5;8(31):eabn4002.
doi: 10.1126/sciadv.abn4002. Epub 2022 Aug 5.

Neonatal BCG vaccination is associated with a long-term DNA methylation signature in circulating monocytes

Affiliations

Neonatal BCG vaccination is associated with a long-term DNA methylation signature in circulating monocytes

Samantha Bannister et al. Sci Adv. .

Abstract

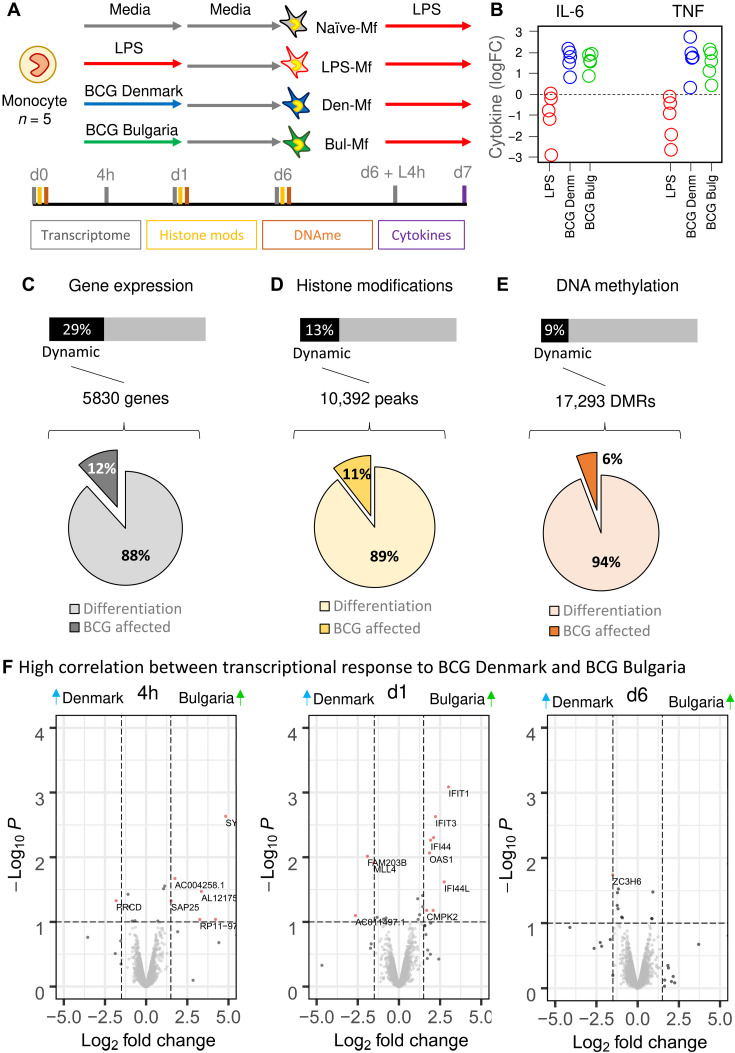
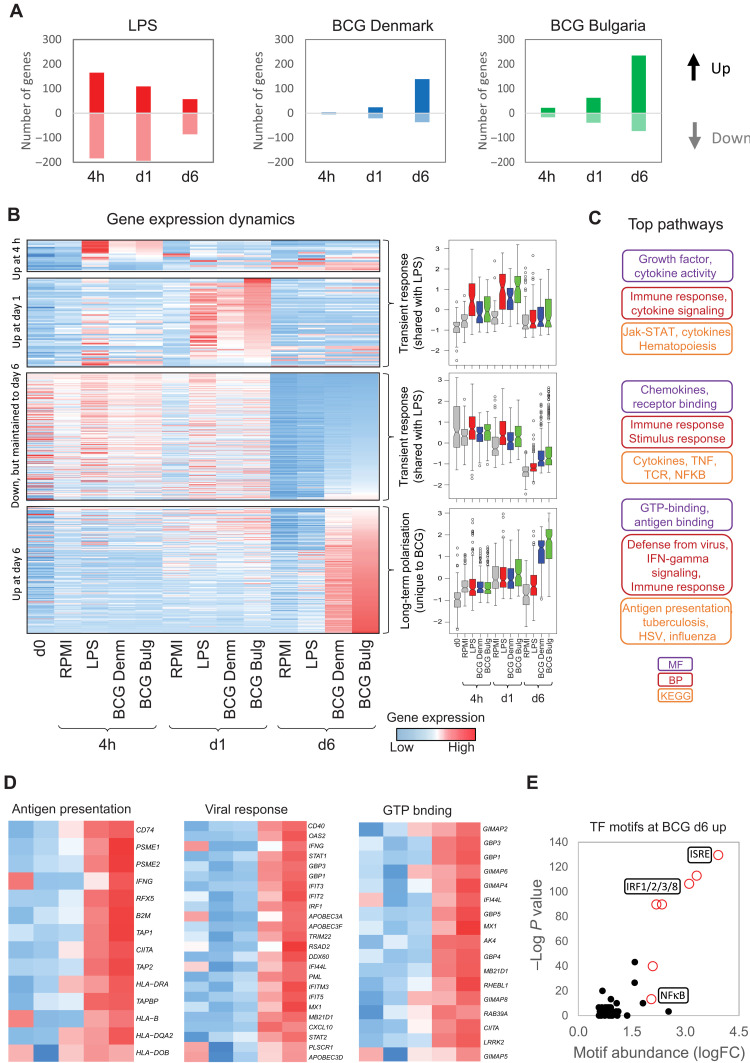
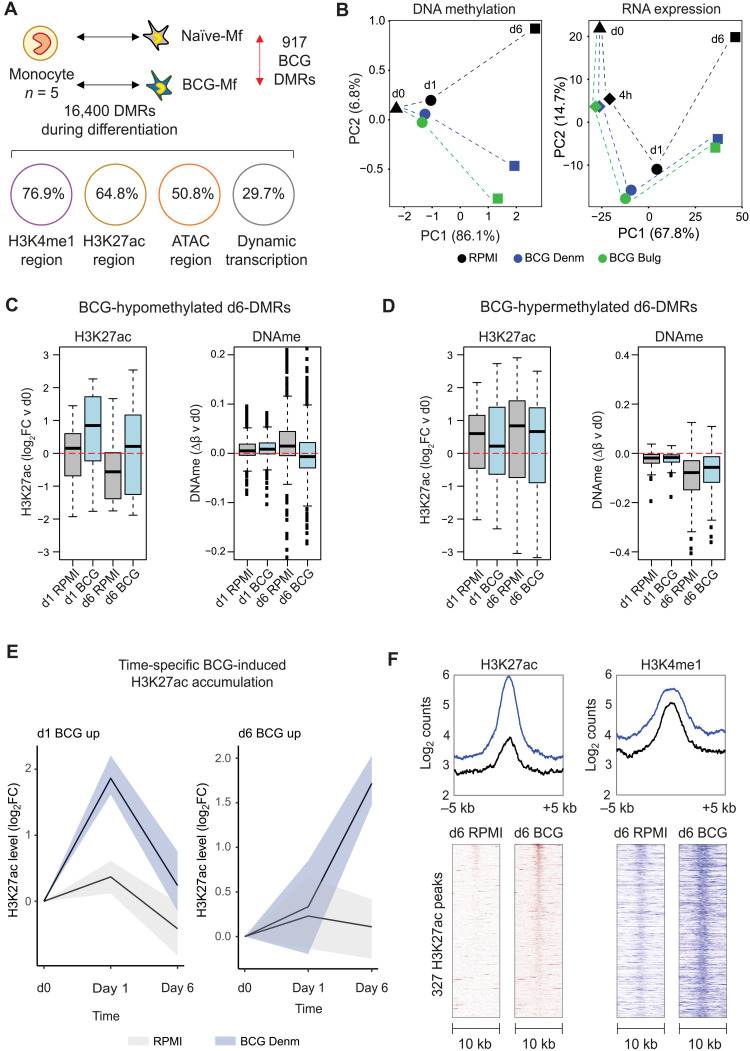
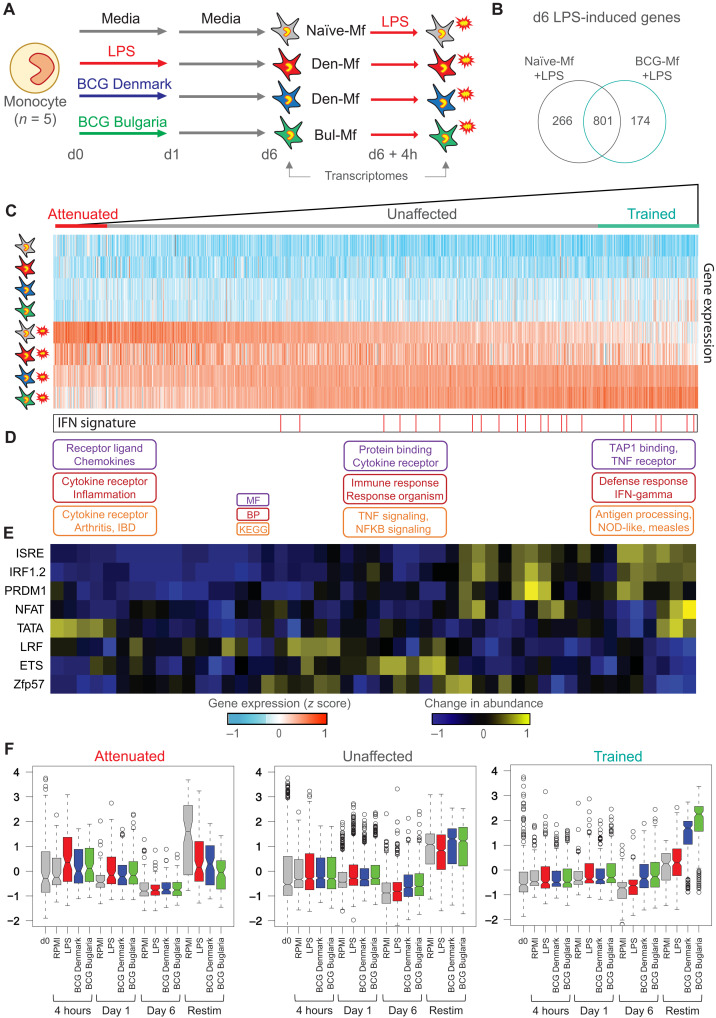
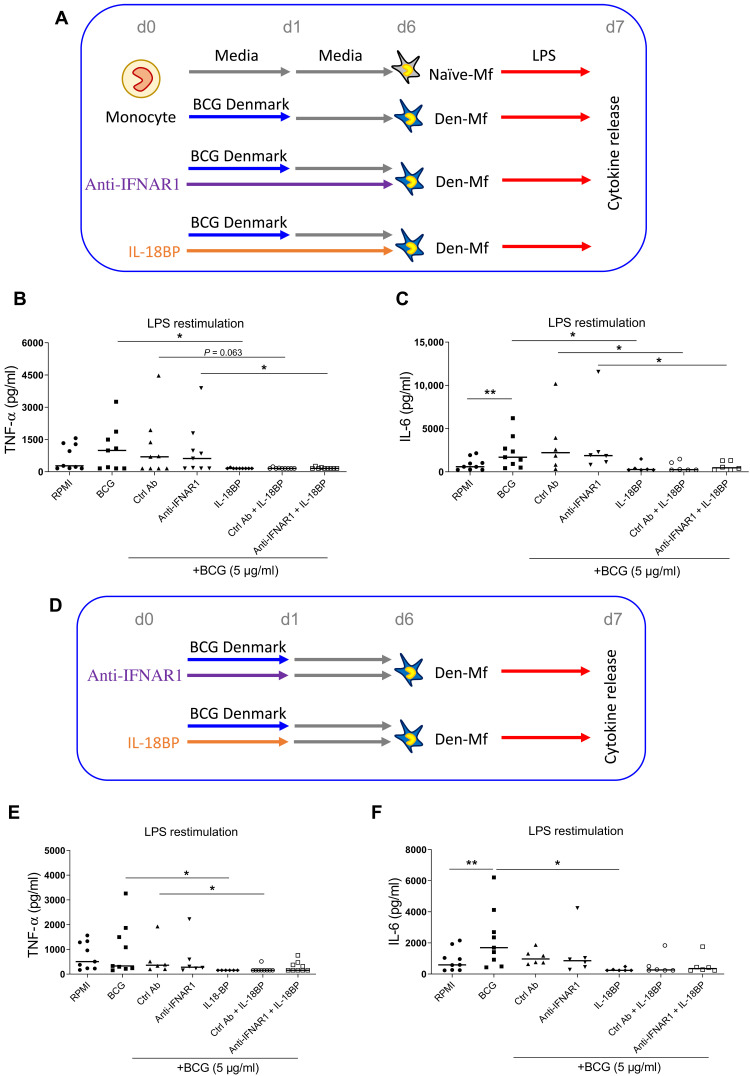
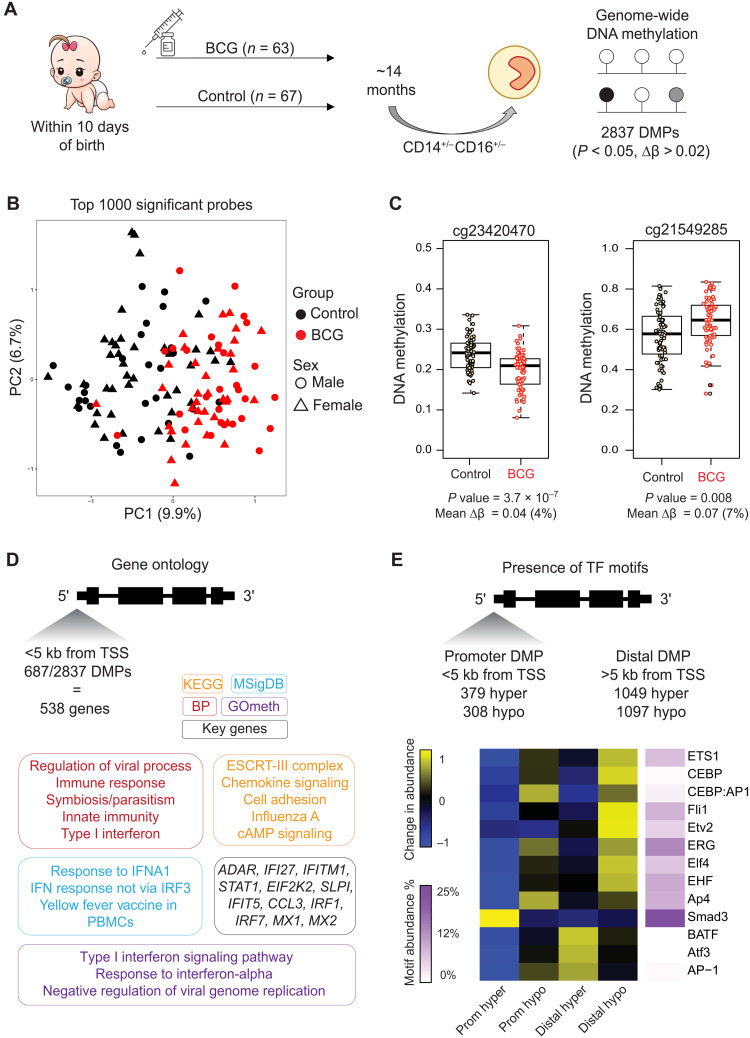
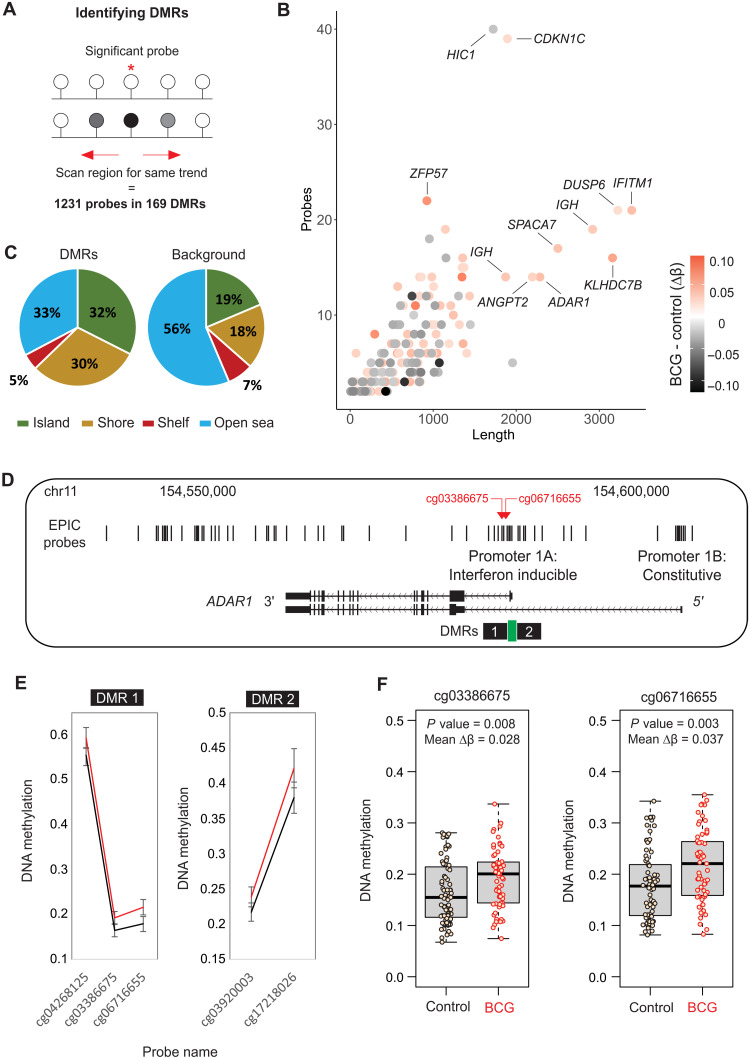
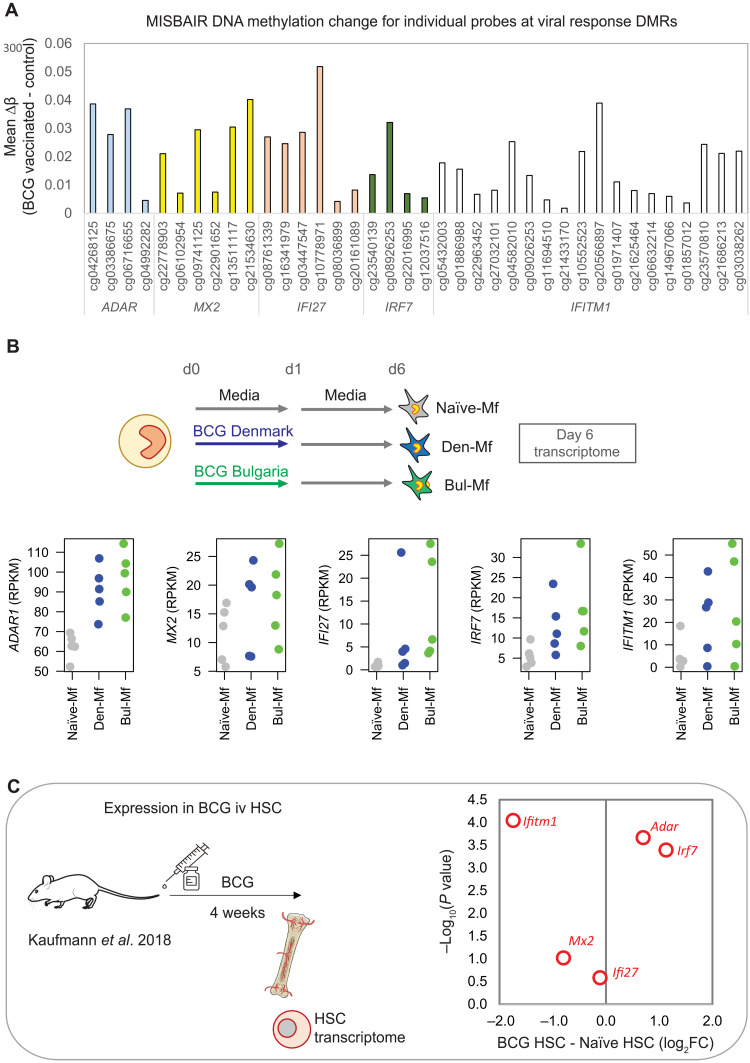
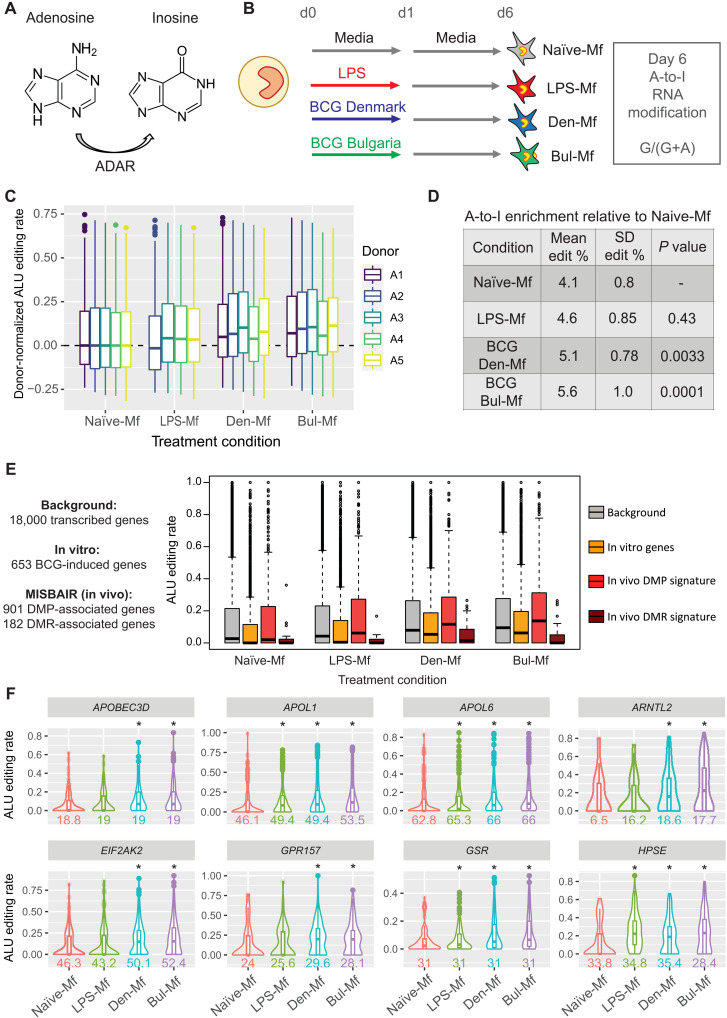
Trained immunity describes the capacity of innate immune cells to develop heterologous memory in response to certain exogenous exposures. This phenomenon mediates, at least in part, the beneficial off-target effects of the BCG vaccine. Using an in vitro model of trained immunity, we show that BCG exposure induces a persistent change in active histone modifications, DNA methylation, transcription, and adenosine-to-inosine RNA modification in human monocytes. By profiling DNA methylation of circulating monocytes from infants in the MIS BAIR clinical trial, we identify a BCG-associated DNA methylation signature that persisted more than 12 months after neonatal BCG vaccination. Genes associated with this epigenetic signature are involved in viral response pathways, consistent with the reported off-target protection against viral infections in neonates, adults, and the elderly. Our findings indicate that the off-target effects of BCG in infants are accompanied by epigenetic remodeling of circulating monocytes that lasts more than 1 year.


Figures

Fig. 1.
Fig. 1.. Epigenetic and transcriptional remodeling of monocytes induced by BCG vaccine in vitro.
(A) In vitro experimental setup for epigenomic interrogation of induction of TRIM with two strains of the BCG vaccine: BCG Denmark (blue line) and BCG Bulgaria (green line) and tolerance with LPS (red line). (B) Macrophages derived from BCG-exposed monocytes produce higher levels of TNF and IL-6 on restimulation with LPS on day 6 relative to naïve macrophages, while those exposed to LPS show reduced levels. (C) A total of 5830 protein-coding genes were differentially expressed in the in vitro model, with 88% related to monocyte-to-macrophage differentiation and 12% (700 genes) affected by BCG exposure. (D) A total of 10,392 H3K27ac marked regions were dynamic, with 11% affected by BCG exposure. (E) A total of 17,293 DMRs were identified, containing 130,000 CpG sites. (F) Volcano plots showing differential expression between BCG Denmark– and BCG Bulgaria–exposed monocytes at 4 hours, 1 day, and 6 days after exposure. A total of 26 genes were differentially expressed across these time points, indicating a strong concordance between the transcriptional response to the two BCG vaccine strains.
Fig. 2.
Fig. 2.. BCG exposure induces both transient and longer-term transcriptional signatures.
(A) Bar plot showing the number of genes that are up-regulated (positive values) or down-regulated (negative values) in response to LPS or BCG Denmark or BCG Bulgaria at 4 hours, 1 day, and 6 days after exposure. (B) Heatmap and box plots of differentially expressed genes in response to BCG Denmark or BCG Bulgaria over time. There are two distinct sets of transcriptional dynamics: a transient up-regulation of 77 genes within the first 24 hours that is shared between BCG- and LPS-exposed monocytes, and a delayed transcriptional up-regulation of 416 genes at day 6 (5 days after stimulation) that is specific to BCG-exposed macrophages. Box plots are mean-centered RPKM values and show median, 25th, and 75th quartiles (gray, RPMI; red, LPS; blue, BCG Denmark; green, BCG Bulgaria). (C) Gene ontology analysis shows that the transient transcriptional response is related to cytokine release and nuclear factor κB (NFκB) signaling, while the delayed response is related to IFN signaling and response to virus. MF, molecular function; BP, biological process; KEGG, Kyoto Encyclopedia of Genes and Genomes. (D) Heatmap of specific gene sets that show BCG-specific up-regulation at day 6 involved in antigen presentation, viral responses [e.g., guanylate-binding proteins (GBPs)], and guanosine triphosphate (GTP) binding. (E) Scatter plot of −log10 P value (y axis) and fold change abundance (x axis) of a motif relative to background occurrence. Motif analysis identified the ISRE as enriched in the promoters of genes that show BCG-specific up-regulation at day 6.
Fig. 3.
Fig. 3.. BCG-induced DNA methylation signature is preceded by posttranslational histone modification remodeling.
(A) DNA methylation was profiled at days 0, 1, and 6 following BCG exposure, and 16,400 DMRs were related to monocyte-to-macrophage differentiation. A total of 77 and 917 DMRs were identified in both BCG Denmark– and BCG Bulgaria–exposed monocytes and macrophages at days 1 and 6, respectively. The 917 DMRs were linked to protein-coding genes, of which 29.7% were differentially expressed during differentiation and 5.6% were induced by BCG. In terms of chromatin marks, DMRs overlapped most strongly with H3K4me1 and H3K27ac regions, and to a lesser extent open chromatin [assay for transposase-accessible chromatin (ATAC) peaks]. (B) Principal components analysis (PCA) plot based on BCG-associated DNA methylation and transcriptional changes. In both datasets, differentiation is seen on PC1 and effect of BCG on PC2, with the BCG effect most clear at day 6. (C and D) Box plots showing change in H3K27ac signal and mean DNA methylation levels at DMRs. (C) At BCG-hypomethylated DMRs, BCG-Mfs show lower DNA methylation compared to RPMI-Mf, which is preceded by an accumulation of H3K27ac signal at day 1 in BCG-exposed macrophages. (D) At BCG-hypermethylated DMRs, the H3K27ac level in BCG-exposed cells is lower than in RPMI-exposed cells at day 1. (E) Line plots showing H3K27ac signal over time in RPMI-exposed (gray) and BCG Denmark–exposed (blue) monocytes (line, median; shaded area, 25th and 75th quartile). Two distinct sets of peaks are identified: those that peak at day 1 (170 peaks) and those that peak at day 6 (379 peaks). (F) Enriched heatmaps of BCG-Mf day 6 increased H3K27ac peaks and the corresponding H3K4me1 signal at the same peaks. Both H3K27ac and H3K4me1 show elevated levels compared to RPMI-exposed cells. Heatmaps show the center of the peak ± 5 kb.
Fig. 4.
Fig. 4.. Transcriptional response to LPS reexposure in BCG-trained macrophages.
(A) TRIM model, including data collection at 4-hour LPS reexposure at day 6. (B) Venn diagram showing overlap of genes induced by LPS restimulation at day 6 in Naïve-Mf and BCG-Mf. (C) The total macrophage transcriptional response (1242 genes) to LPS was ranked based on the induction of genes in BCG-Mfs (mean of Denmark-Mf and Bulgaria-Mf), relative to Naïve-Mfs, revealing a gradient in BCG-Mf response to LPS reexposure from trained to attenuated. Heatmap shows Naïve-Mf, LPS-Mf, and BCG-Mf at day 6 and after LPS exposure. (D) Gene ontology terms related to attenuated, unaffected, and trained genes, showing enrichment of IFN and viral responses on the unaffected and trained genes. (E) Motif enrichment analysis was performed on promoter regions using a sliding window of 60 genes from trained to attenuated. This analysis shows enrichment of IRF and PRDM1 motifs at trained genes. (F) Box plot showing gene expression over time for 100 attenuated, 946 unaffected, and 196 trained genes for Naïve-Mfs (gray), BCG Denmark-Mf (blue), BCG Bulgaria-Mf (green), and LPS-Mf (red). P values between genes in Naïve-Mf Restim group compared to other exposures within the attenuated gene set (LPS-Mf, P = 9.02 × 10– 5; Denmark-Mf, P = 5.86 × 10⁻⁸; Bulgaria-Mf, P = 1.56 × 10⁻¹⁵), within the equal gene set (LPS-Mf, P = 0.068; Denmark-Mf, P = 1; Bulgaria-Mf, P = 1), and within the trained group (LPS-Mf, P = 0.27; Denmark-Mf, P = 6.6 × 10–42; Bulgaria-Mf, P = 3.37 × 10–61).
Fig. 5.
Fig. 5.. IFNγ is required for BCG-induced TRIM in vitro.
(A) In vitro model to test the effect of IL-18BP and anti-IFNAR1 antibody (Ab) on BCG-induced TRIM. Monocytes were exposed to BCG Denmark (5 μg/ml) for 24 hours (blue line), while the anti-IFNAR1 antibody (10 μg/ml, purple line) and IL-18BP (10 μg/ml, orange line) were in the culture medium for the entire 6 days. At day 6, macrophages were exposed to LPS and cytokine release was measured 24 hours later (day 7). Dot plots show that the cytokine release in picograms per milliliter for (B) TNF and (C) IL-6 at day 7 is elevated in BCG-Mf, with the anti-IFNAR1 antibody having no effect. IL-18BP, on the other hand, completely blocks the LPS response. (D) In vitro model of BCG and inhibitor costimulation for 24 hours only, followed by media for 5 days, before LPS restimulation. (E and F) TNF and IL-6 production is attenuated by 24-hour IL-18BP exposure. *P < 0.05 and **P < 0.01.
Fig. 6.
Fig. 6.. EWAS identifies BCG-associated DNA methylation signature in circulating monocytes 14 months after vaccination.
(A) MIS BAIR clinical trial and experimental setup. Blood was collected from infants in the BCG-vaccinated group (n = 63) or non–BCG-vaccinated group (n = 67) on average 14 months after neonatal randomization (range, 12 to 24 months). Monocytes were sorted from peripheral blood mononuclear cells, and DNA methylation was quantified. A total of 2837 DMPs were identified. (B) PCA plot of the top 1000 DMPs shows a clear separation between the BCG-vaccinated (red) and non–BCG-vaccinated (black) groups on PC1. (C) Box plot and dot plot of DNA methylation for individual nonvaccinated and BCG-vaccinated samples at two probes with the lowest P value and highest contribution to PC1 in (B). (D) Gene ontology analysis was performed on 538 genes that had a promoter DMP. Gene-based (KEGG, BP, and MF) ontology analysis was performed with HOMER and showed agreement with CpG-based ontology analysis (GOmeth tool). Top genes were involved in IFN and viral responses. (E) Motif scanning identified distinct enrichment at promoter and distal DMPs. ETS family motifs were enriched at both promoter and distal hypomethylated DMPs, while ATF3 was enriched at distal hypermethylated DMPs.
Fig. 7.
Fig. 7.. DMRs associated with BCG vaccination.
(A) Strategy for identifying DMRs or clusters of DMPs. (B) Summary of the size (x axis) and number of probes (y axis) for each DMR, colored by mean change in DNA methylation between non–BCG-vaccinated and BCG-vaccinated groups. (C) Pie chart showing the genomic context of DMRs around CpG islands. Compared to all EPIC probes, probes within DMRs are enriched for islands and shores and depleted for open-sea regions, suggesting enrichment at regulatory regions near gene promoters. (D) DMR at the IFN-inducible promoter of the ADAR1 gene. (E) Two DMRs occur at either side of a CpG island, with higher methylation in the BCG-vaccinated group (red line) compared to nonvaccinated group (black line). (F) Top probes in the DMR shown as box plot in control and BCG-vaccinated groups.
Fig. 8.
Fig. 8.. Genes with IFN-associated DMRs show altered expression in human monocytes exposed to BCG in vitro and in mouse HSCs.
(A) Bar plot showing mean DNA methylation change between non–BCG-vaccinated and BCG-vaccinated groups for five DMRs associated with IFN type I response: ADAR, MX1, IFI27, IFITM1, and IRF7. (B) Dot plot showing gene expression of the five genes at day 6 in adult macrophages. All five genes are more highly expressed in BCG-Mf (Denmark-Mf in blue, Bulgaria-Mf in green) compared to Naïve-Mf (gray). (C) Expression of the five genes is altered in mouse HSCs, 4 weeks after intravenous (iv) BCG. Red dots: log2 fold change in BCG HSCs relative to naïve HSC.
Fig. 9.
Fig. 9.. BCG induces A-to-I modification of RNA in human macrophages.
(A) ADAR catalyzes the A-to-I modification at Alu repeats in RNA. (B) In vitro BCG TRIM model, showing that day 6 RNA-seq data were used to quantify A-to-I editing, read as a change from an A to a G at noncommon SNPs. (C) Box plot showing Alu editing rates per donor (A1 to A5) for Naïve RPMI–exposed (N), LPS-exposed (L), BCG Denmark–exposed (D), and BCG Bulgaria–exposed (B) macrophages. (D) A significant increase in A-to-I editing level is observed in BCG-Mf. (E) A-to-I editing sites were mapped to specific gene sets. Box plot shows editing proportions in a background gene set (gray), in vitro BCG-induced genes (yellow), and genes near a DMP (coral) or DMR (brown) in the MIS BAIR EWAS. In vitro induced genes and those with a DMP in vivo are particularly edited in BCG-Mf. (F) Violin plots showing proportion of A-to-I (A>G) at example genes that belong to the in vitro induced gene set (first row) or the in vivo DMP-associated genes (second row). Alu editing rate is shown in Naïve-Mf (red), LPS-Mf (green), Denmark-Mf (blue), and Bulgaria-Mf (purple). Conditions with significant change in editing compared to Naïve-Mf are displayed with a white background and an asterisk. The average number of edited sites detected per donor is displayed below each plot.

References

    1. Netea M. G., Joosten L. A. B., Latz E., Mills K. H. G., Natoli G., Stunnenberg H. G., O’Neill L. A. J., Xavier R. J., Trained immunity: A program of innate immune memory in health and disease. Science 352, aaf1098 (2016). - PMC - PubMed
    1. Kleinnijenhuis J., Quintin J., Preijers F., Joosten L. A. B., Ifrim D. C., Saeed S., Jacobs C., van Loenhout J., de Jong D., Stunnenberg H. G., Xavier R. J., van der Meer J. W. M., van Crevel R., Netea M. G., Bacille Calmette-Guerin induces NOD2-dependent nonspecific protection from reinfection via epigenetic reprogramming of monocytes. Proc. Natl. Acad. Sci. U.S.A. 109, 17537–17542 (2012). - PMC - PubMed
    1. Quintin J., Saeed S., Martens J. H. A., Giamarellos-Bourboulis E. J., Ifrim D. C., Logie C., Jacobs L., Jansen T., Kullberg B. J., Wijmenga C., Joosten L. A. B., Xavier R. J., van der Meer J. W. M., Stunnenberg H. G., Netea M. G., Candida albicans infection affords protection against reinfection via functional reprogramming of monocytes. Cell Host Microbe 12, 223–232 (2012). - PMC - PubMed
    1. Arts R. J., Novakovic B., Horst R. T., Carvalho A., Bekkering S., Lachmandas E., Rodrigues F., Silvestre R., Cheng S.-C., Wang S.-Y., Habibi E., Gonçalves L. G., Mesquita I., Cunha C., van Laarhoven A., van de Veerdonk F. L., Williams D. L., van der Meer J. W. M., Logie C., O’Neill L. A., Dinarello C. A., Riksen N. P., van Crevel R., Clish C., Notebaart R. A., Joosten L. A. B., Stunnenberg H. G., Xavier R. J., Netea M. G., Glutaminolysis and fumarate accumulation integrate immunometabolic and epigenetic programs in trained immunity. Cell Metab. 24, 807–819 (2016). - PMC - PubMed
    1. Bekkering S., Arts R. J. W., Novakovic B., Kourtzelis I., van der Heijden C. D. C. C., Li Y., Popa C. D., Horst R. T., van Tuijl J., Netea-Maier R. T., van de Veerdonk F. L., Chavakis T., Joosten L. A. B., van der Meer J. W. M., Stunnenberg H., Riksen N. P., Netea M. G., Metabolic induction of trained immunity through the mevalonate pathway. Cell 172, 135–146.e9 (2018). - PubMed