Assessing suspension and infectivity times of virus-loaded aerosols involved in airborne transmission
- PMID: 35930663
- PMCID: PMC9371747
- DOI: 10.1073/pnas.2204593119
Assessing suspension and infectivity times of virus-loaded aerosols involved in airborne transmission
Abstract
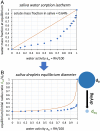
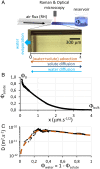
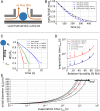
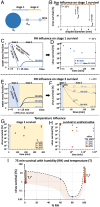
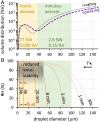
Airborne transmission occurs through droplet-mediated transport of viruses following the expulsion of an aerosol by an infected host. Transmission efficiency results from the interplay between virus survival in the drying droplet and droplet suspension time in the air, controlled by the coupling between water evaporation and droplet sedimentation. Furthermore, droplets are made of a respiratory fluid and thus, display a complex composition consisting of water and nonvolatile solutes. Here, we quantify the impact of this complex composition on the different phenomena underlying transmission. Solutes lead to a nonideal thermodynamic behavior, which sets an equilibrium droplet size that is independent of relative humidity. In contrast, solutes do not significantly hinder transport due to their low initial concentration. Realistic suspension times are computed and increase with increasing relative humidity or decreasing temperature. By uncoupling drying and suspended stages, we observe that enveloped viruses may remain infectious for hours in dried droplets. However, their infectivity decreases with increasing relative humidity or temperature after dozens of minutes. Examining expelled droplet size distributions in the light of these results leads to distinguishing two aerosols. Most droplets measure between 0 and 40 µm and compose an aerosol that remains suspended for hours. Its transmission efficiency is controlled by infectivity, which decreases with increasing humidity and temperature. Larger droplets form an aerosol that only remains suspended for minutes but corresponds to a much larger volume and thus, viral load. Its transmission efficiency is controlled by droplet suspension time, which decreases with increasing humidity and decreasing temperature.
Keywords: aerosol; evaporation; infectivity; saliva; virus.
Conflict of interest statement
The authors declare no competing interest.
Figures


Similar articles
-
Seasonal influenza viruses decay more rapidly at intermediate humidity in droplets containing saliva compared to respiratory mucus.Appl Environ Microbiol. 2024 Feb 21;90(2):e0201023. doi: 10.1128/aem.02010-23. Epub 2024 Jan 9. Appl Environ Microbiol. 2024. PMID: 38193683 Free PMC article.
-
Relative humidity in droplet and airborne transmission of disease.J Biol Phys. 2021 Mar;47(1):1-29. doi: 10.1007/s10867-020-09562-5. Epub 2021 Feb 10. J Biol Phys. 2021. PMID: 33564965 Free PMC article. Review.
-
Stability of influenza A virus in droplets and aerosols is heightened by the presence of commensal respiratory bacteria.J Virol. 2024 Jul 23;98(7):e0040924. doi: 10.1128/jvi.00409-24. Epub 2024 Jun 13. J Virol. 2024. PMID: 38869284 Free PMC article.
-
Transition from saliva droplets to solid aerosols in the context of COVID-19 spreading.Environ Res. 2022 Mar;204(Pt B):112072. doi: 10.1016/j.envres.2021.112072. Epub 2021 Sep 23. Environ Res. 2022. PMID: 34562485 Free PMC article.
-
Mechanisms controlling the transport and evaporation of human exhaled respiratory droplets containing the severe acute respiratory syndrome coronavirus: a review.Environ Chem Lett. 2023;21(3):1701-1727. doi: 10.1007/s10311-023-01579-1. Epub 2023 Feb 22. Environ Chem Lett. 2023. PMID: 36846189 Free PMC article. Review.
Cited by
-
Large-scale flow field and aerosol particle transport investigations in a classroom using 2D-Shake-The-Box Lagrangian Particle Tracking.Heliyon. 2023 Nov 27;9(12):e22826. doi: 10.1016/j.heliyon.2023.e22826. eCollection 2023 Dec. Heliyon. 2023. PMID: 38076092 Free PMC article.
-
Airborne SARS-CoV-2 Detection by ddPCR in Adequately Ventilated Hospital Corridors.Toxics. 2025 Jul 12;13(7):583. doi: 10.3390/toxics13070583. Toxics. 2025. PMID: 40711028 Free PMC article.
-
Highly efficient microbial inactivation enabled by tunneling charges injected through two-dimensional electronics.Sci Adv. 2024 May 3;10(18):eadl5067. doi: 10.1126/sciadv.adl5067. Epub 2024 May 3. Sci Adv. 2024. PMID: 38701201 Free PMC article.
-
Risk assessment for long- and short-range airborne transmission of SARS-CoV-2, indoors and outdoors.PNAS Nexus. 2022 Oct 6;1(5):pgac223. doi: 10.1093/pnasnexus/pgac223. eCollection 2022 Nov. PNAS Nexus. 2022. PMID: 36712338 Free PMC article.
-
The effect of activity and face masks on exhaled particles in children.Pediatr Investig. 2023 May 3;7(2):75-85. doi: 10.1002/ped4.12376. eCollection 2023 Jun. Pediatr Investig. 2023. PMID: 37324601 Free PMC article.
References
-
- Poon W. C. K., et al. ., Soft matter science and the COVID-19 pandemic. Soft Matter 16, 8310–8324 (2020). - PubMed
-
- Chong K. L., et al. ., Extended lifetime of respiratory droplets in a turbulent vapor puff and its implications on airborne disease transmission. Phys. Rev. Lett. 126, 034502 (2021). - PubMed
Publication types
MeSH terms
Substances
LinkOut - more resources
Full Text Sources
Other Literature Sources
Medical

