

Live-Cell RNA Imaging with Metabolically Incorporated Fluorescent Nucleosides
- PMID: 35930766
- PMCID: PMC9940818
- DOI: 10.1021/jacs.2c04142
Live-Cell RNA Imaging with Metabolically Incorporated Fluorescent Nucleosides
Abstract
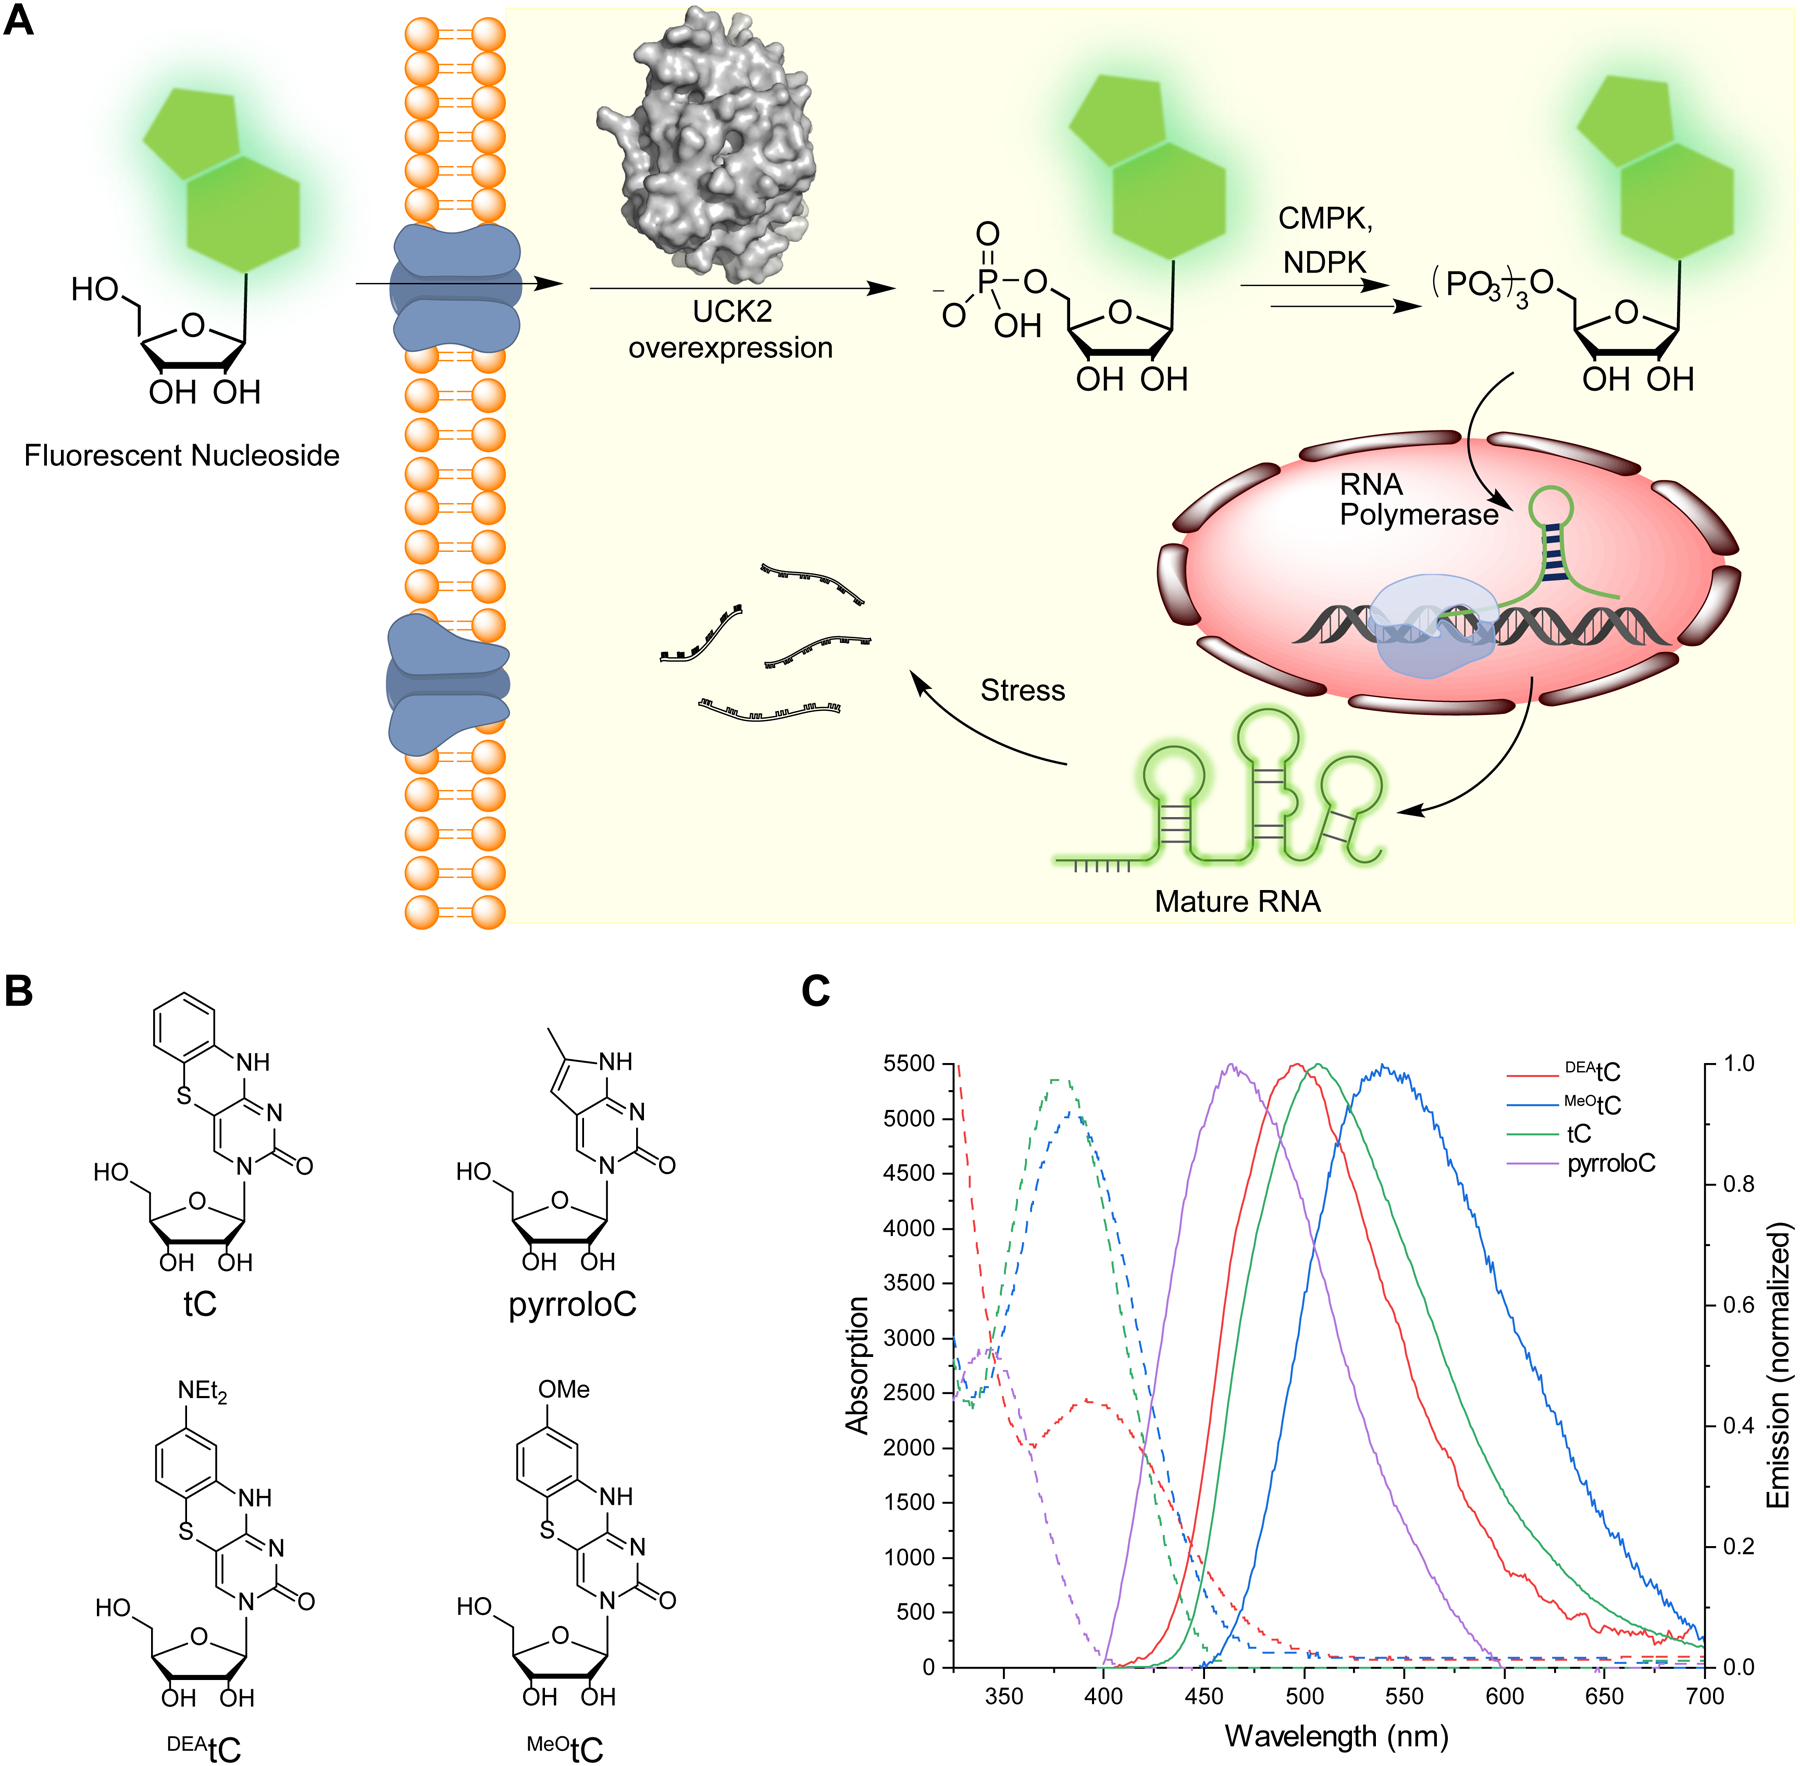
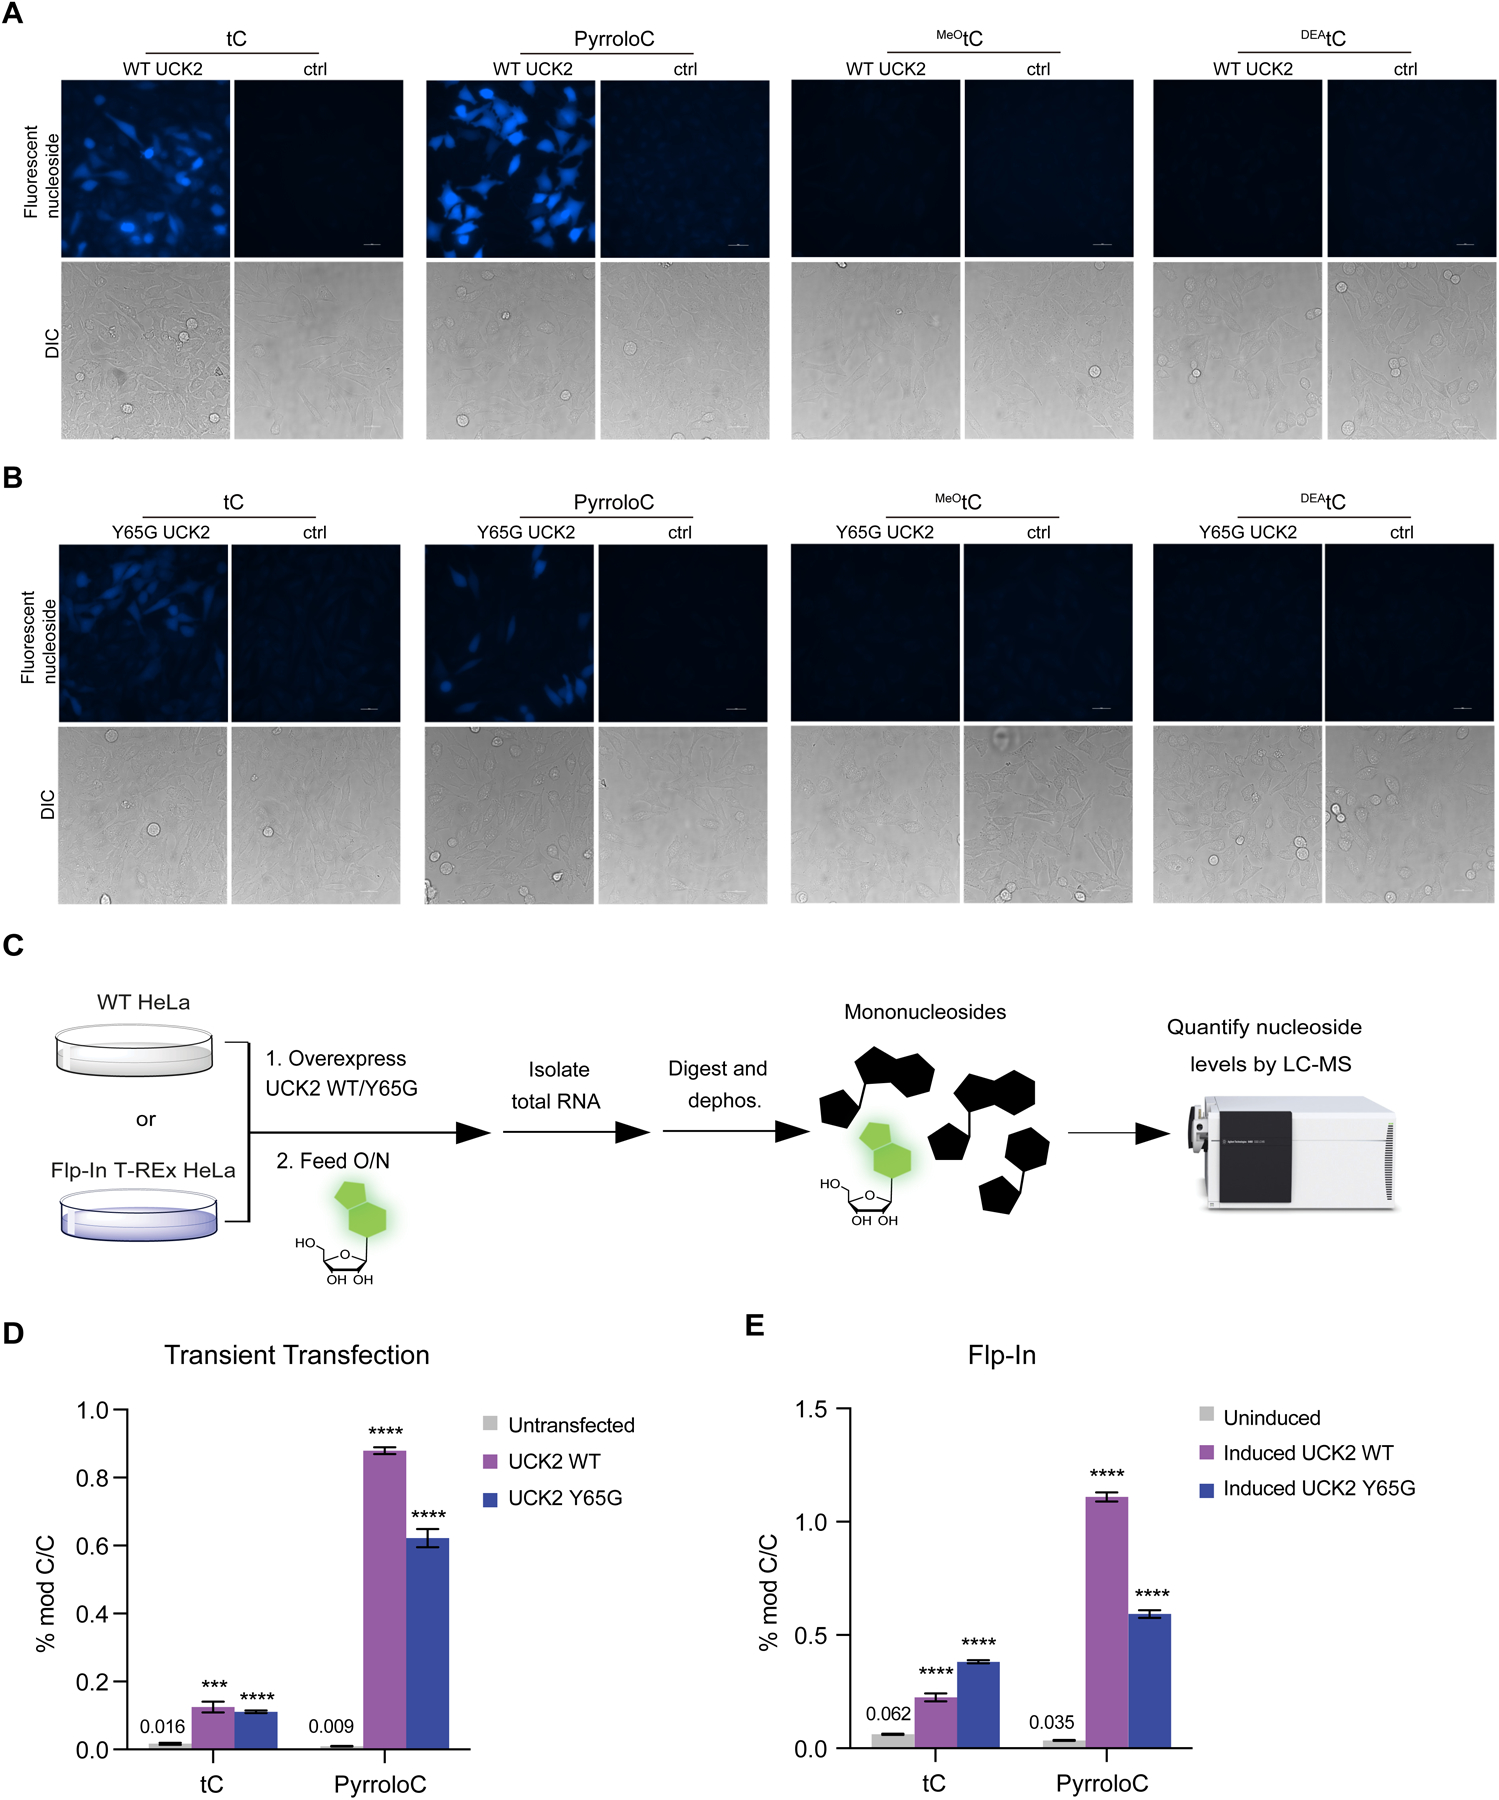
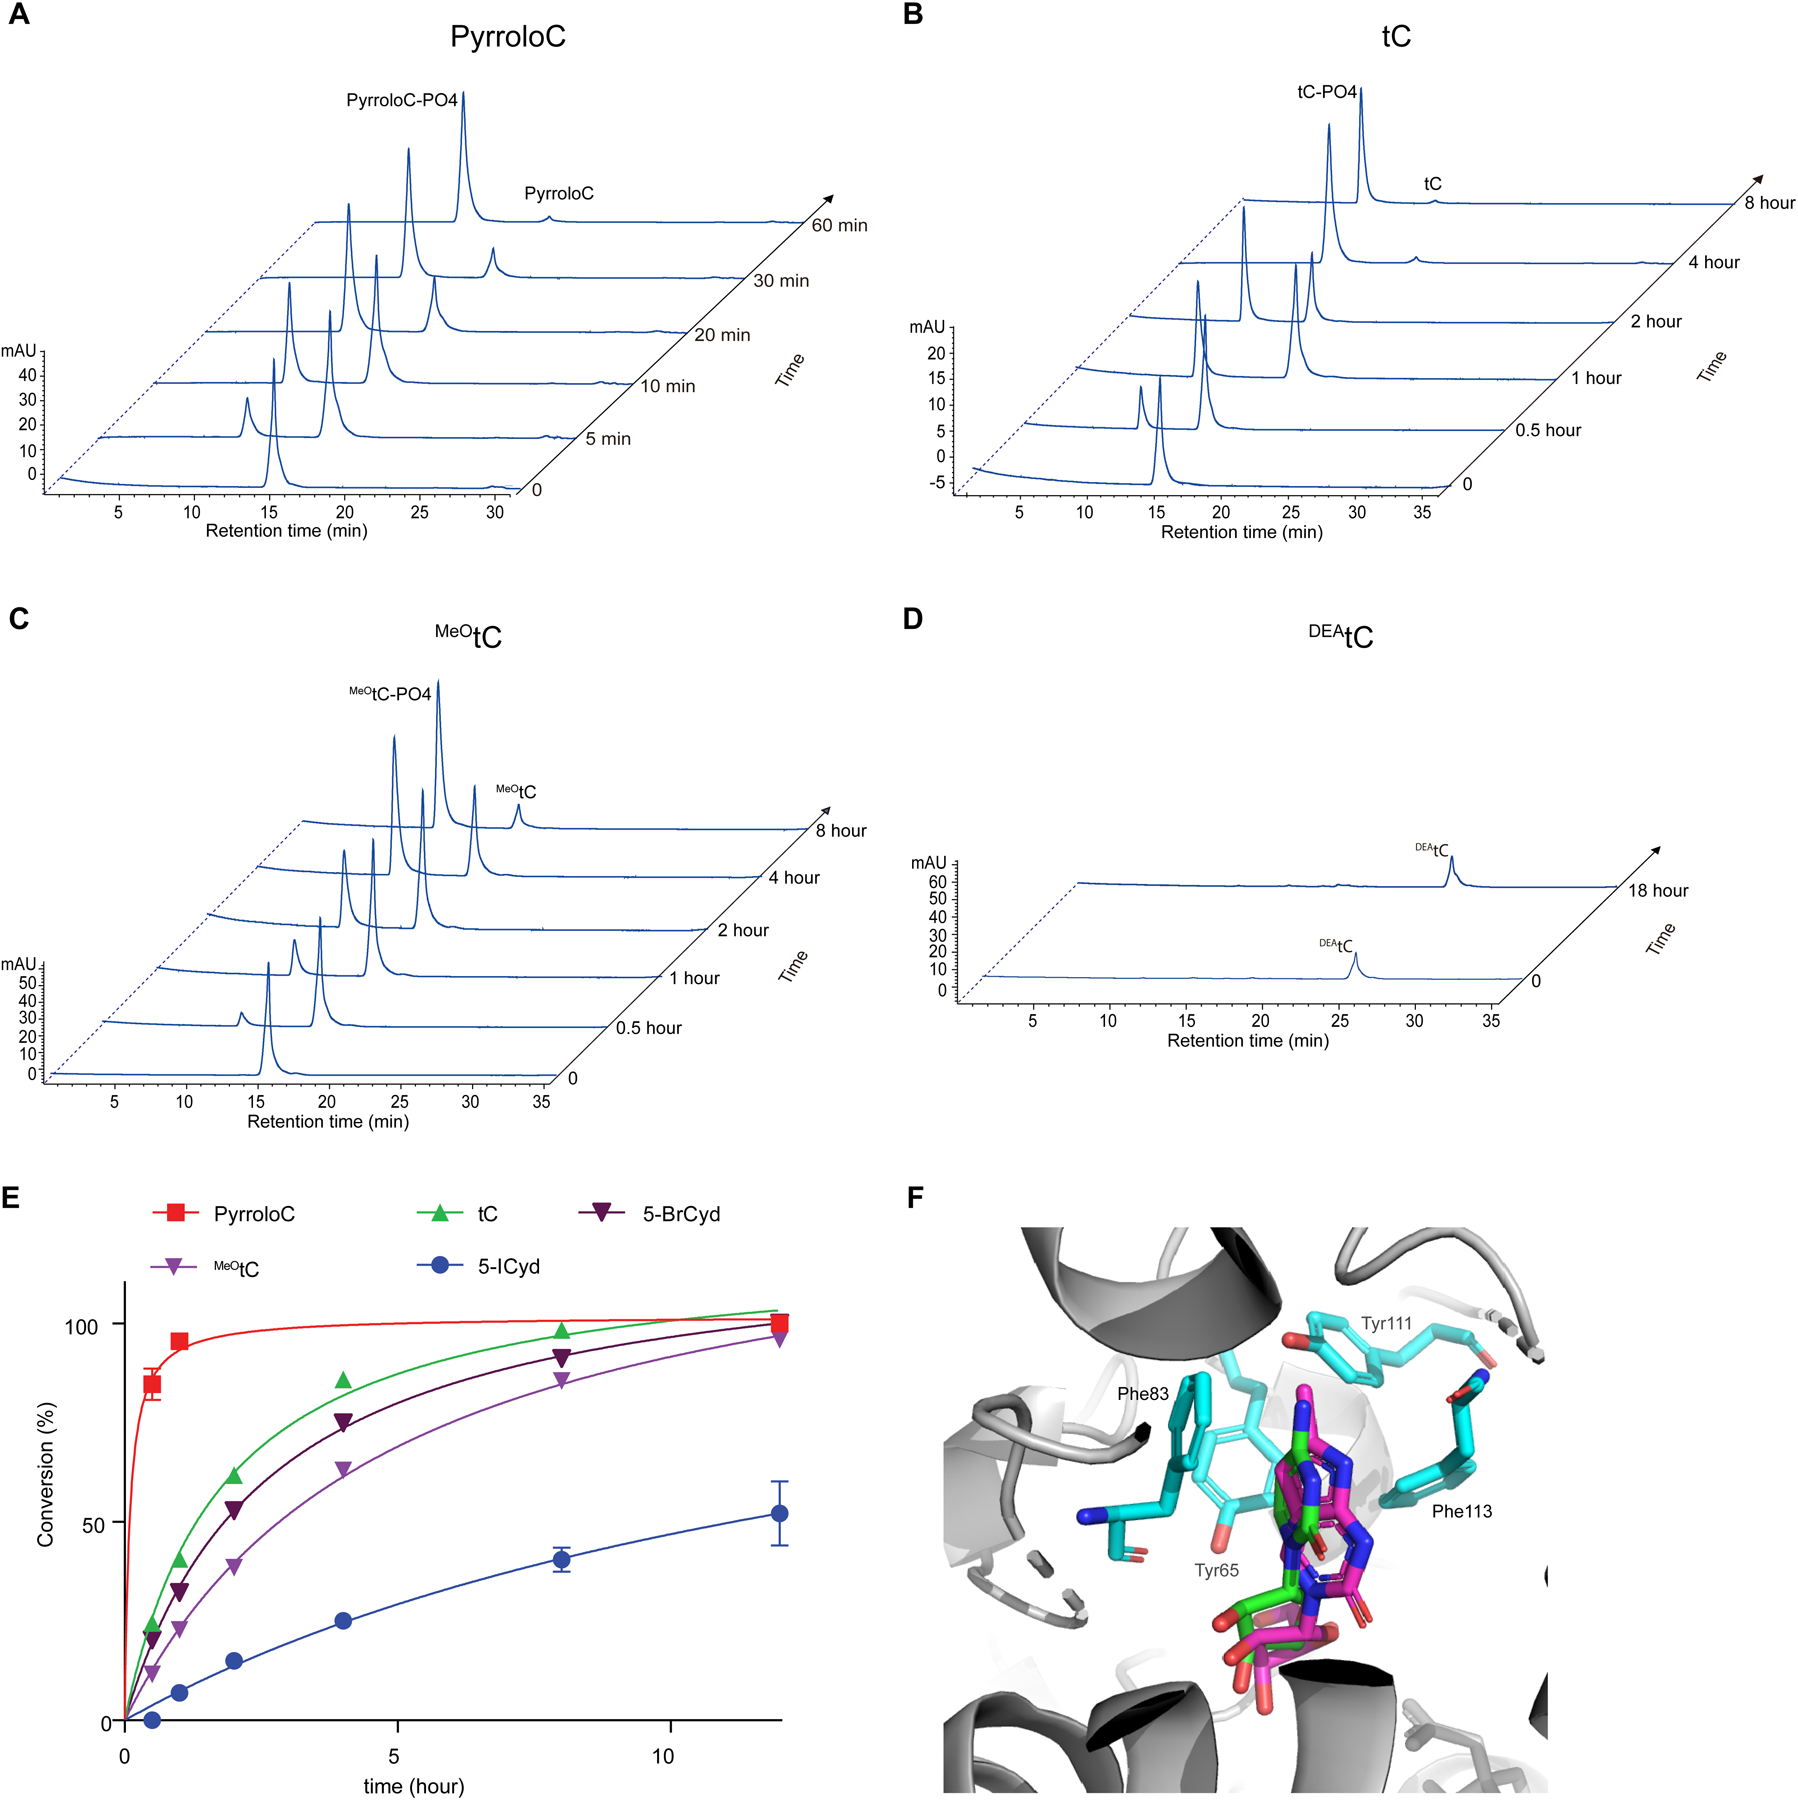
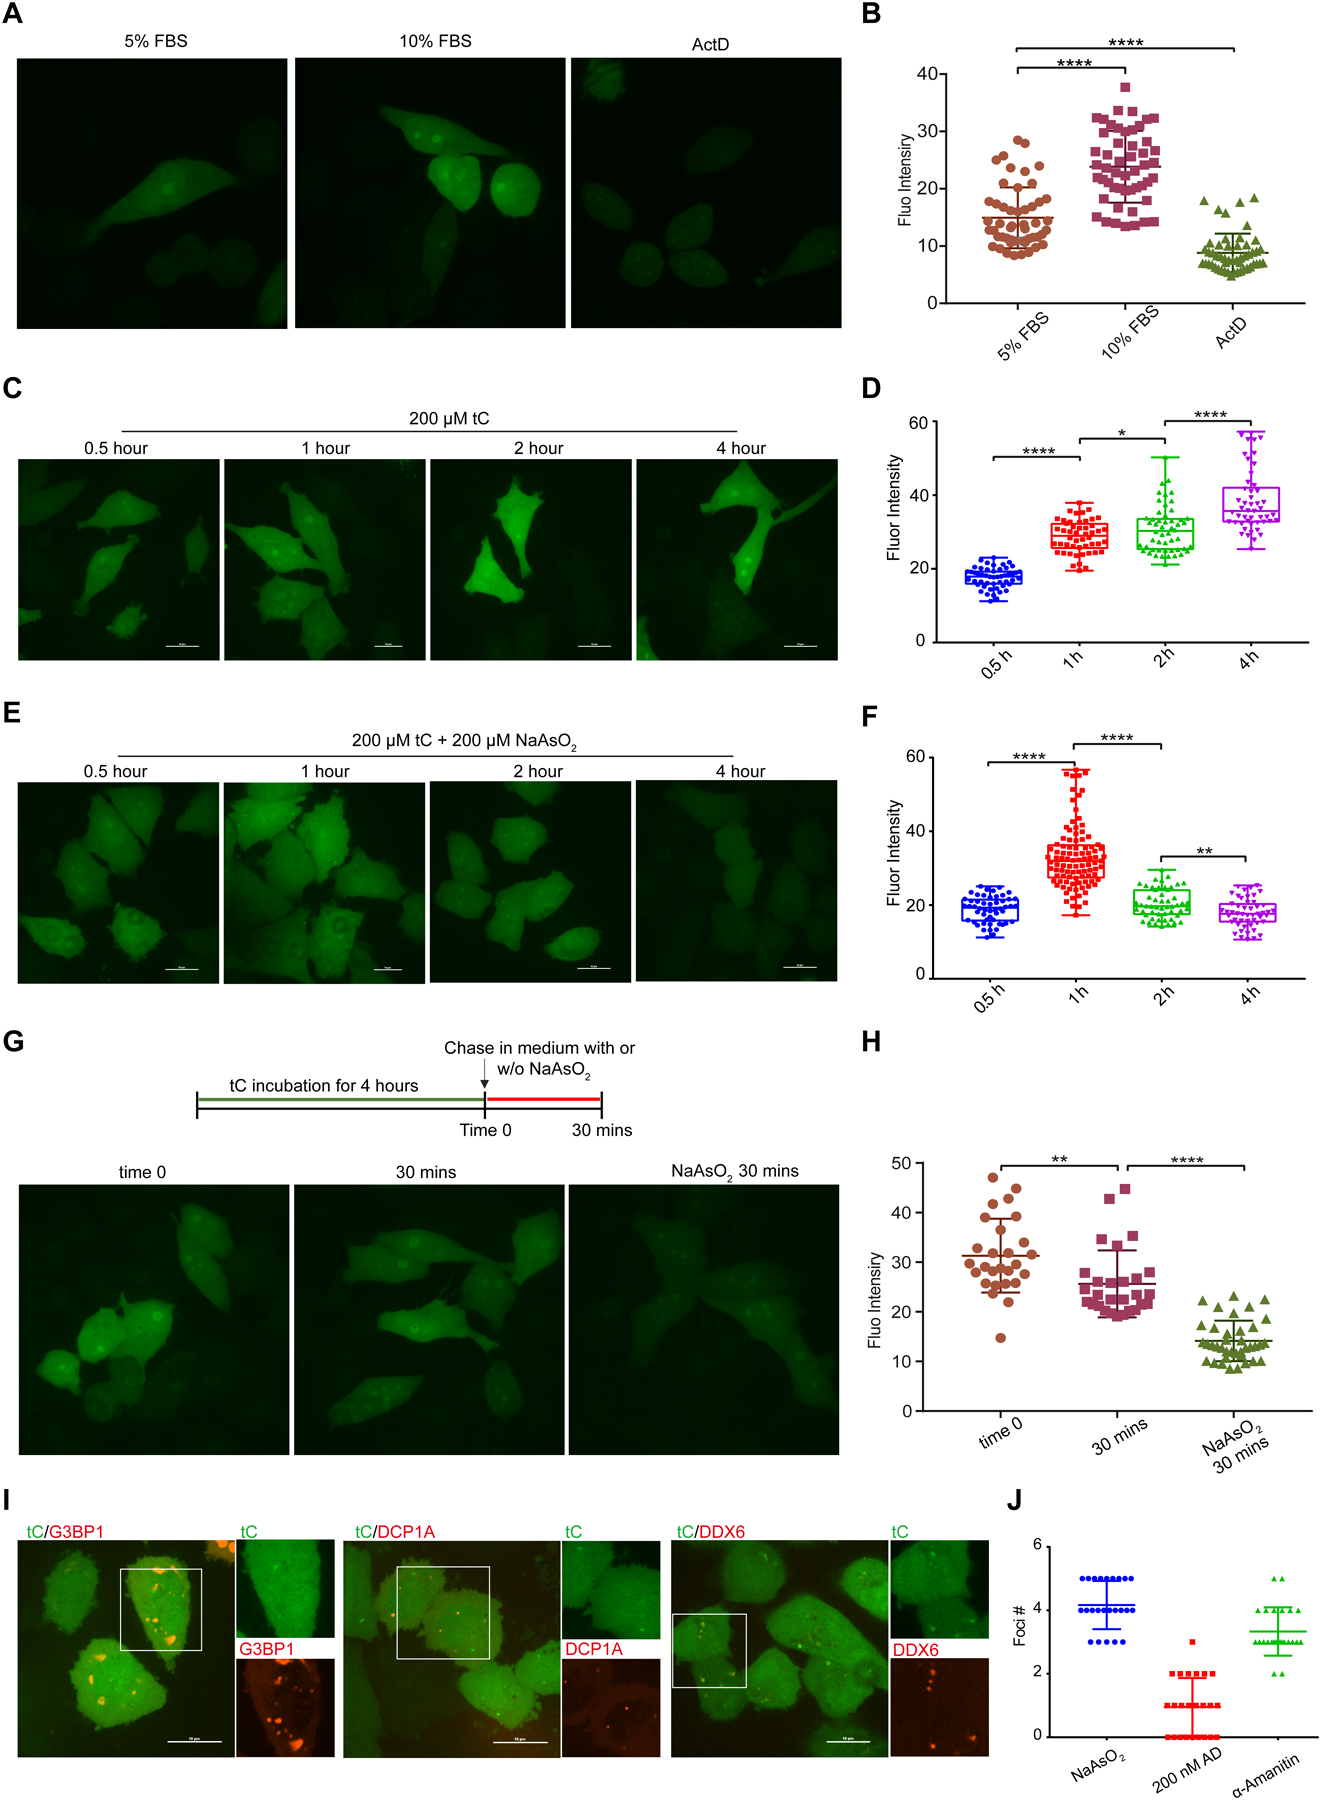
Fluorescence imaging is a powerful method for probing macromolecular dynamics in biological systems; however, approaches for cellular RNA imaging are limited to the investigation of individual RNA constructs or bulk RNA labeling methods compatible primarily with fixed samples. Here, we develop a platform for fluorescence imaging of bulk RNA dynamics in living cells. We show that fluorescent bicyclic and tricyclic cytidine analogues can be metabolically incorporated into cellular RNA by overexpression of uridine-cytidine kinase 2. In particular, metabolic feeding with the tricyclic cytidine-derived nucleoside tC combined with confocal imaging enables the investigation of RNA synthesis, degradation, and trafficking at single-cell resolution. We apply our imaging modality to study RNA metabolism and localization during the oxidative stress response and find that bulk RNA turnover is greatly accelerated upon NaAsO2 treatment. Furthermore, we identify cytoplasmic RNA granules containing RNA transcripts generated during oxidative stress that are distinct from canonical stress granules and P-bodies and co-localize with the RNA helicase DDX6. Taken together, our work provides a powerful approach for live-cell RNA imaging and reveals how cells reshape RNA transcriptome dynamics in response to oxidative stress.
Conflict of interest statement
COMPETING INTEREST STATEMENT
The authors declare no competing financial interests.
Figures
Similar articles
-
Cell- and Polymerase-Selective Metabolic Labeling of Cellular RNA with 2'-Azidocytidine.J Am Chem Soc. 2020 Aug 26;142(34):14417-14421. doi: 10.1021/jacs.0c04566. Epub 2020 Aug 14. J Am Chem Soc. 2020. PMID: 32786764 Free PMC article.
-
A Metabolic Engineering Approach to Incorporate Modified Pyrimidine Nucleosides into Cellular RNA.J Am Chem Soc. 2019 Feb 27;141(8):3347-3351. doi: 10.1021/jacs.8b11449. Epub 2019 Feb 13. J Am Chem Soc. 2019. PMID: 30735369
-
Probing Nascent RNA with Metabolic Incorporation of Modified Nucleosides.Acc Chem Res. 2022 Sep 20;55(18):2647-2659. doi: 10.1021/acs.accounts.2c00347. Epub 2022 Sep 8. Acc Chem Res. 2022. PMID: 36073807
-
Nucleotide pools in Novikoff rat hepatoma cells growing in suspension culture. 3. Effects of nucleosides in medium on levels of nucleotides in separate nucleotide pools for nuclear and cytoplasmic RNA synthesis.J Cell Biol. 1972 Jan;52(1):131-46. doi: 10.1083/jcb.52.1.131. J Cell Biol. 1972. PMID: 4331295 Free PMC article.
-
Application of nucleoside or nucleotide analogues in RNA dynamics and RNA-binding protein analysis.Wiley Interdiscip Rev RNA. 2022 Nov;13(6):e1722. doi: 10.1002/wrna.1722. Epub 2022 Feb 25. Wiley Interdiscip Rev RNA. 2022. PMID: 35218164 Review.
Cited by
-
Transcriptomic forecasting with neural ordinary differential equations.Patterns (N Y). 2023 Jul 6;4(8):100793. doi: 10.1016/j.patter.2023.100793. eCollection 2023 Aug 11. Patterns (N Y). 2023. PMID: 37602211 Free PMC article.
-
Chemical Approaches To Investigate Post-transcriptional RNA Regulation.ACS Chem Biol. 2023 Aug 18;18(8):1684-1697. doi: 10.1021/acschembio.3c00406. Epub 2023 Aug 4. ACS Chem Biol. 2023. PMID: 37540831 Free PMC article. Review.
-
Metabolism of epigenetic ribonucleosides leads to nucleolar stress and cytotoxicity.bioRxiv [Preprint]. 2025 Jun 13:2025.06.11.659152. doi: 10.1101/2025.06.11.659152. bioRxiv. 2025. PMID: 40661430 Free PMC article. Preprint.
-
Interaction of Tri-Cyclic Nucleobase Analogs with Enzymes of Purine Metabolism: Xanthine Oxidase and Purine Nucleoside Phosphorylase.Int J Mol Sci. 2024 Sep 27;25(19):10426. doi: 10.3390/ijms251910426. Int J Mol Sci. 2024. PMID: 39408755 Free PMC article.
-
Emissive Guanosine Analog Applicable for Real-Time Live Cell Imaging.ACS Chem Biol. 2024 Aug 16;19(8):1836-1841. doi: 10.1021/acschembio.4c00398. Epub 2024 Aug 5. ACS Chem Biol. 2024. PMID: 39101365 Free PMC article.
References
Publication types
MeSH terms
Substances
Grants and funding
LinkOut - more resources
Full Text Sources
Other Literature Sources
