. 2022 Oct 4;82(19):3435-3448.
doi: 10.1158/0008-5472.CAN-22-0325.

An Immunogenic Model of KRAS-Mutant Lung Cancer Enables Evaluation of Targeted Therapy and Immunotherapy Combinations

Affiliations

An Immunogenic Model of KRAS-Mutant Lung Cancer Enables Evaluation of Targeted Therapy and Immunotherapy Combinations

Jesse Boumelha et al. Cancer Res. .

Abstract

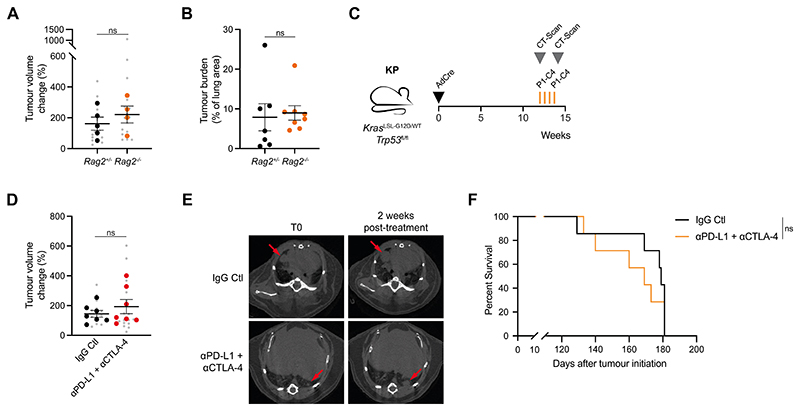
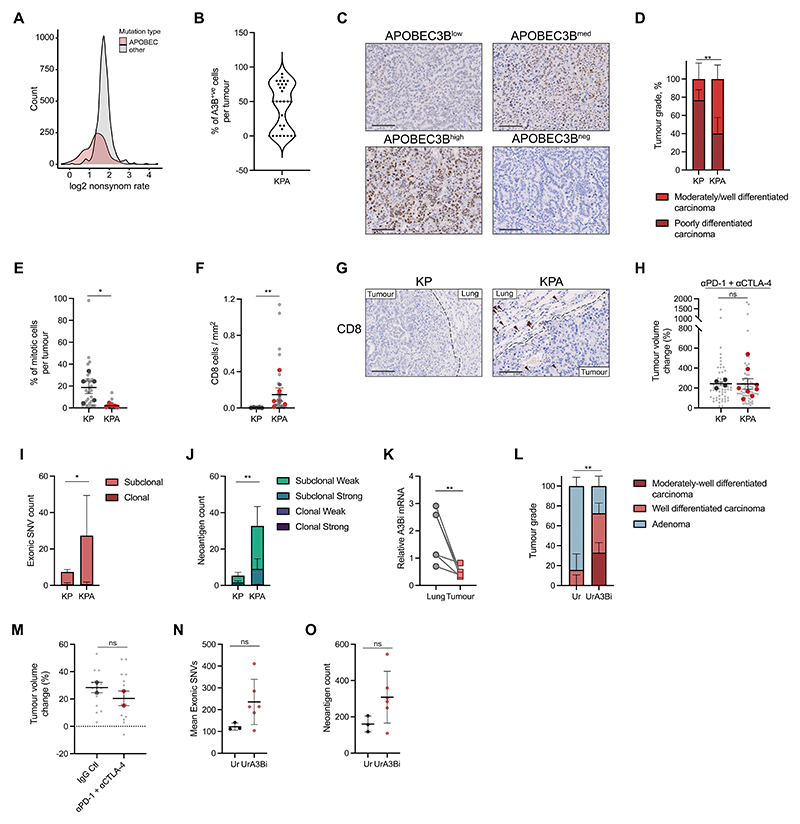
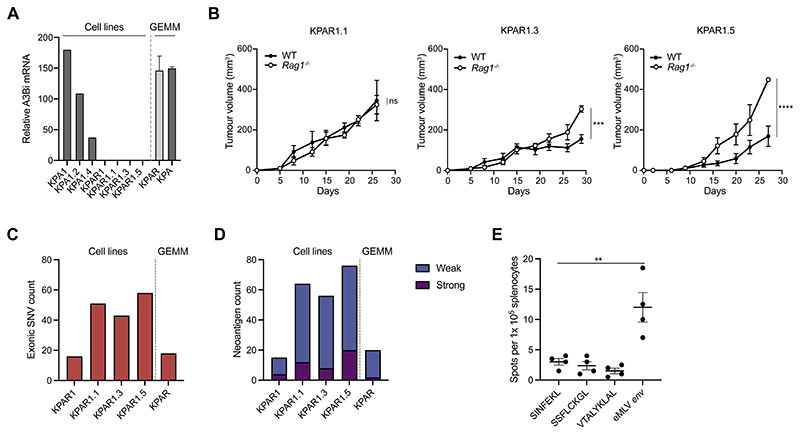
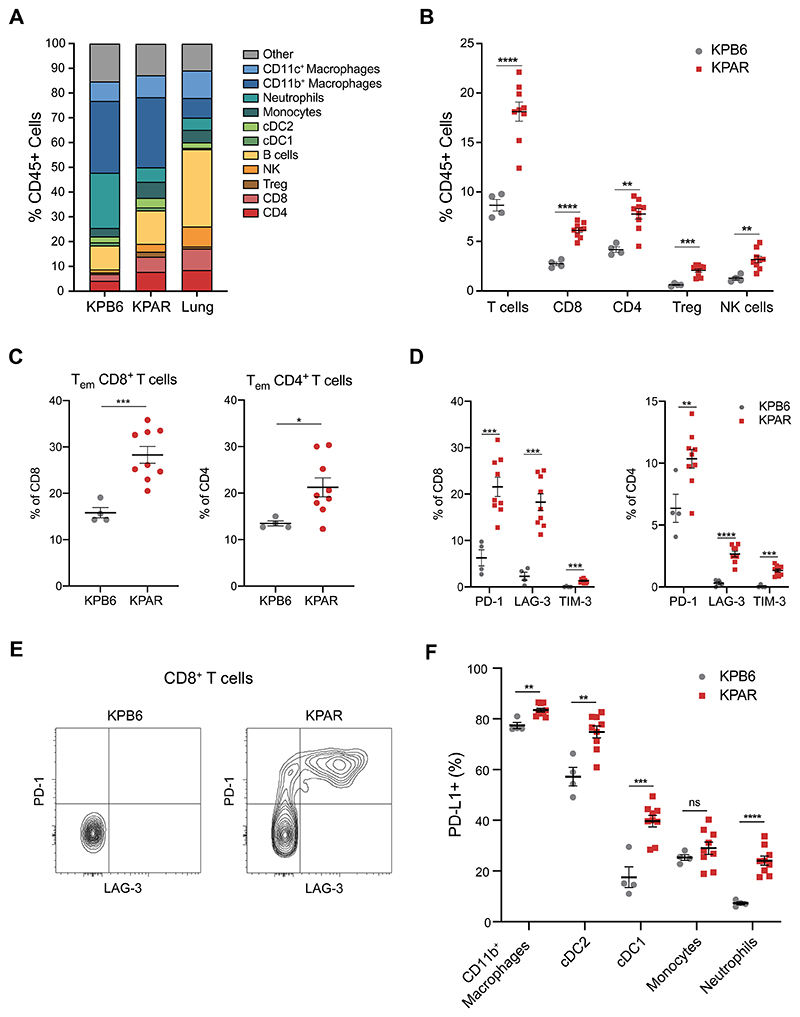
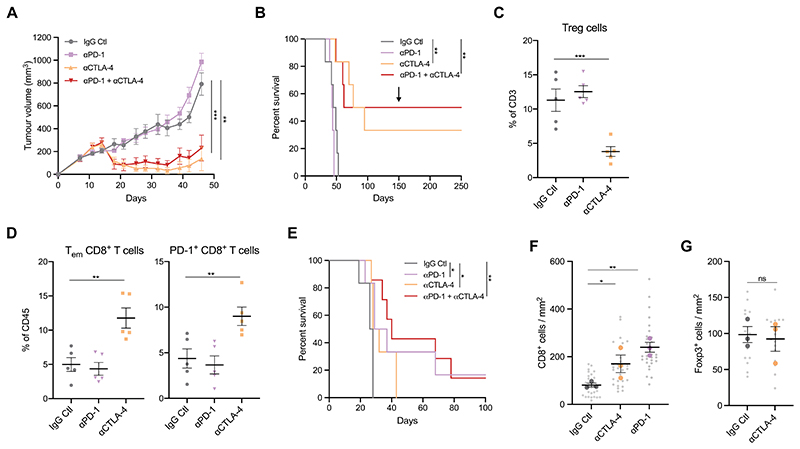
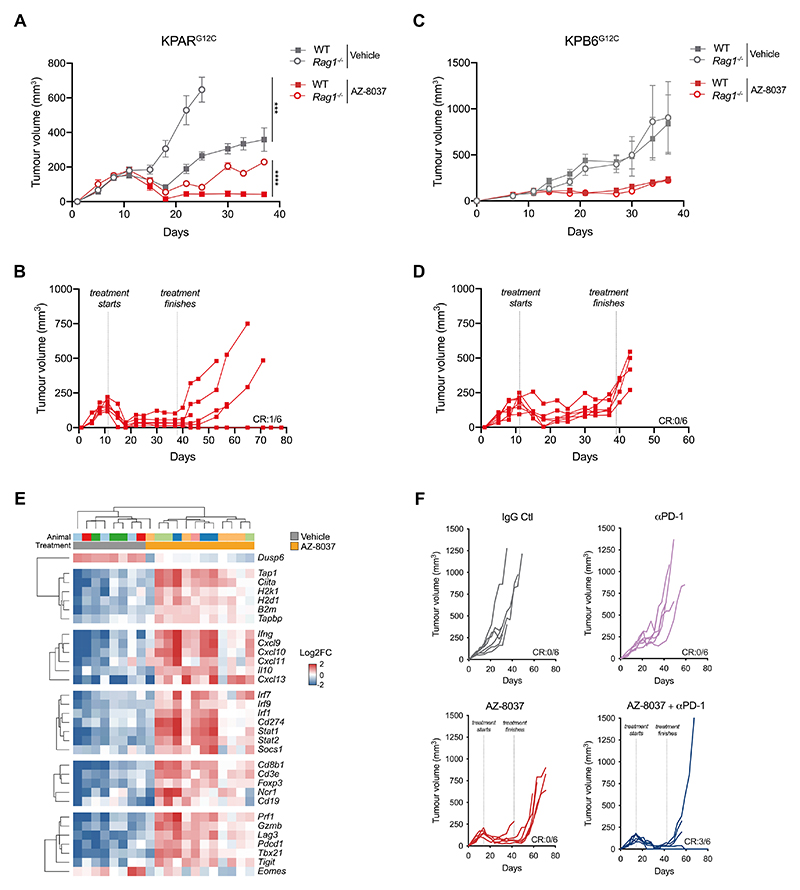
Mutations in oncogenes such as KRAS and EGFR cause a high proportion of lung cancers. Drugs targeting these proteins cause tumor regression but ultimately fail to elicit cures. As a result, there is an intense interest in how to best combine targeted therapies with other treatments, such as immunotherapies. However, preclinical systems for studying the interaction of lung tumors with the host immune system are inadequate, in part due to the low tumor mutational burden in genetically engineered mouse models. Here we set out to develop mouse models of mutant KRAS-driven lung cancer with an elevated tumor mutational burden by expressing the human DNA cytosine deaminase, APOBEC3B, to mimic the mutational signature seen in human lung cancer. This failed to substantially increase clonal tumor mutational burden and autochthonous tumors remained refractory to immunotherapy. However, establishing clonal cell lines from these tumors enabled the generation of an immunogenic syngeneic transplantation model of KRAS-mutant lung adenocarcinoma that was sensitive to immunotherapy. Unexpectedly, antitumor immune responses were not directed against neoantigens but instead targeted derepressed endogenous retroviral antigens. The ability of KRASG12C inhibitors to cause regression of KRASG12C -expressing tumors was markedly potentiated by the adaptive immune system, highlighting the importance of using immunocompetent models for evaluating targeted therapies. Overall, this model provides a unique opportunity for the study of combinations of targeted and immunotherapies in immune-hot lung cancer.

Significance: This study develops a mouse model of immunogenic KRAS-mutant lung cancer to facilitate the investigation of optimal combinations of targeted therapies with immunotherapies.


Conflict of interest statement

Competing interests: J.D. has acted as a consultant for AstraZeneca, Bayer, Jubilant, Theras, Vividion and Novartis. S.R. is an employee of AstraZeneca. C.S. receives grant support from Archer Dx, AstraZeneca, Boehringer–Ingelheim and Ono Pharmaceutical; has consulted for AstraZeneca, Bicycle Therapeutics, Celgene, Genentech, GRAIL, GSK, Illumina, Medicxi, MSD, Novartis and the Sarah Cannon Research Institute; receives grant support and has consulted for Bristol Myers Squibb, Pfizer and Roche–Ventana; is an advisory board member and is involved in trials sponsored by AstraZeneca; has stock options in Epic Sciences, GRAIL; and has stock options and is a co-founder of Achilles Therapeutics. The other authors declare that they have no potential conflicts of interest.

Figures

Figure 1
Figure 1. The KP mouse model of lung adenocarcinoma is not immunogenic
(A) Tumour volume change over two weeks in KP;Rag2+/- (n=5) and KP;Rag2-/- mice (n=4). Data are mean per mouse (large symbols) ± SEM, small symbols represent individual tumours. Mann-Whitney test of mean per mouse; ns P>0.05. (B) Tumour burden quantified using H&E sections from KP;Rag2+/- (n=7) and KP;Rag2-/- mice (n=8) 15 weeks after tumour initiation. Data are mean ± SEM. Unpaired, two-tailed Student’s t-test; ns P>0.05. (C) Schematic of KP tumour induction and treatment schedule. Cre-expressing adenovirus was delivered intratracheally and mice were regularly scanned by micro-CT. 12 weeks after tumour initiation, tumour-bearing mice were treated three times (d0, d4 and d8) intraperitoneally with 10mg/kg anti-PD-L1 and 5mg/kg anti-CTLA-4 or corresponding isotype control (IgG Ctl). Tumour growth and survival were monitored until the experimental endpoints. (D) Tumour volume change in KP-tumour-bearing mice treated as in (C) Mice were scanned 2 weeks after the pre-treatment scan, IgG Ctl (n=7) and anti-PD-L1 + anti-CTLA-4 (n=7). Data are mean per mouse (large symbols) ± SEM, small symbols represent individual tumours. Mann-Whitney test of mean per mouse; ns P>0.05. (E) Representative micro-CT scans of mice treated as in (C). Red arrows indicate tumours. (F) Kaplan-Meier survival analysis of KP-tumour-bearing mouse survival treated as in (C). Log-rank (Mantel-Cox) test; ns P>0.05
Figure 2
Figure 2. APOBEC3B expression induces subclonal mutations but does not render autochthonous tumours immunogenic
(A) Distribution of log2 non-synonymous/synonymous mutation ratio of APOBEC mutations or other types of mutation in LUAD (TCGA). (B) Distribution of A3Bi positive cells per lung tumour in the KPA model estimated by immunohistochemistry. (C) Immunohistochemistry of APOBEC3B staining in four KPA tumours showing different levels of APOBEC3B expression. Scale bar represents 100μm. (D) Tumour grade proportion in the KP and KPA models. Percentage per model, upper and lower limit, Chi-square test p-value, n=5 mice per group; ** P≤0.01. (E) Percentage of mitotic cells in KP and KPA tumours estimated by histopathology. Light grey dots represent individual tumours. Mean per group (large symbols), ±SEM, n=5 mice per group. One-way ANOVA of mean per group, FDR 0.05; * P≤0.05. (F) Quantification of immunohistochemistry staining for CD8 in KP and KPA tumours. Light grey dots represent individual tumours. Mean per group (large symbols), ±SEM, n=5 mice per group. One-way ANOVA of mean per group, FDR 0.05; ** P≤0.01. (G) Immunohistochemistry of CD8 in lung tumours from KP and KPA models. Scale bar represents 100μm. (H) Tumour volume change in KP- and KPA-tumour-bearing mice treated four times (d0, d3, d7 and d10) with 200μg of anti-PD-1 and 200μg of anti-CTLA-4. Mice were scanned 2 weeks after the pre-treatment scan, KP (n=4) and KPA (n=7). Data are mean (large symbols) ± SEM, small symbols represent individual tumours. Mann-Whitney test; ns P>0.05. (I-J) Mean exonic SNV count ±SD (I) and neoantigen count ±SD (J) in KP (n=5 tumours) and KPA (n=3 tumours) broken down into clonal and subclonal. Unpaired, two-tailed Student’s t-test performed on mean of all SNVs or neoantigen count; * P≤0.05, ** P≤0.01. Peptides with a rank threshold of <2 or <0.5 were designated as weak or strong MHC-I binders, respectively. (K) Expression of A3Bi by qPCR in paired normal-adjacent tissue and tumour of UrA3Bi (n=7 tumours from 4 mice, squares), each symbol represents one tumour or adjacent tissue. Relative expression is normalised on the mean expression of Sdha, Tbp and Actb. Two-tailed paired t-test; ** P≤0.01 (L) Proportion of tumour grades evaluated from H&E staining of tumour-bearing lungs in Ur (n=8 mice) and UrA3Bi (n=8 mice) mice. Chi-square test; ** P≤0.01. (M) Tumour volume change in UrA3Bi mice treated as in (H) (n=2 mice) or corresponding isotype control (n=2 mice). Mice were scanned 2 weeks after the pre-treatment scan. Data are mean per mouse (large symbols) ± SEM, small symbols represent individual tumours. Mann-Whitney test; ns P>0.05. (N-O) Mean total exonic SNV count ±SD (M) and neoantigen count ±SD (N) in Ur (n=3 tumours) and UrA3B (n=6 tumours). Unpaired t-test, two-tailed performed on mean of all SNVs or neoantigen count; ns P>0.05
Figure 3
Figure 3. Generation of a novel immunogenic cell line KPAR1.3
(A) mRNA expression by qPCR of A3Bi in KPA and KPAR autochthonous tumours, parental cells and sub-clones. Relative expression is normalised to the mean expression of Sdha, Tbp and Hsp90ab1. (B) Growth of KPAR cells transplanted subcutaneously into syngeneic immune-competent and Rag1-/- mice. Data are mean tumour volumes ± SEM, n=5 mice per group (KPAR1.3 and KPAR1.5) and n=4 mice per group (KPAR1.1). Two-way ANOVA; ns P>0.05, *** P≤0.001 (C) Frequency of exonic mutations in an autochthonous KPAR tumour, the KPAR parental cell line and the KPAR1.1, KPAR1.3 and KPAR1.5 single-cell clones, estimated par whole-exome sequencing. (D) Frequency of predicted neoantigens identified using NetMHC4.0. Peptides with a rank threshold of <2 or <0.5 were designated as weak or strong MHC-I binders, respectively. (E) IFNγ ELISPOT analysis of splenocytes isolated from KPAR1.3 tumour-bearing mice and pulsed with predicted strong neoantigens (SSFLCKGL and VTALYKLAL) or eMLV env peptide (KSPWFTTL). SINFEKL was used as a negative control. Data are mean ± SEM, n=4 mice per group. One-way ANOVA; ** P≤0.01
Figure 4
Figure 4. KPAR orthotopic tumours generate an adaptive immune response
(A) Immune profile of KPAR and KPB6 orthotopic tumours compared to normal lung, assessed by flow cytometry. (B) Frequency of tumour-infiltrating T cell populations and NK cells. (C) Percentage of effector memory CD8+ (left) and CD4+ (right) T cells. (D) Quantification of PD-1, LAG-3 and TIM-3 expression on CD8+ (left) and CD4+ (right) T cells. (E) Representative plot of PD-1 and LAG-3 expression on CD8+ T cells. (F) Frequency of PDL1+ macrophages, cDC1, cDC2, monocytes and neutrophils. Tumours were analysed 21 days after transplantation. In (B)-(D) and (F), data are mean ± SEM, n=4 mice (KPB6) or 9 mice (KPAR), symbols represent pooled tumours from individual mice. Unpaired, two-tailed Student’s t-test; ns P>0.05, * P≤0.05, ** P≤0.01, *** P≤0.001, **** P≤0.0001.
Figure 5
Figure 5. Subcutaneous and orthotopic KPAR tumours are responsive to immune checkpoint blockade
(A) Growth of KPAR subcutaneous tumours from mice treated intraperitoneally with 200μg anti-PD-1 and/or 200μg anti-CTLA-4 or corresponding isotype control (IgG Ctl) on day 10, 14, 17 and 21. Data are mean tumour volumes ± SEM, n=6 mice per group. Two-way ANOVA; ** P≤0.01, *** P≤0.001. (B) Kaplan-Meier survival of mice from (A). The black arrow indicates the time at which mice that previously rejected the primary tumour were re-challenged on the opposite flank. Log-rank (Mantel-Cox) test; ** P≤0.01. (C-D) Flow cytometry analysis of the frequency of Foxp3+ Tregs (C), effector memory CD8+ T cells (D, left) and PD-1+ CD8+ T cells (D, right) in subcutaneous tumours after treatment as in (A). Treatment was on day 10, 14 and 17 and mice were culled on day 18. Data are mean ± SEM, n=5 mice per group. One-way ANOVA; ** P≤0.01, *** P≤0.001. (E) Kaplan-Meier survival of mice treated with anti-PD-1 and/or anti-CTLA-4 after orthotopic transplantation of KPAR cells. Treatment was initiated once tumours were detectable by micro-CT and were administered twice weekly for a maximum of 3 weeks. n=6 mice (IgG Ctl, anti-PD1, anti-CTLA-4) or n=7 mice (anti-PD-1 + anti-CTLA-4). Log-rank (Mantel-Cox) test; * P≤0.05, ** P≤0.01. (F-G) Quantification of immunohistochemistry staining for CD8 (F) and Foxp3 (G) in orthotopic KPAR lung tumours after treatment as in (E). Data are mean (large symbols) ± SEM, n=3 mice per group, small symbols represent individual tumours. One-way ANOVA; ns P>0.05, * P≤0.05, ** P≤0.01.
Figure 6
Figure 6. The efficacy of KRASG12C inhibition in vivo is greater in immune-competent mice
(A-B) Mean ± SEM (A) and individual (B) KPARG12C tumour volumes in immune-competent and Rag1-/- mice treated with vehicle or AZ-8037 (100mg/kg daily oral gavage). CR, complete regression. n=6 mice per group. Two-way ANOVA; *** P≤0.001, **** P≤0.0001. (C-D) Mean ± SEM (C) and individual (D) KPB6G12C tumour volumes in immune-competent and Rag1-/- mice treated as in (A). CR, complete regression. n=6 mice per group. (E) Heatmap showing mRNA expression from qPCR of KPARG12C tumours treated for 7 days with AZ-8037 or vehicle. Gene expression is scaled across all tumours. Only genes with a significant mean difference between AZ-8037 and vehicle groups (one-way ANOVA) are shown. (F) Individual subcutaneous KPARG12C tumour volumes in mice treated with AZ-8037 and/or 200μg anti-PD-1 or corresponding isotype control. AZ-8037 was administered daily for 4 weeks from day 14 and anti-PD-1 was administered on day 15, 18, 22 and 25. CR, complete regression. n=6 mice per group.

References

    1. Bray F, Ferlay J, Soerjomataram I, Siegel RL, Torre LA, Jemal A. Global cancer statistics 2018: GLOBOCAN estimates of incidence and mortality worldwide for 36 cancers in 185 countries. CA Cancer J Clin. 2018;68:394–424. - PubMed
    1. Siegel RL, Miller KD, Jemal A. Cancer statistics, 2020. CA Cancer J Clin. 2020;70:7–30. - PubMed
    1. Collisson EA, Campbell JD, Brooks AN, Berger AH, Lee W, Chmielecki J, et al. Nature. Vol. 511. Nature Publishing Group; 2014. Comprehensive molecular profiling of lung adenocarcinoma; pp. 543–50. - DOI - PMC - PubMed
    1. Blumenschein GR, Smit EF, Planchard D, Kim DW, Cadranel J, De Pas T, et al. A randomized phase II study of the MEK1/MEK2 inhibitor trametinib (GSK1120212) compared with docetaxel in KRAS-mutant advanced non-small-cell lung cancer (NSCLC) Ann Oncol. 2015;26:894–901. doi: 10.1093/annonc/mdv072. - DOI - PMC - PubMed
    1. Borghaei H, Paz-Ares L, Horn L, Spigel DR, Steins M, Ready NE, et al. Nivolumab versus docetaxel in advanced nonsquamous non-small-cell lung cancer. N Engl J Med. 2015;373:1627–39. doi: 10.1056/NEJMoa1507643. - DOI - PMC - PubMed

Publication types

LinkOut - more resources