. 2022 Aug 4;29(8):1181-1196.e6.
doi: 10.1016/j.stem.2022.06.014.

EZH1 repression generates mature iPSC-derived CAR T cells with enhanced antitumor activity

Affiliations

EZH1 repression generates mature iPSC-derived CAR T cells with enhanced antitumor activity

Ran Jing et al. Cell Stem Cell. .

Erratum in

Abstract

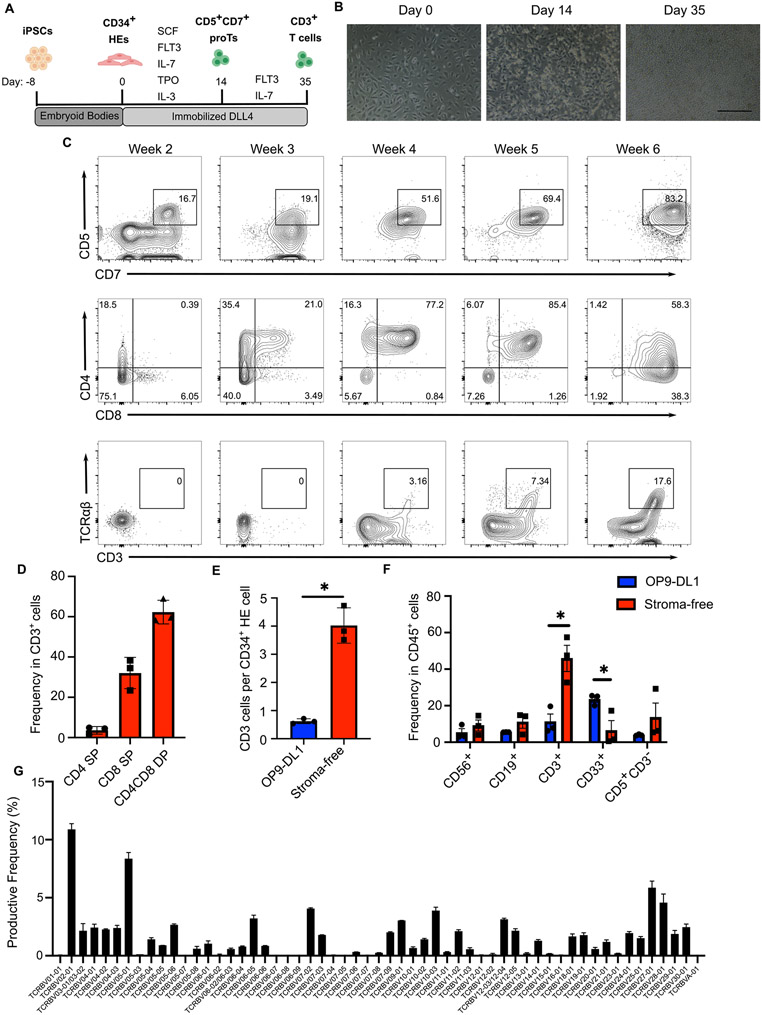
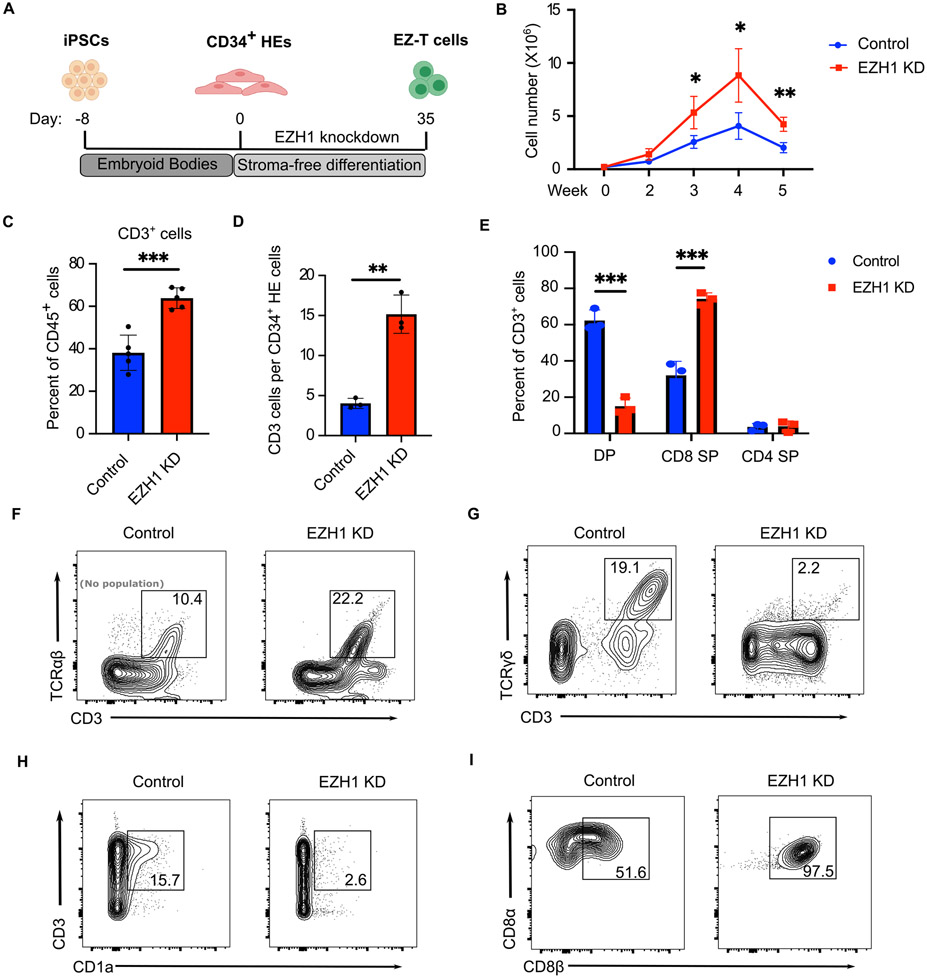
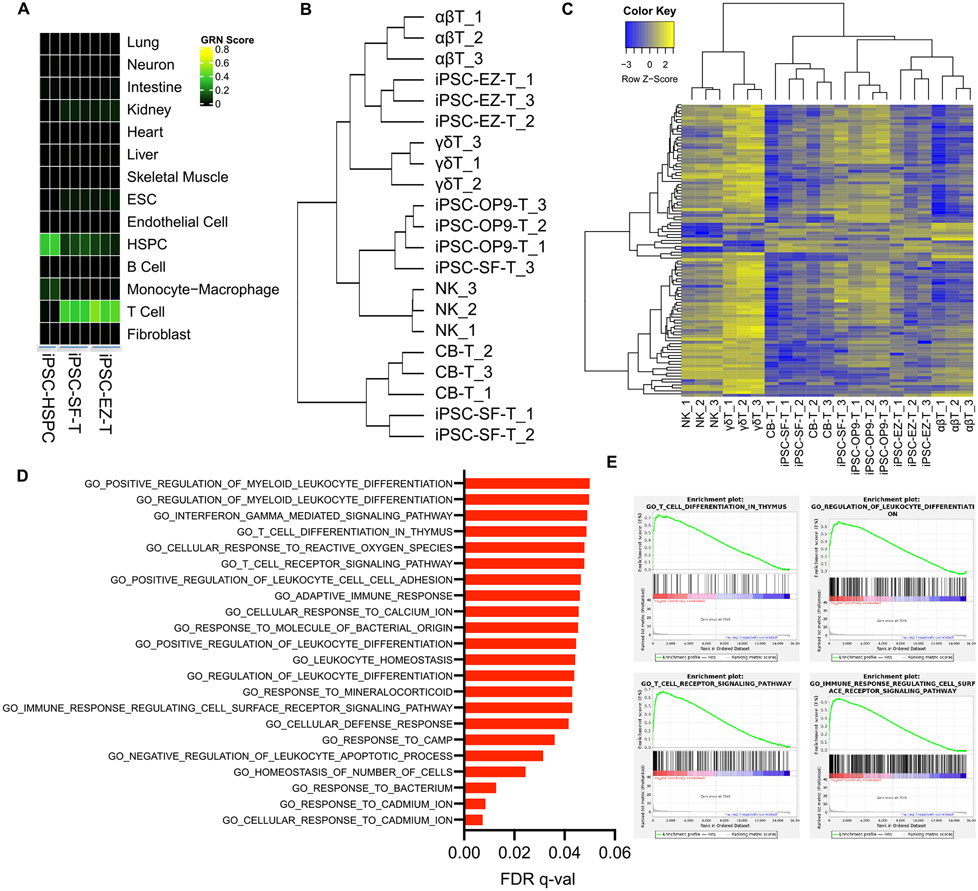
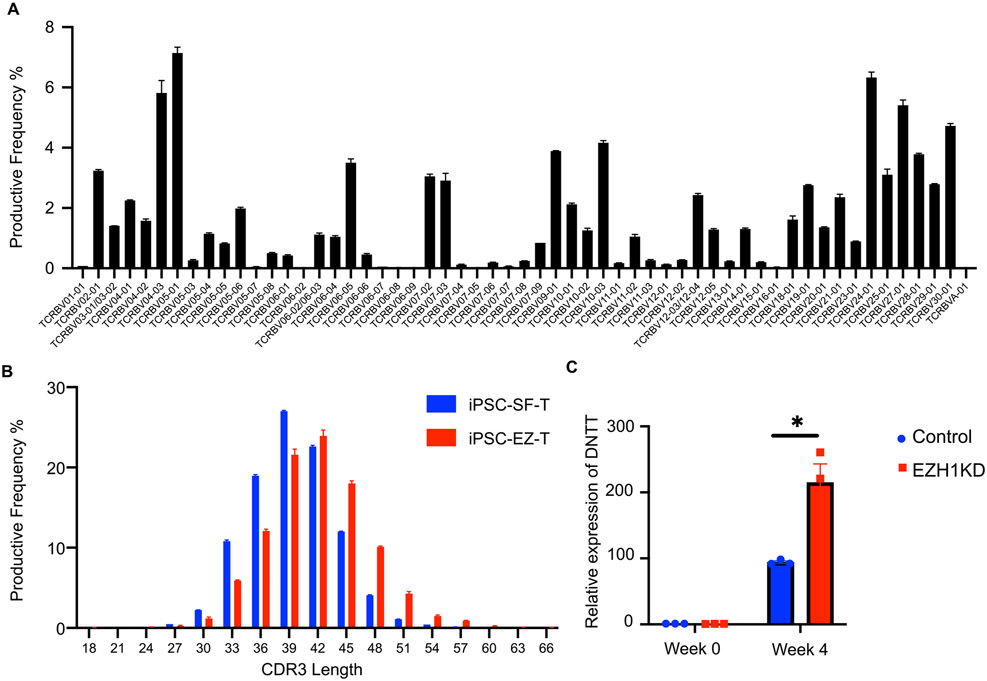
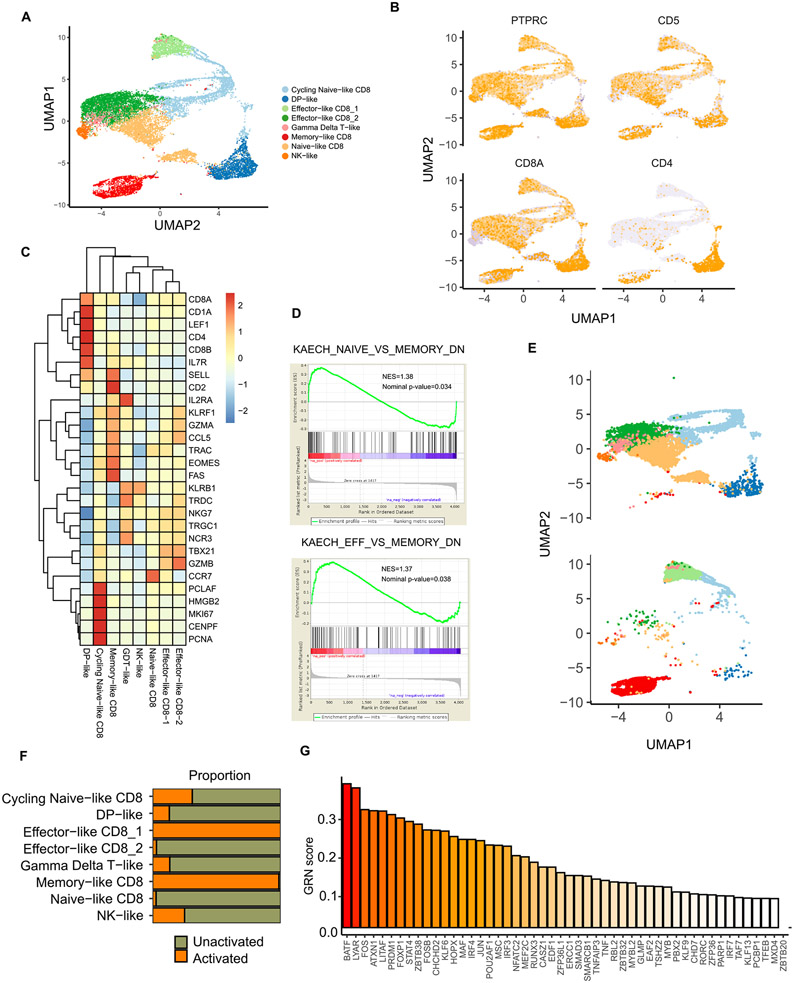
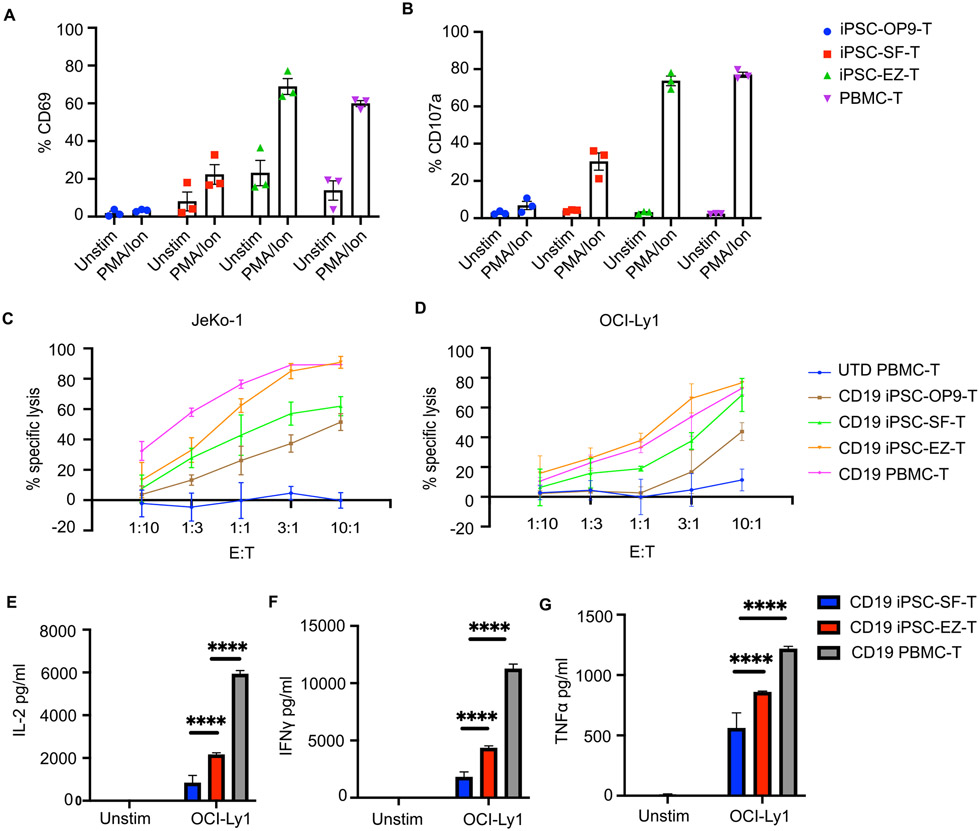
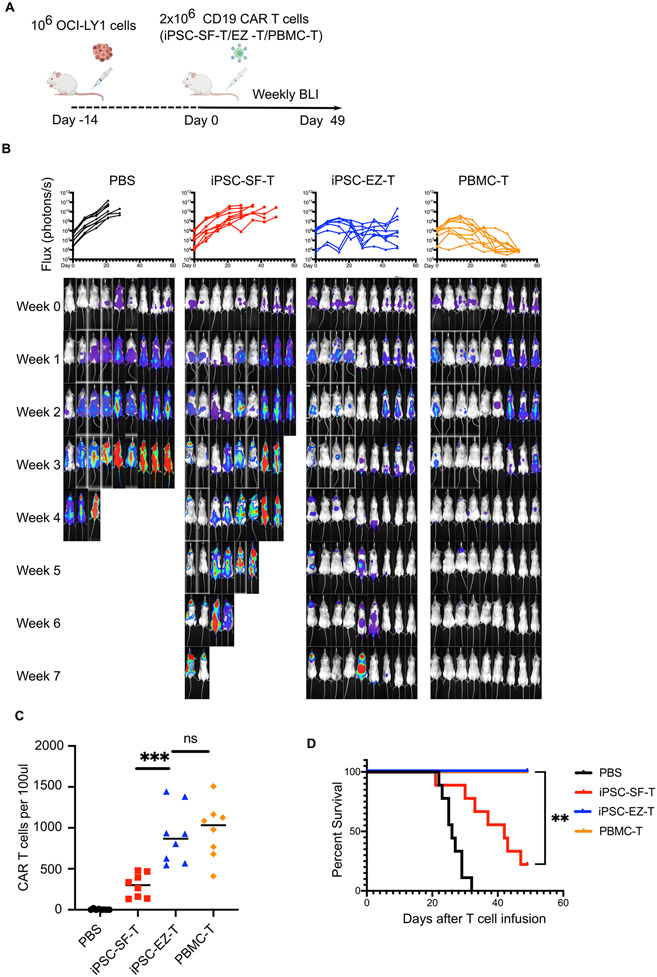
Human induced pluripotent stem cells (iPSCs) provide a potentially unlimited resource for cell therapies, but the derivation of mature cell types remains challenging. The histone methyltransferase EZH1 is a negative regulator of lymphoid potential during embryonic hematopoiesis. Here, we demonstrate that EZH1 repression facilitates in vitro differentiation and maturation of T cells from iPSCs. Coupling a stroma-free T cell differentiation system with EZH1-knockdown-mediated epigenetic reprogramming, we generated iPSC-derived T cells, termed EZ-T cells, which display a highly diverse T cell receptor (TCR) repertoire and mature molecular signatures similar to those of TCRαβ T cells from peripheral blood. Upon activation, EZ-T cells give rise to effector and memory T cell subsets. When transduced with chimeric antigen receptors (CARs), EZ-T cells exhibit potent antitumor activities in vitro and in xenograft models. Epigenetic remodeling via EZH1 repression allows efficient production of developmentally mature T cells from iPSCs for applications in adoptive cell therapy.

Keywords: CAR T cells; EZH1; T cell differentiation; cancer immunotherapy; hematopoietic stem and progenitor cells; pluripotent stem cells.


Conflict of interest statement

Declaration of interests R.J., G.Q.D., and Boston Children’s Hospital hold intellectual property and receive consulting fees and/or hold equity interest relevant to the generation of iPSC-derived T cells. T.M.S. receives sponsored research support from Elevate Bio. G.Q.D. is a member of Cell Stem Cell’s advisory board.

Figures

Fig. 1.
Fig. 1.. Stroma-free differentiation of human iPSCs into T cells.
A) Schematic illustration of the stroma-free T cell differentiation. B) Representative images showing day 0 CD34+ HE cells, day 14 proT cells, and day 35 T cells. Scale bar: 200μm. C) Expression of T cell lineage-specific markers during the stroma-free T cell differentiation of iPSCs (gated on CD45+ cells). D) Frequencies of CD4, CD8, and DP T cells in CD3+ cells after 6 weeks of differentiation (n=3, mean ± SEM). E) Numbers of week 6 CD3+ T cells generated via OP9-DL1 (blue) or stroma-free (red) differentiation, normalized to numbers of CD34+ HE cells seeded on day 0 (n=3, mean ± SEM, * P≤0.05). F) Frequencies of B cells (CD19+), NK cells (CD56+), Myeloid cells (CD33+), T cell precursors (CD5+CD3), and T cells (CD3+) in CD45+ hematopoietic cells after 6 weeks of T cell differentiation using the OP9-DL1 (blue) or stroma-free (red) method (n=3, mean ± SEM, * P≤0.05, ** P≤0.01). G) Frequencies of Vβ family genes determined by sequencing of the TCRβ CDR3 region (n=2)
Fig. 2.
Fig. 2.. EZH1 knockdown facilitates in vitro T cell differentiation from iPSCs.
A) Schematic illustration of EZ-T cell generation. B) Numbers of live cells during T cell differentiation using control (blue) or EZH1 knockdown (KD) (red) iPSC-derived HE cells (n=3, mean ± SEM, * P≤0.05). C) Frequencies of CD3+ T cells in CD45+ cells generated from control (blue) or EZH1 KD (red) cells after stroma-free T cell differentiation (n=3, mean ± SEM, *** P≤0.001). D) Numbers of CD3+ T cells generated from control (blue) or EZH1 KD (red) cells, normalized to numbers of CD34+ HE cells seeded on day 0 (n=3, mean ± SEM, ** P≤0.01). E) Frequencies of CD4, CD8, and DP T cells generated from control (blue) or EZH1 KD (red) cells after 6 weeks of stroma-free T cell differentiation (n=3, mean ± SEM, *** P≤0.001). F-H) Expression of CD3 and TCRαβ /TCRγδ/CD1a in control and EZH1 KD cells after stroma-free T cell differentiation, gated on CD45+ cells. I) Expression of CD8α and CD8β in control and EZH1 KD cells after stroma-free T cell differentiation, gated on CD8 T cells.
Fig. 3.
Fig. 3.. EZ-T cells display molecular features of mature TCRαβ T cells.
A) Heatmap showing CellNet analysis of RNA-seq data from iPSC-derived CD34+ HSPCs and iPSC-derived T cells generated via stroma-free protocol, either with EZH1 knockdown (iPSC-EZ-T), or without (iPSC-SF-T). B) Dendrogram representing hierarchical cluster analysis based on expression of TCR pathway genes (BIOCARTA_TCR_PATHWAY, M19784) (n=3). C) Heatmap showing unsupervised clustering analysis based on TCRαβ signature genes (n=3). D) Top GO terms of biological process enriched in iPSC-EZ-T cells vs. iPSC-SF-T cells by GSEA analysis (n=3). E) GSEA enrichment plots showing over-representation of gene sets related to T cell development and functions.
Fig. 4.
Fig. 4.. TCR repertoire analysis of EZ-T cells.
A) Frequencies of Vβ family genes in EZ-T cells determined by sequencing of the TCRβ CDR3 region (n=2). B) TCRβ CDR3 length of iPSC-EZ-T cells (red) compared to control iPSC-SF-T cells without EZH1 knockdown (blue) (n=2). C) Relative expression levels of TdT/DNTT in undifferentiated iPSCs or iPSC-SF-T cells with (red) or without (blue) EZH1 KD (n=3, mean ± SEM, * P≤0.05).
Fig. 5.
Fig. 5.. Single cell RNA-seq analysis identifies memory-like T cell subsets in EZ-T cells after activation.
A) Uniform Manifold Approximation and Projection (UMAP) visualization of all the CD45+ cells generated from EZ-T cell differentiation with and without activation. B) UMAP visualization of the expression of hematopoietic and T cell markers. C) Heatmap showing expression levels of T/NK cell signature genes across all clusters. D) GSEA analysis of the memory-like CD8 cluster showing over-representation of genes enriched in memory T cells but not naive or effector T cells. E) UMAP analysis comparing cell types in CD45+ cells generated from EZ-T cell differentiation before and after activation. F) Proportion of cells in unactivated and activated CD45+ cells generated via EZ-T cell differentiation. G) CellRouter analysis showing transcriptional regulators enriched in the memory-like CD8 T cell cluster.
Fig. 6.
Fig. 6.. EZ-T cells display enhanced effector functions.
A) CD69 expression and B) CD107a degranulation of iPSC-derived T cells and peripheral blood T cells after 6 hours of PMA/ionomycin stimulation, determined by flow cytometry analysis (n=3, mean ± SEM). C) CAR-T cells generated from iPSC-derived T cells or peripheral blood T cells were co-cultured with JeKo1 and D) OCI-Ly1 tumor cell lines at indicated effector to target (E:T) ratios. Bar graph showing percentages of specific cytolysis of target tumor cells (n=3, mean ± SEM). E) Production of IL-2, F) INFγ, and G) TNFα by CD19 CAR T cells generated from iPSC-SF-T, iPSC-EZ-T, and PBMC-T cells cultured in the absence (Unstim) and presence of OCI-Ly1 target tumor cells (n=3, mean ± SEM, **** P≤0.0001).
Fig. 7.
Fig. 7.. CD19 CAR EZ-T cells mediate more robust in vivo tumor clearance
A) Schematic illustration of in vivo CAR T cell functional studies using a DLBCL mouse model. B) Bioluminescent images of tumor xenografts over time and quantification of the tumor burden over time in each animal (n=9 animals from 3 experiments), represented by mean total flux (photons/sec). C) Numbers of CAR T cells per 100μl peripheral blood from each animal, determined by flow cytometry 3 weeks after CAR T cell injection (n=8, *** P≤0.001). D) Kaplan-Meier curve showing percentage survival of untreated animals (black) and animal groups treated with CD19 CAR T cells generated from control iPSC-SF-T (red), iPSC-EZ-T (blue), or PBMC-T cells (yellow) (n=9, ** P≤0.01 by log-rank test).

Comment in

  • T cell development made EZ.
    Lavaert M, Bhandoola A. Lavaert M, et al. Cell Stem Cell. 2022 Aug 4;29(8):1155-1156. doi: 10.1016/j.stem.2022.07.003. Cell Stem Cell. 2022. PMID: 35931025

References

    1. Adachi K, Kano Y, Nagai T, Okuyama N, Sakoda Y, and Tamada K (2018) IL-7 and CCL19 expression in CAR-T cells improves immune cell infiltration and CAR-T cell survival in the tumor. Nat Biotechnol, 36, 346–351. - PubMed
    1. Aibar S, González-Blas CB, Moerman T, Huynh-Thu VA, Imrichova H, Hulselmans G, Rambow F, Marine JC, Geurts P, Aerts J et al. (2017) SCENIC: single-cell regulatory network inference and clustering. Nat Methods, 14, 1083–1086. - PMC - PubMed
    1. Baldwin TA, Sandau MM, Jameson SC, and Hogquist KA (2005) The timing of TCR alpha expression critically influences T cell development and selection. J Exp Med, 202, 111–121. - PMC - PubMed
    1. Basar R, Daher M, and Rezvani K (2020) Next-generation cell therapies: the emerging role of CAR-NK cells. Hematology Am Soc Hematol Educ Program, 2020, 570–578. - PMC - PubMed
    1. Bosselut R, Kubo S, Guinter T, Kopacz JL, Altman JD, Feigenbaum L, and Singer A (2000) Role of CD8beta domains in CD8 coreceptor function: importance for MHC I binding, signaling, and positive selection of CD8+ T cells in the thymus. Immunity, 12, 409–418. - PubMed

Publication types

MeSH terms

Substances