. 2022 Aug 4;29(8):1197-1212.e8.
doi: 10.1016/j.stem.2022.07.005.

Lipid accumulation induced by APOE4 impairs microglial surveillance of neuronal-network activity

Affiliations

Lipid accumulation induced by APOE4 impairs microglial surveillance of neuronal-network activity

Matheus B Victor et al. Cell Stem Cell. .

Abstract

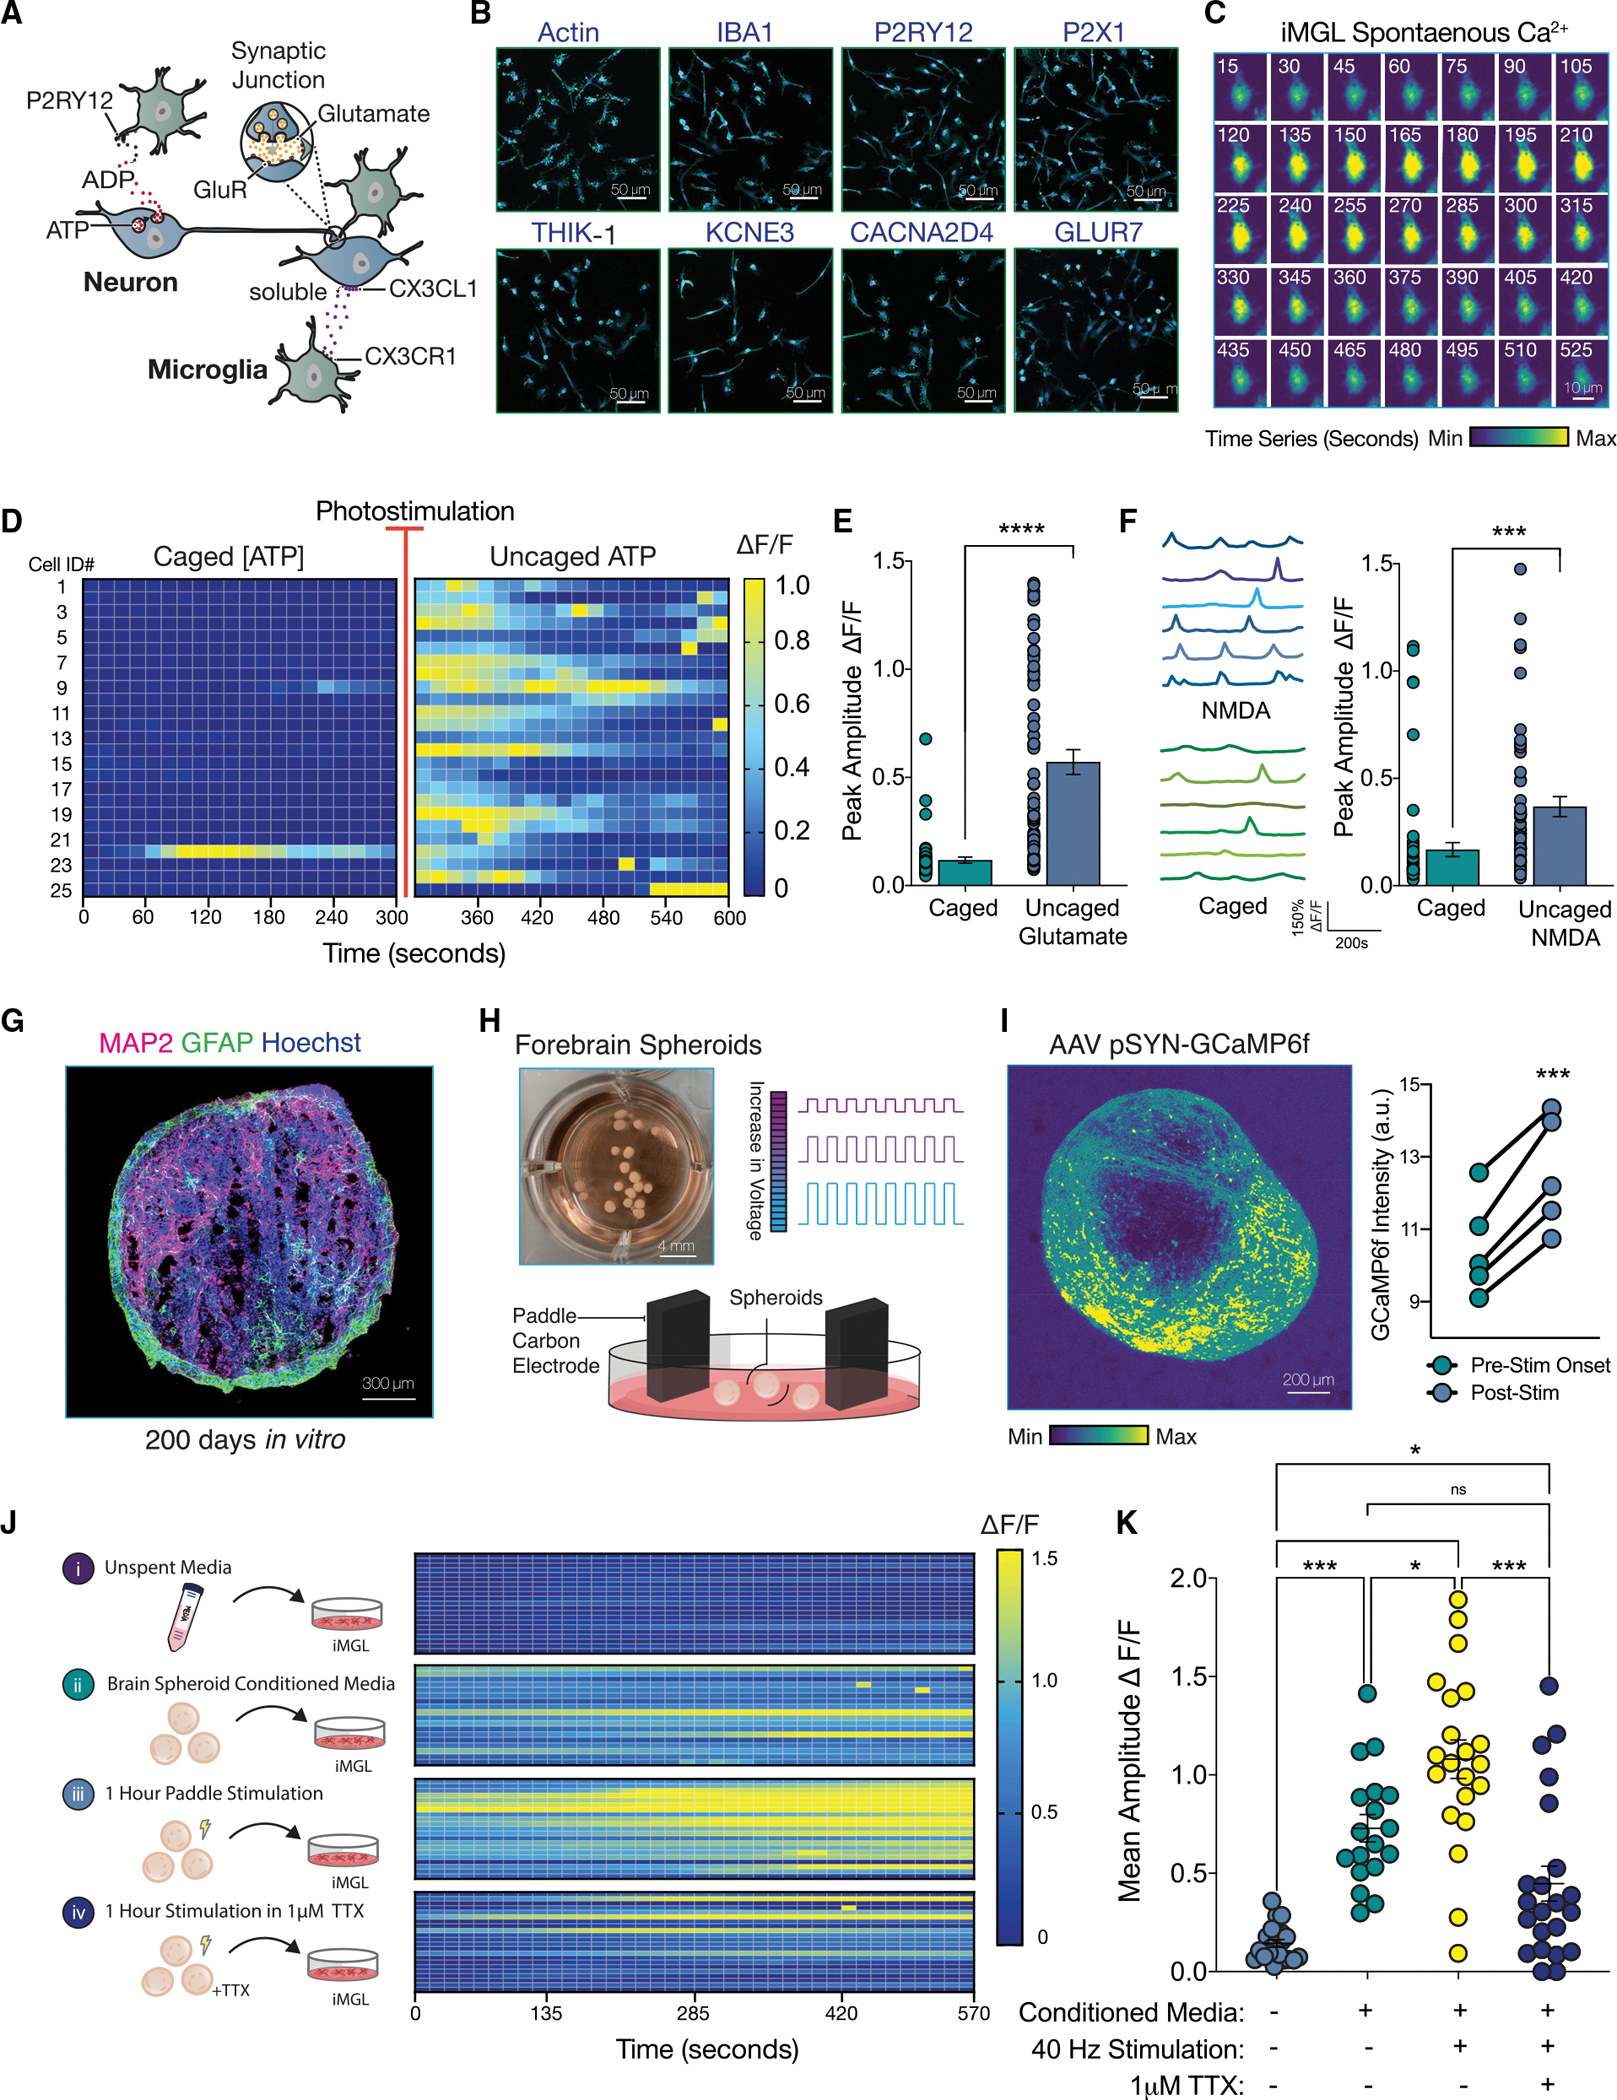
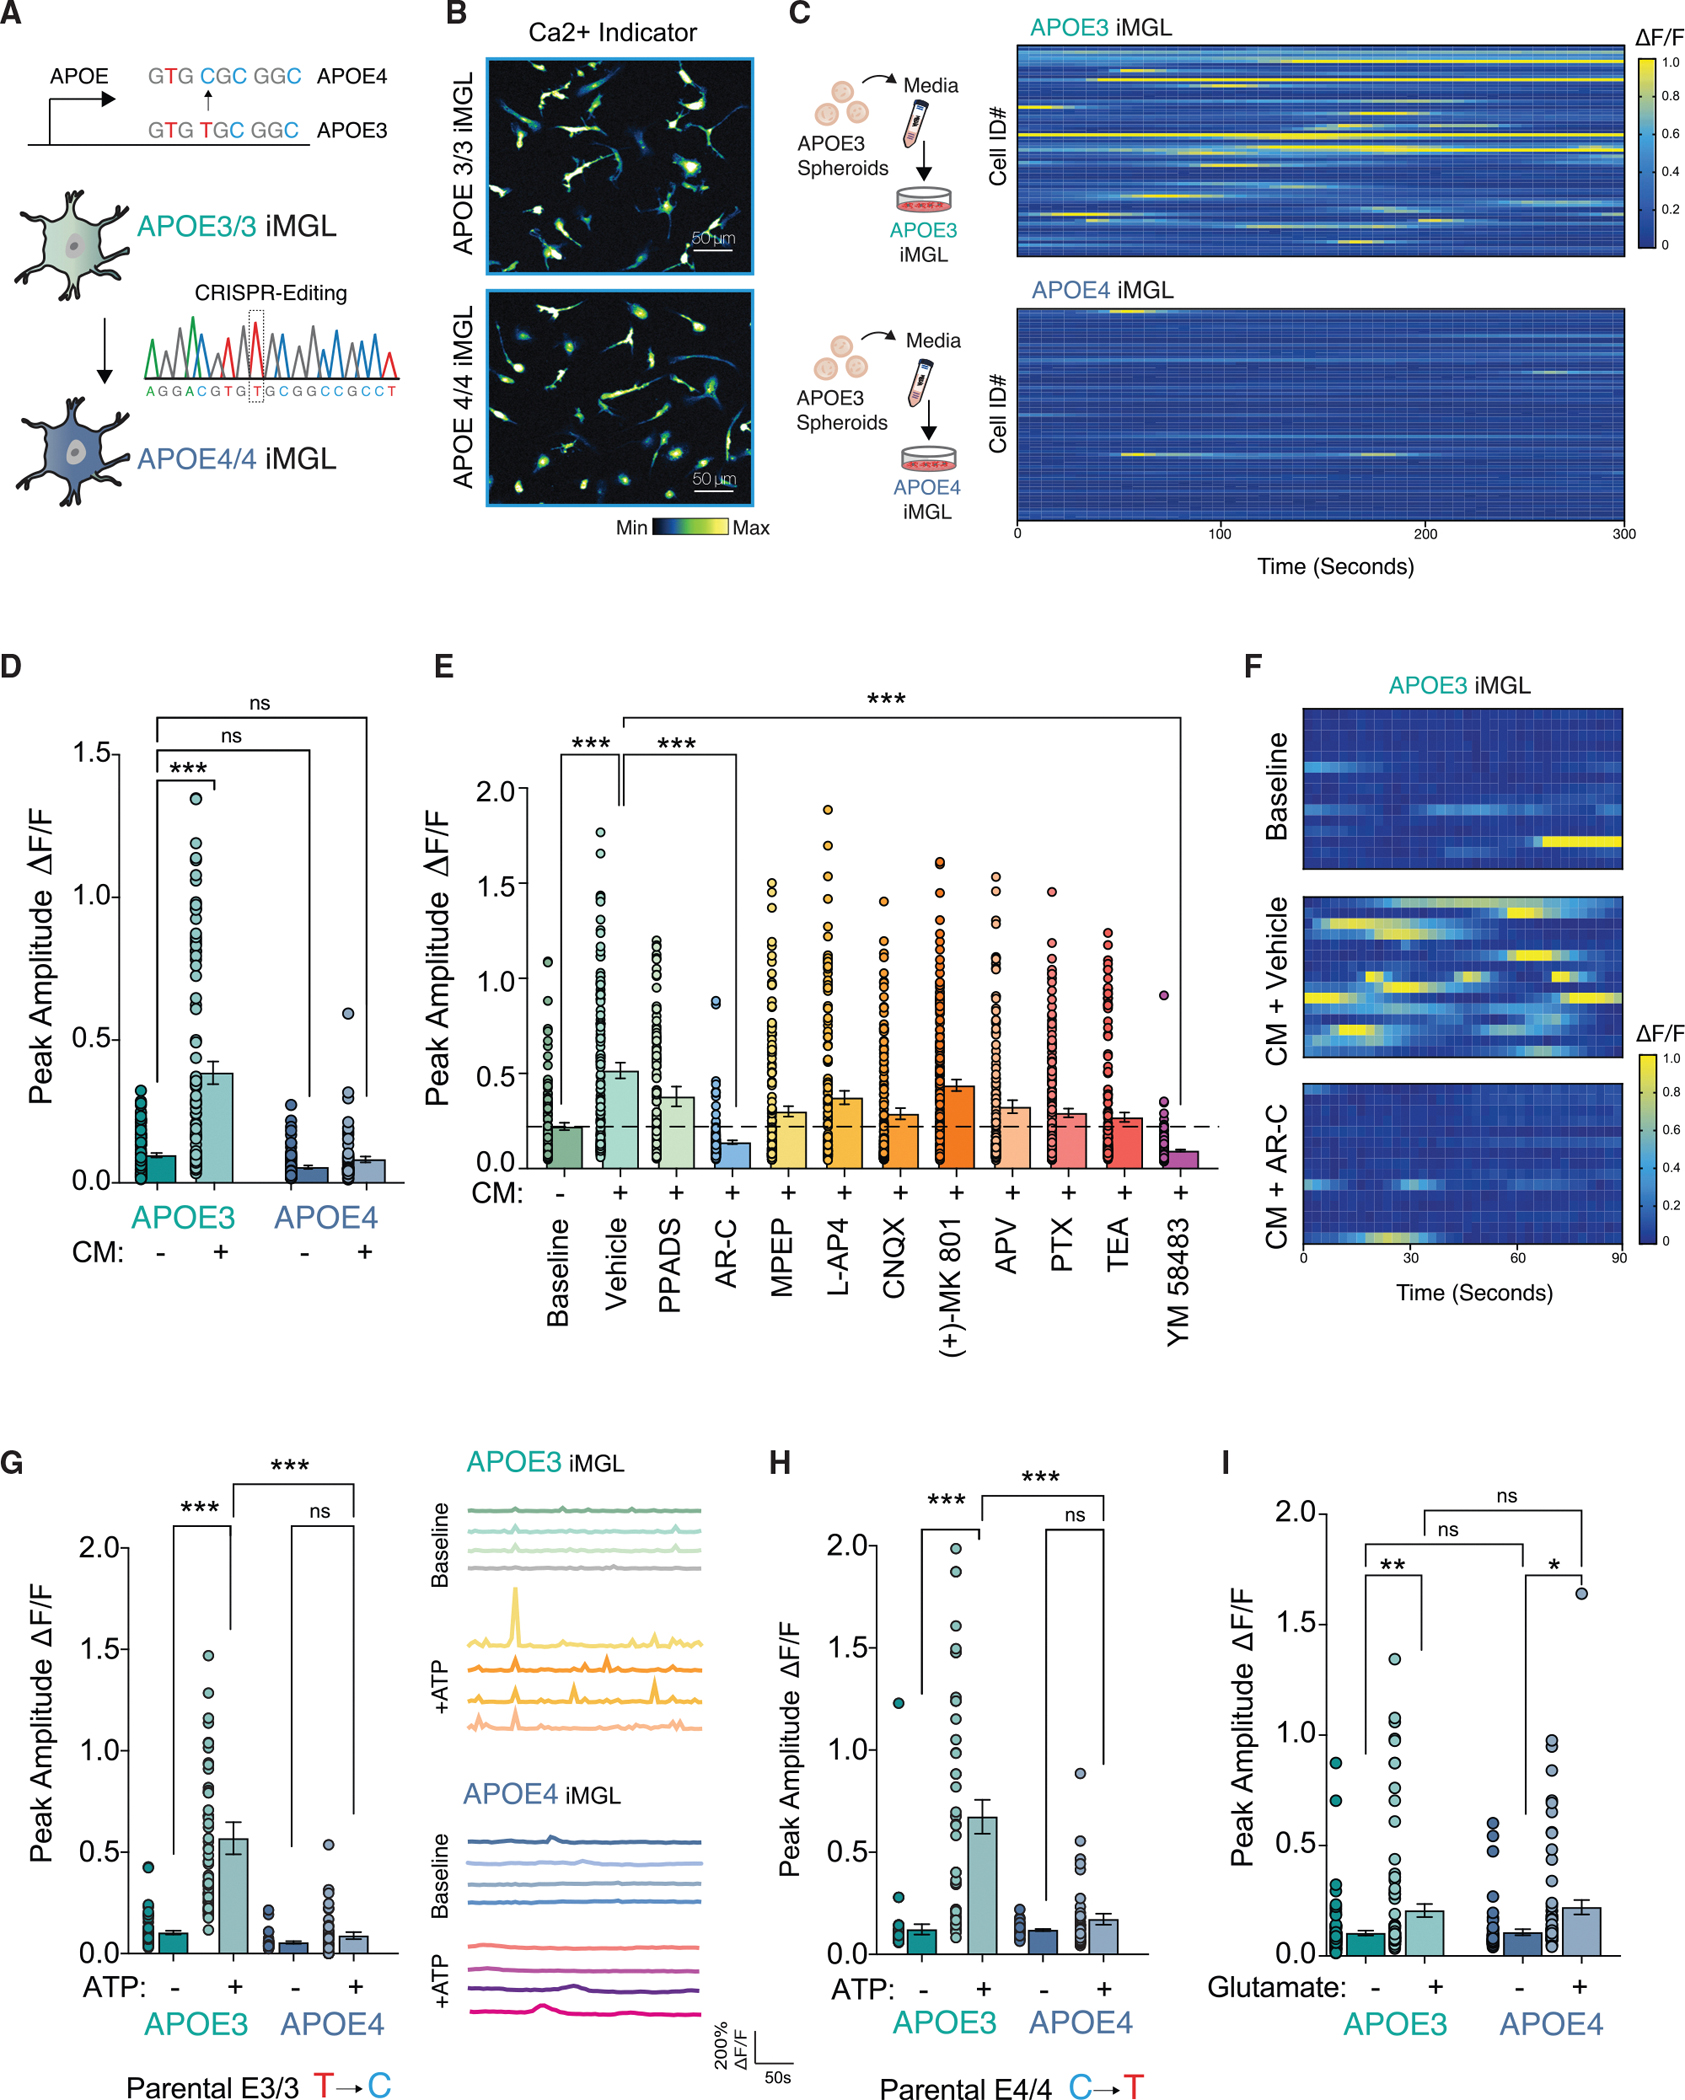
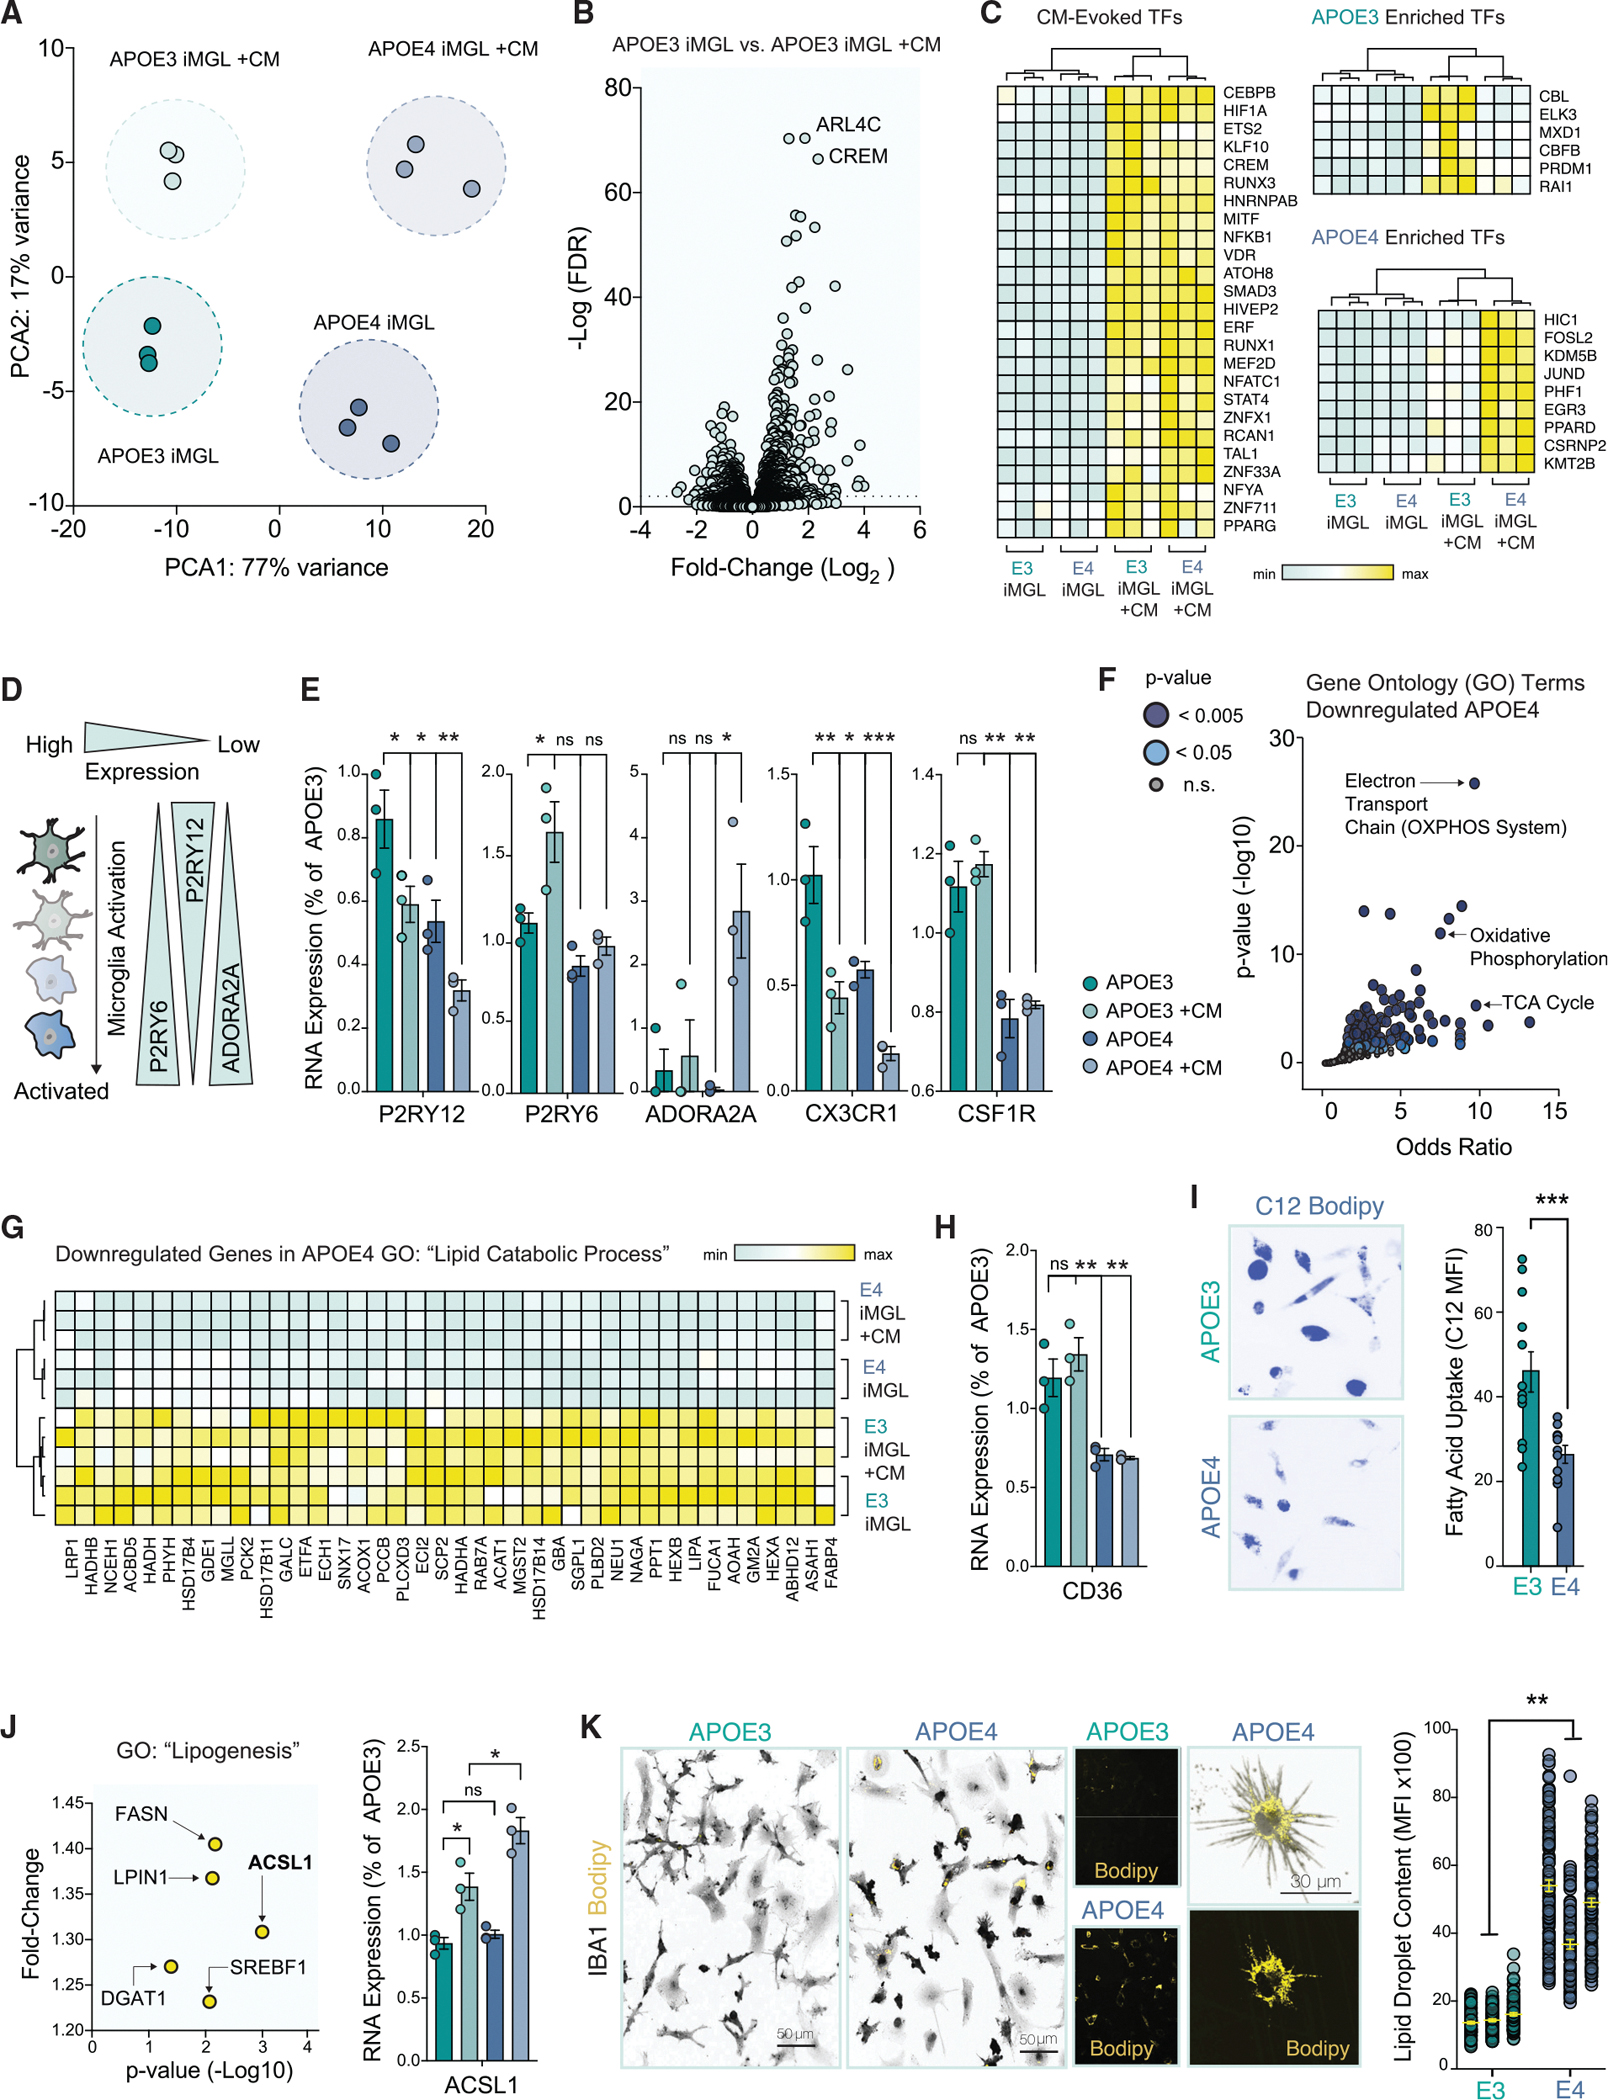
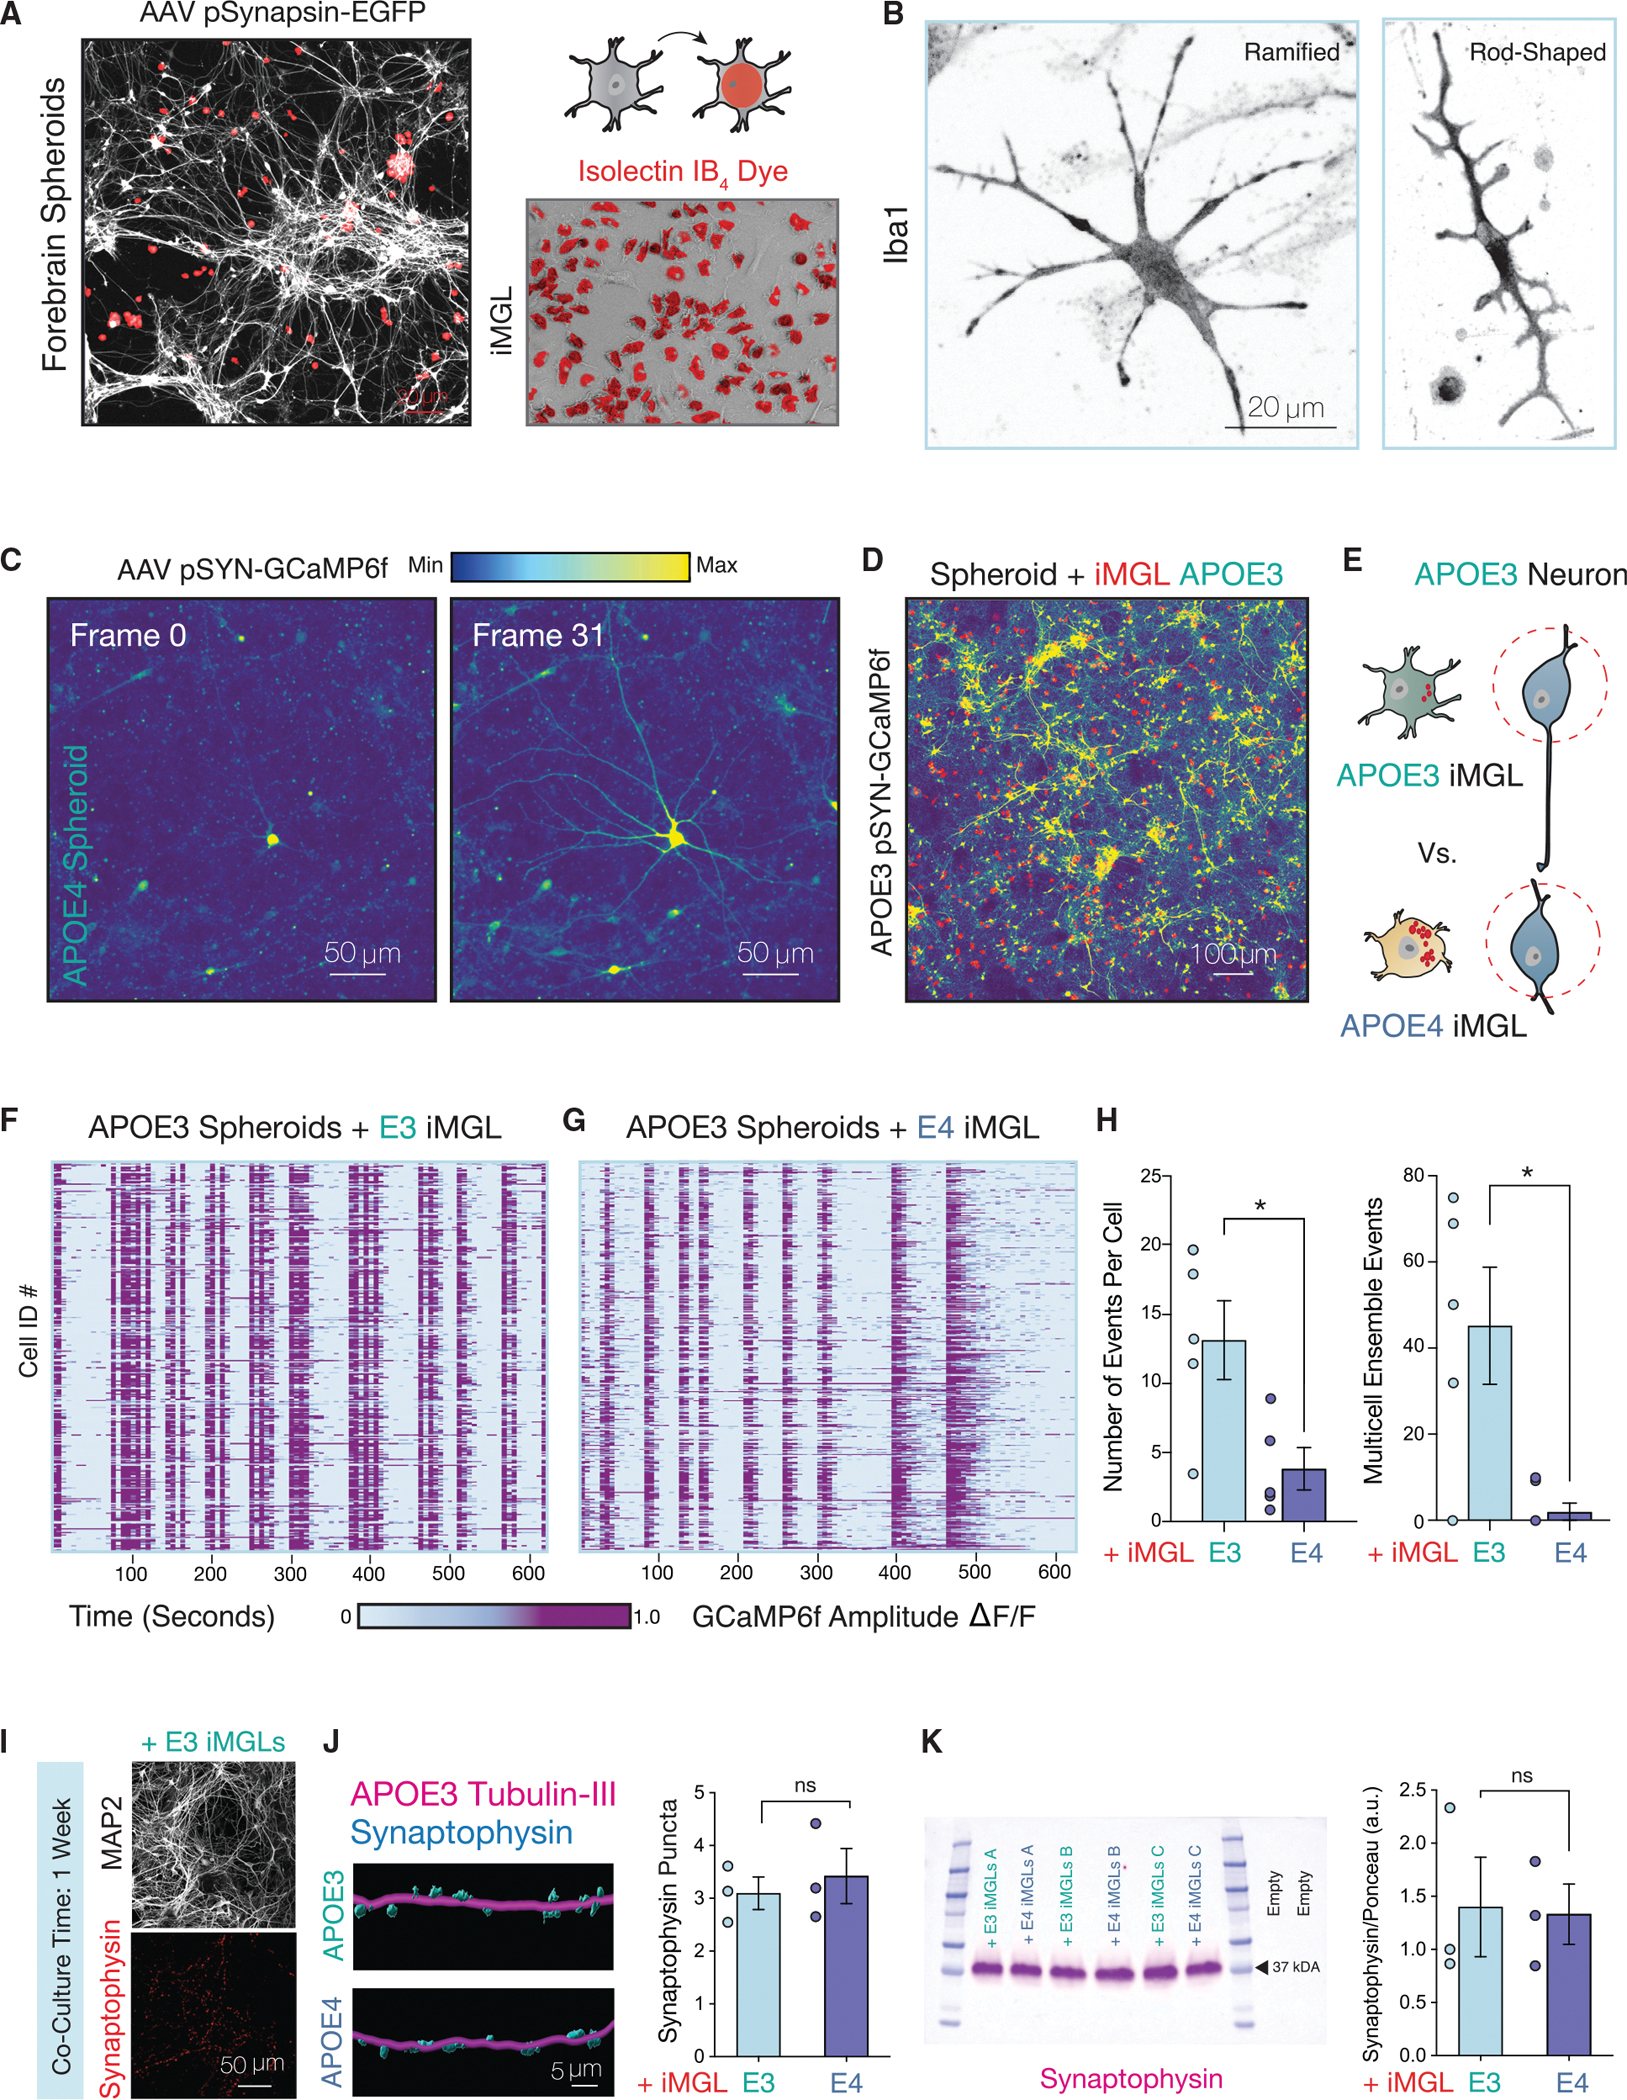
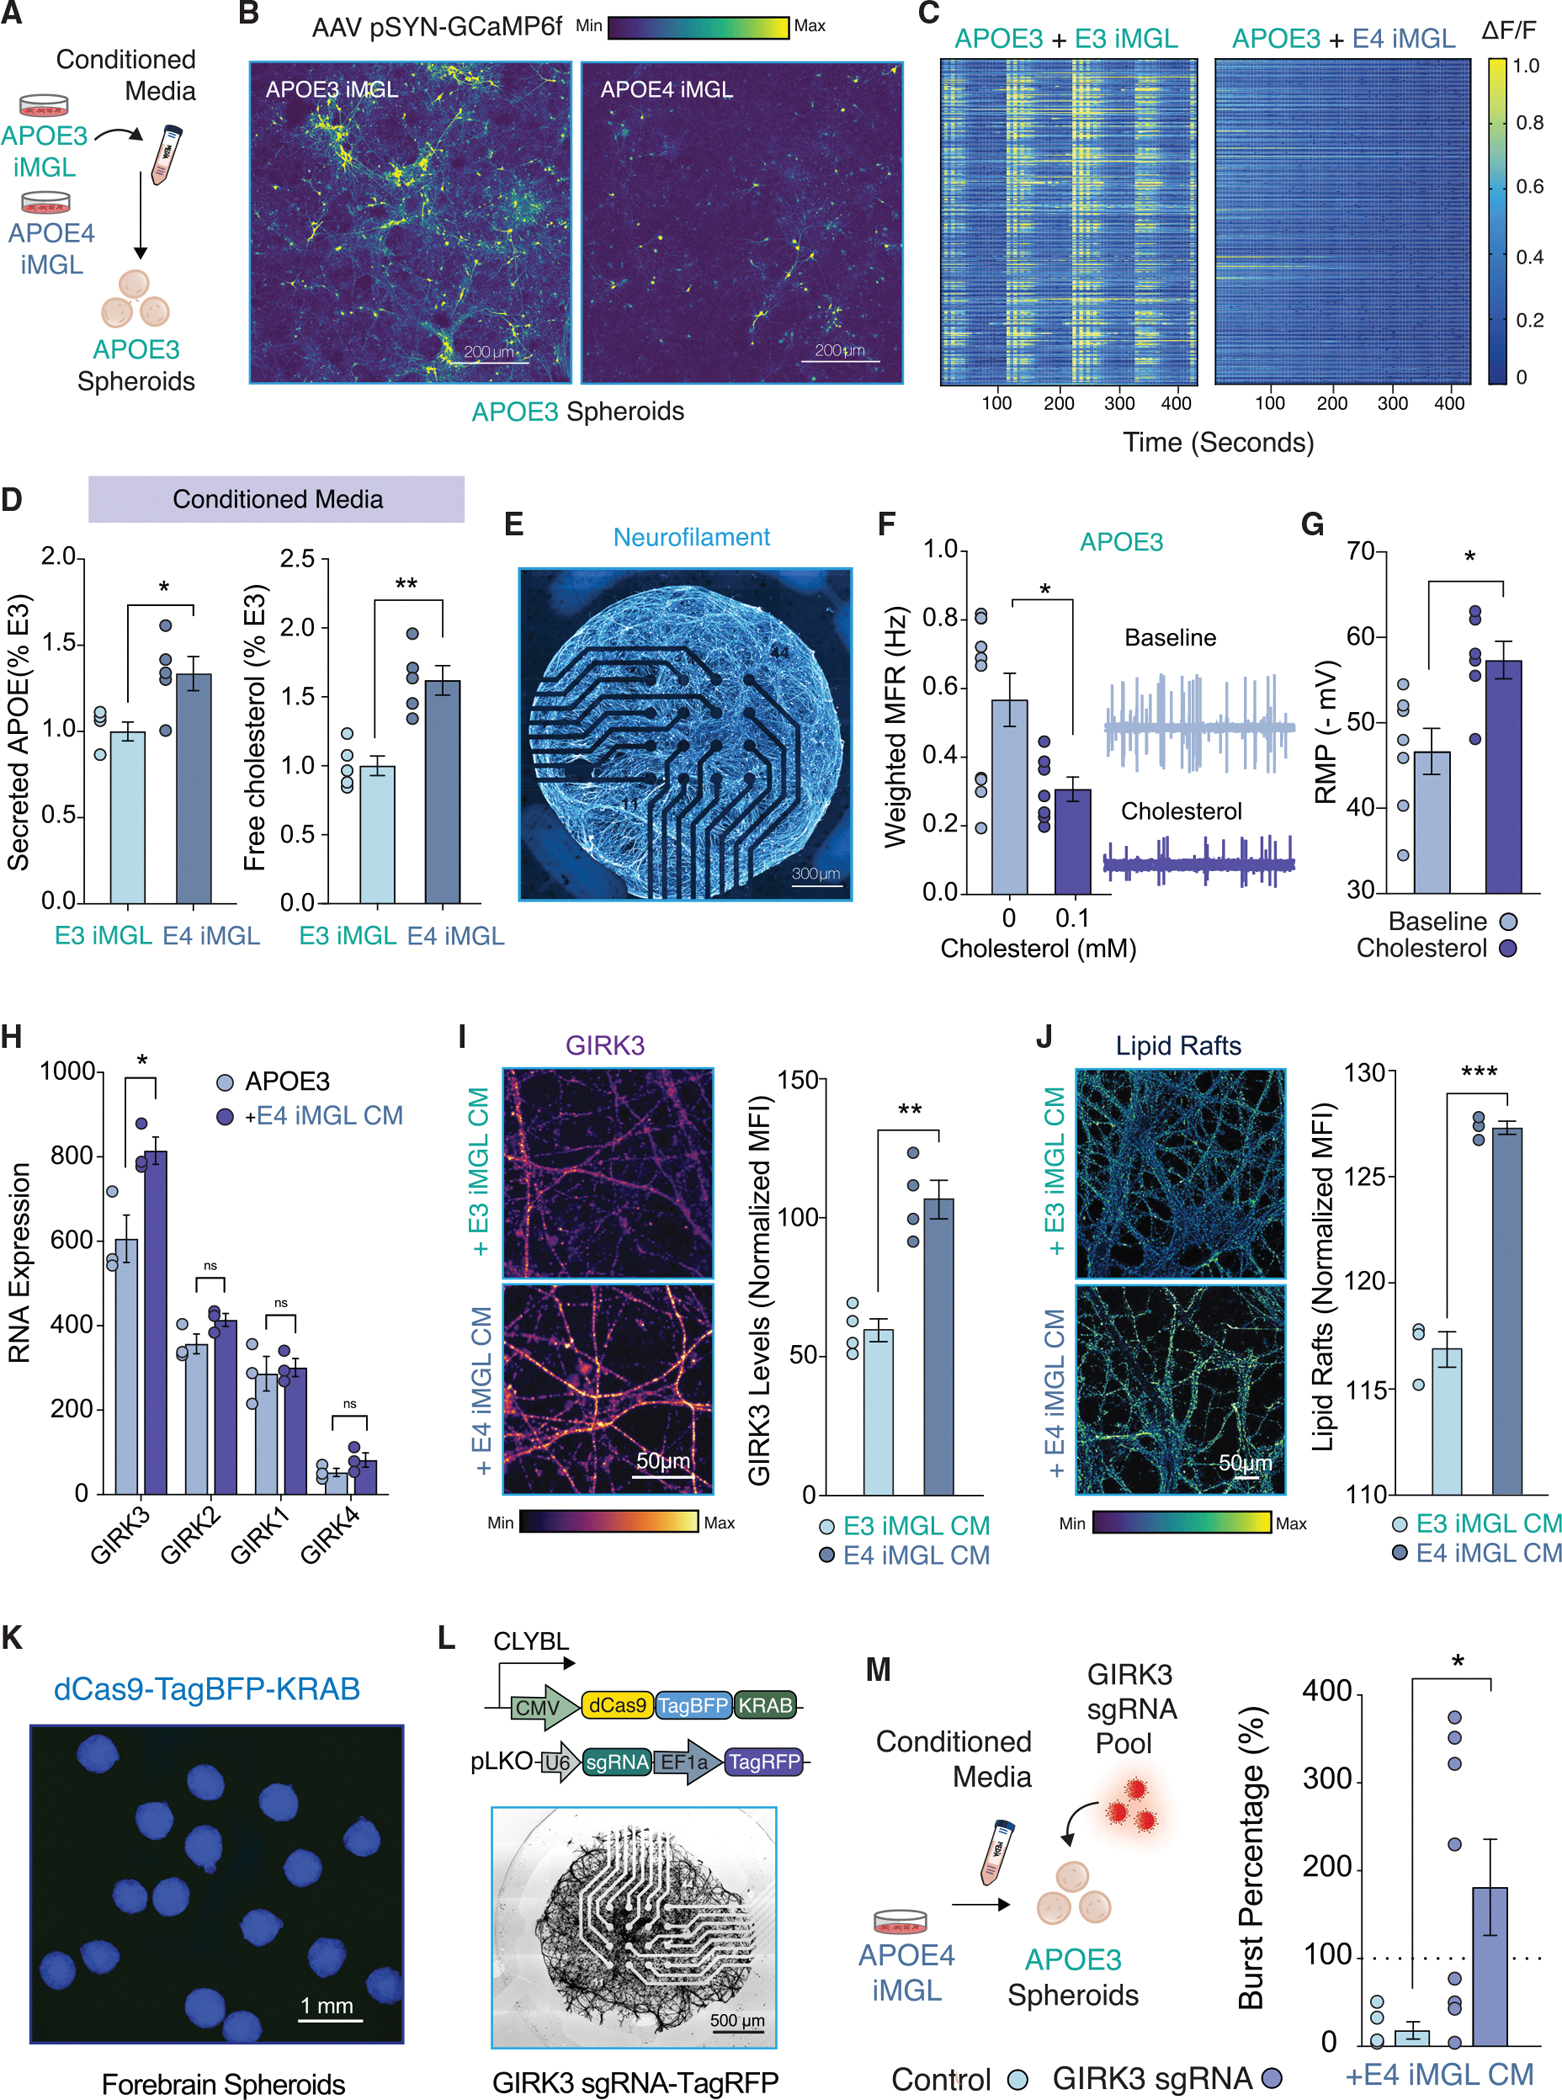
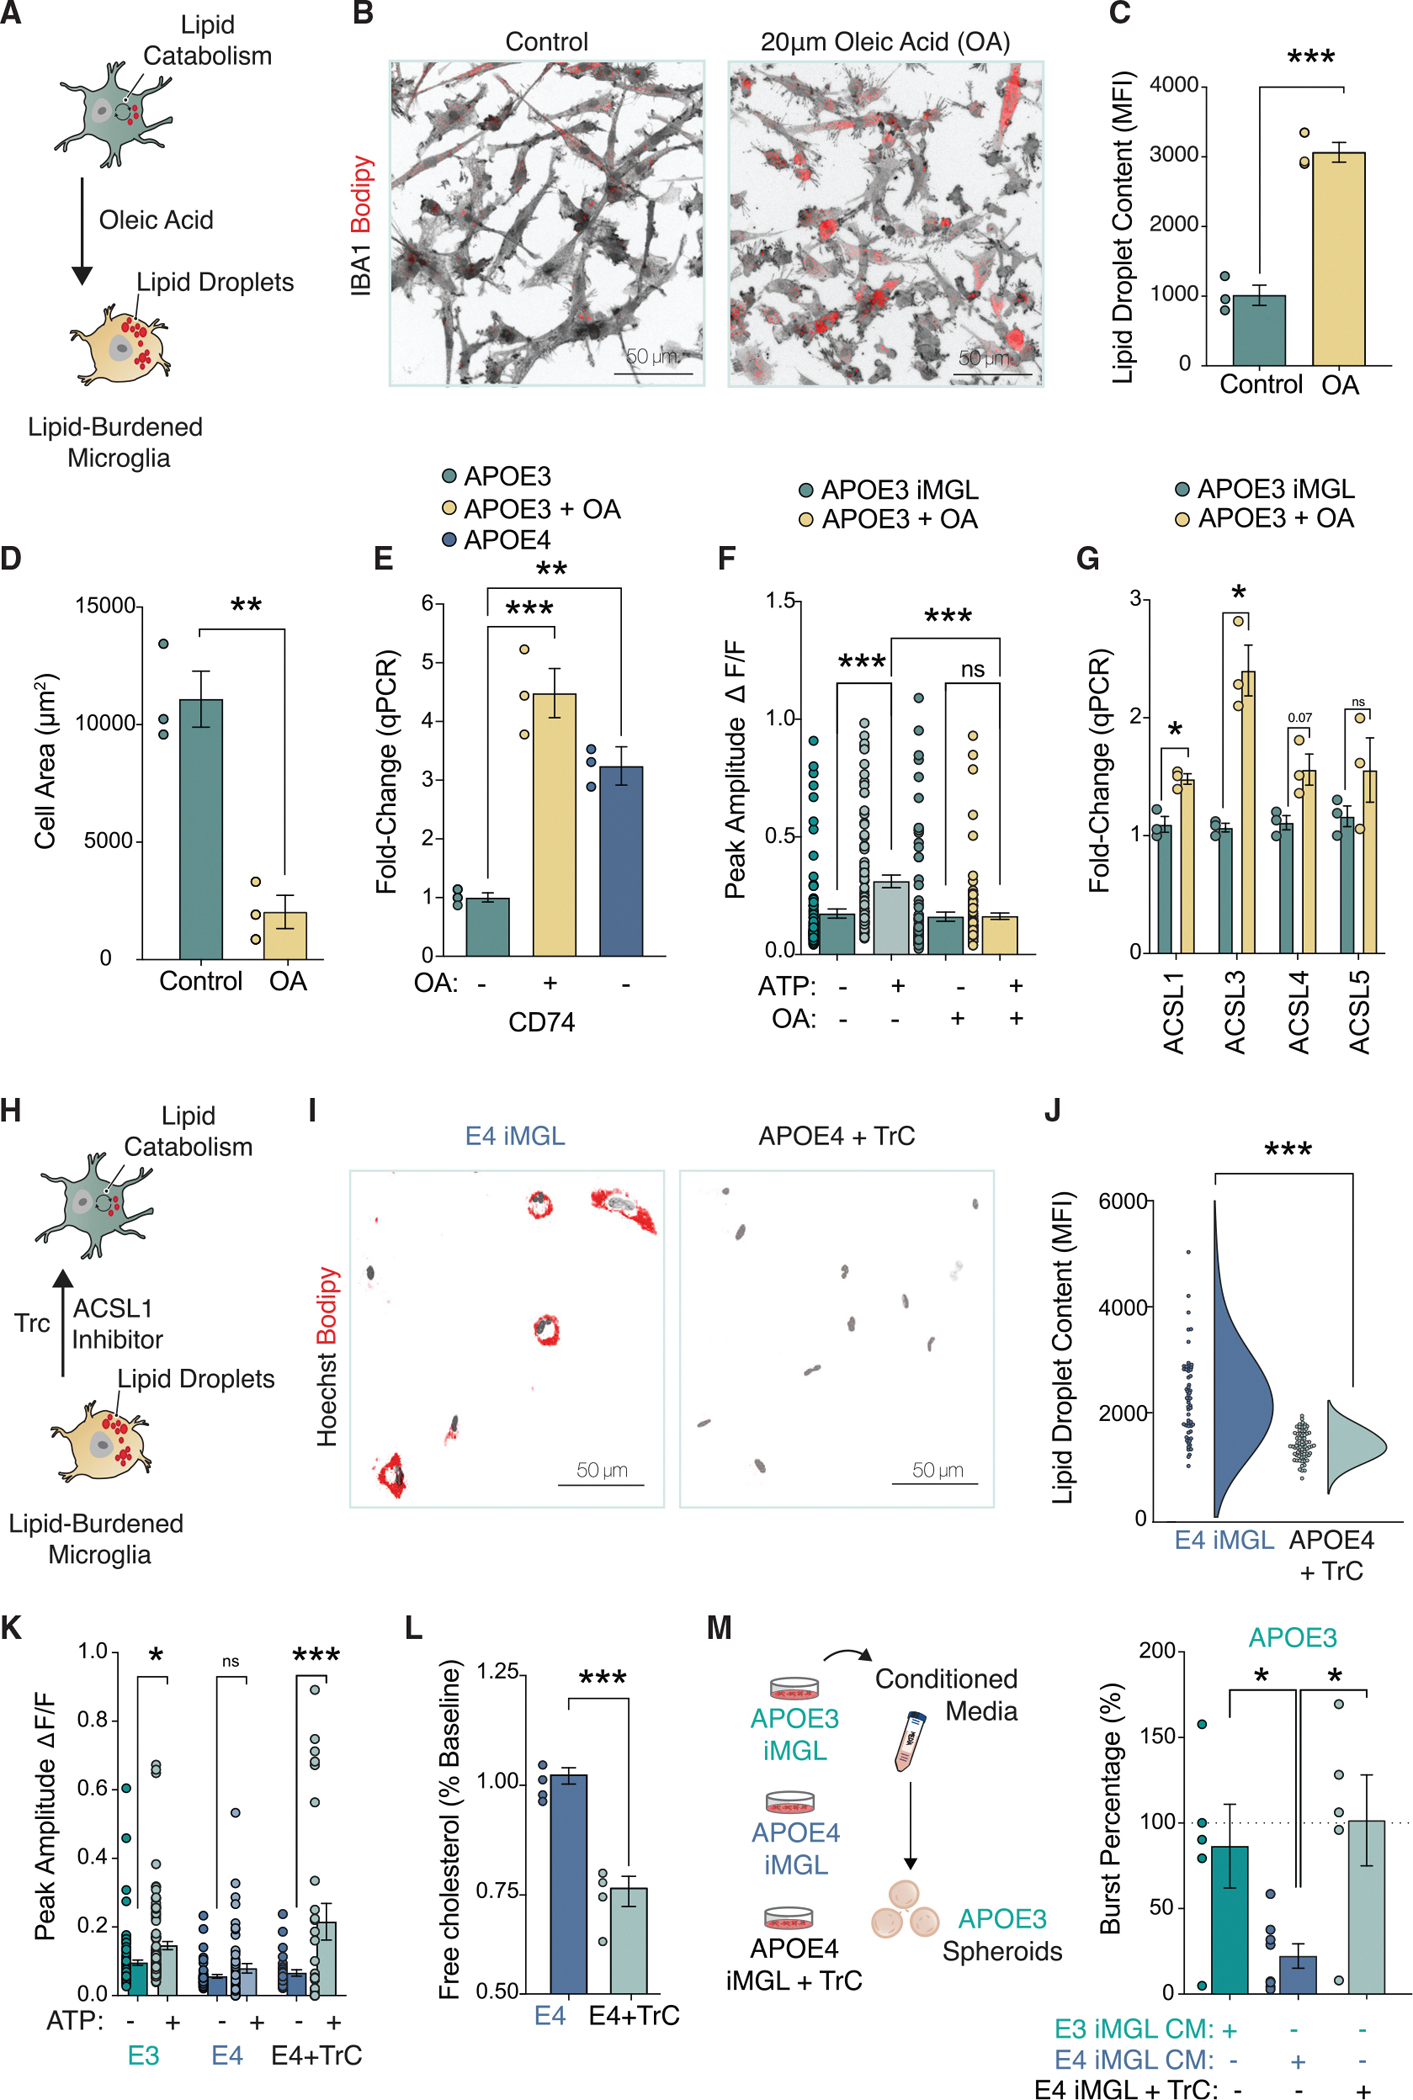
Apolipoprotein E4 (APOE4) is the greatest known genetic risk factor for developing sporadic Alzheimer's disease. How the interaction of APOE4 microglia with neurons differs from microglia expressing the disease-neutral APOE3 allele remains unknown. Here, we employ CRISPR-edited induced pluripotent stem cells (iPSCs) to dissect the impact of APOE4 in neuron-microglia communication. Our results reveal that APOE4 induces a lipid-accumulated state that renders microglia weakly responsive to neuronal activity. By examining the transcriptional signatures of APOE3 versus APOE4 microglia in response to neuronal conditioned media, we established that neuronal cues differentially induce a lipogenic program in APOE4 microglia that exacerbates pro-inflammatory signals. Through decreased uptake of extracellular fatty acids and lipoproteins, we identified that APOE4 microglia disrupts the coordinated activity of neuronal ensembles. These findings suggest that abnormal neuronal network-level disturbances observed in Alzheimer's disease patients harboring APOE4 may in part be triggered by impairment in lipid homeostasis in non-neuronal cells.

Keywords: APOE; Alzheimer’s risk variant; GIRKs; calcium dynamics; forebrain spheroids; lipid droplet; microglia; network-activity; stem cells.


Conflict of interest statement

Declaration of interests The authors declare no competing interests.

Figures

Figure 1.
Figure 1.. Neuronal activity evokes Ca2+ transients in iPSC-derived microglia-like cells
(A) Diagram depicting neuron-microglia communication. (B) iMGL (line #2191, see Key Resources Table) express canonical microglial receptors. (C) Time series (15 s) of a spontaneous calcium transient in iMGL with Fluo-4 AM. Relative minimum and maximum amplitudes are shown. (D) Heatmap of iMGL upon 1 mM ATP uncaging. Change in fluorescence shown as Delta F/F. (E) Change in fluorescence upon uncaging of 5 mM glutamate plotted as peak amplitude for baseline (caged) and post photostimulation (uncaged). (Paired t test; n = 64 cells.) (F) Representative calcium traces from 6 iMGLs before and after uncaging of 1 mM NMDA (paired t test; n = 60 cells). (G) Immunostaining of a forebrain spheroid 200 DIV (days in vitro). Neuronal marker MAP2 (magenta) and astrocyte marker, GFAP (green), nuclei stained with Hoechst (blue). (H) Forebrain spheroids stimulated using paddle carbon electrodes. (I) Live-imaging of pSYN-GCaMP6f-infected spheroids before and after electrical stimulation. Representative image of maximum projection across time frames. (Paired t test; n = 5 spheroids.) (J) Calcium imaging of iMGL in monoculture following 2 h of incubation in spheroid conditioned media (CM). (K) Peak amplitude of calcium transients from (J) is quantified and plotted (one-way ANOVA with post-hoc Tukey test; n = 18–21 cells per group). For all statistical tests, n.s. = not significant; *p-value < 0.05; **p-value < 0.01; ***p-value < 0.001; ****p-value < 0.0001. Error bars reflect SEM.
Figure 2.
Figure 2.. APOE4 iMGL are weakly attuned to neuronal-derived ATP
(A) Diagram of CRISPR-generated isogenic APOE3 and APOE4 iPSCs differentiated into iMGLs. (B) Maximum intensity projection of calcium imaging of APOE3 and APOE4 iMGLs with Fluo-4 AM. (C and D) Heatmap from isogenic pairs incubated with conditioned media (CM) from APOE3 forebrain spheroids (C), and quantified as peak amplitude change (D) in fluorescent intensity (n = 73–101 cells in each group). (E) Pharmacological blockade of APOE3 iMGLs reveals CM-evoked calcium transients are mediated via P2RY12 (See Key Resources table for full descriptions of drugs) (n = 112–217 cells in each group). (F) Representative heat maps from CM-evoked Ca2+ transients and AR-C treatment. (G and H) ATP uncaging in APOE3 and APOE4 iMGLs in multiple isogenic lines. (G) APOE3 parental line (n = 39–45 cells per group) with representative traces and (H) APOE4 parental line (n = 41–65 cells per group). (I) Glutamate uncaging (n = 61–101 cells per group). All statistical testing was performed using ANOVA with post-hoc Tukey test. n.s. = not significant; *p-value < 0.05; **p-value < 0.01; ***p-value < 0.001; ****p-value < 0.0001. Error bars reflect SEM.
Figure 3.
Figure 3.. APOE4 shifts iMGL into a metabolic distinct cell state that is marked by impaired lipid catabolism
(A) Principal component analysis (PCA) of biological triplicates for four groups: APOE3 iMGL and APOE4 iMGL, with or without APOE3 spheroid conditioned media (CM). (B) Volcano plot of differentially expressed genes (DEGs) evoked by CM in APOE3 iMGLs. Dotted line indicates FDR cut-off of 0.01. (C) Heatmap of differentially expressed transcription factors (TFs) evoked by CM. Relative minimum and maximum values per row are shown as a gradient. (D) Diagram depicting microglial activation-associated changes in purinergic signaling. (E) Read counts from RNA-seq DEGs normalized to a single biological replicate of APOE3 for P2RY12, P2RY6, ADORA2A, CX3CR1, and CSF1R (ANOVA with post-hoc Tukey test). (F) Gene ontology (GO) pathways for down-regulated DEGs in APOE4. (G) Heatmap for DEGs associated with lipid catabolism. (H) Levels of CD36 shown from normalized read counts from RNA-seq DEGs (ANOVA with post-hoc Tukey test). (I) DEGs associated with lipogenesis, upregulated in APOE4 +CM. ACSL1 levels across all groups (ANOVA with post-hoc Tukey test). (J) BODIPY staining (yellow), counterstained with IBA1 (gray) in APOE3 versus APOE4 (unpaired t test, n = 73–107 cells per group in three separate experiments; averages from the three groups were used). (K) Twenty-four hours of incubation with the green fluorescent fatty acid, C12 Bodipy (shown in blue). Unpaired t test n = 12 separate replicates in each group with 16–33 cells quantified per replicate. For all statistical tests, n.s. = not significant; *p-value < 0.05; **p-value < 0.01; ***p-value < 0.001; ****p-value < 0.0001. Error bars reflect SEM.
Figure 4.
Figure 4.. APOE4 iMGL disrupts the synchronized activity of neuronal ensembles
(A) APOE3 spheroids infected with AAV pSYN-EGFP (gray) and iMGL pre-labeled with Alexa Fluor 594 isolectin GS-IB4 conjugate (red). (B) iMGLs in co-culture with spheroids immunostained with microglia marker IBA1. (C) Activity of a single neuron from APOE4 spheroid cultures shown over 31 frames of 3 s each. Relative change in fluorescence amplitude is shown as a gradient. (D) Maximum intensity projection of GCaMP6f spheroids infected with AAV pSYN-GCaMP6f in co-culture with iMGLs. (E) Diagram depicting experimental approach. (F) Rasterplots for spontaneous APOE3 neuronal network events in co-culture for 1 week with either APOE3 or (G) APOE4 iMGLs. (H) Average number of events per cell and number of coordinated calcium transients with greater than 60% co-active cells indicative of ensemble events were quantified (n = 50–106 cells per group for 5–6 distinct experiments). (I) Co-culture of iMGLs with APOE3 neurons. MAP2-positive neuronal cultures exhibit synaptic puncta as evident by synaptophysin staining. (J) IMARIS 3D reconstruction of confocal z-stacks from neuron-microglia co-cultures from APOE3 neurons with either APOE3 and APOE4 iMGLs immunostained for neuronal marker Tubulin-III (magenta) and synaptic marker Synaptophysin (blue). Quantification for number of synaptophysin-positive puncta per 100 μm of tubulin-positive neuronal filament (n = 3 biological replicates, three field-of-views per replicate). (K) Western blot analysis of APOE3 spheroids in co-culture with APOE3 or APOE4 iMGL for 1 week for synaptophysin (n = 3 separate experiments). All statistical testing was performed using unpaired t test. N.s. = not significant; *p-value < 0.05; **p-value < 0.01; ***p-value < 0.001; ****p-value < 0.0001. Error bars reflect SEM.
Figure 5.
Figure 5.. Conditioned Media from APOE4 iMGLs is sufficient to disrupt neuronal activity via potentiation of neuronal lipid-gated K + currents
(A) Experimental approach. (B) Calcium imaging of GCAMP6f-infected spheroid cultures treated with iMGL conditioned media (CM). (C) Heatmap for changes in GCaMP6f fluorescence for APOE3 or APOE4 iMGL + CM. (D) ELISA for APOE and Cholesterol (n = 5 biological replicates). (E) NGN2-induced neurons on a multielectrode array (MEA) stained for neurofilament. (F) Weighted mean firing rate (MFR) for APOE3 NGN2-neurons in presence of cholesterol. MEA traces for a random 120 s (n = 7–10 wells). (G) Patch-clamp electrophysiology; hyperpolarization of the resting membrane potential (RMP) with cholesterol treatment (n = 6–7 per group). (H) RNA expression of lipid-gated inwardly rectifying K+ channel family (GIRK) (n = 3 biological replicates). (I–J) GIRK3 immunostaining (I) and membrane lipid rafts detection in APOE3 spheroids treated with iMGL CM (J). Mean fluorescence intensity (MFI) normalized for total arbor length in the field of view (n = averages from 3 fields of view from 3 biological replicates). (K) CRISPRi spheroids. (L and M) GIRK3 CRISPRi or APOE3 NGN2 neurons infected with a non-targeting sgRNA control were seeded on MEAs and exposed to APOE4 iMGL CM for 48 h. Dotted line represents baseline recording (n = 5–8 biological replicates). All statistical testing was performed using unpaired t tests and (H) was corrected for multiple comparisons. N.s. = not significant; *p-value < 0.05; **p-value < 0.01; ***p-value < 0.001; ****p-value < 0.0001. Error bars reflect SEM.
Figure 6.
Figure 6.. Bidirectional manipulation of lipid content can reversibly drive purinergic signaling in iMGLs
(A) iMGLs activation after 20 μM oleic acid (OA). (B) BODIPY staining shown in red, IBA1 in gray (n = 3 biological replicates with 20–30 cells per replicate). MFI = mean fluorescence intensity. (C and D) Lipid droplet accumulation and changes to cell size following OA (n = 3 biological replicates, 20–30 cells per replicate). (E) qPCR analysis for CD74 (n = 3 biological replicates). Data normalized to GAPDH and shown relative to APOE3 control. (F) OA blunts iMGL response to ATP (n = 85–110 cells quantified per group). Experiment repeated three times. (G) qPCR for long-chain-fatty-acid-CoA ligases (ASCL1 – 5) in IMGLs. (H–J) Treatment of iMGLs with 1 μM of Triacsin C depletes lipid droplets. (K) 1 mM ATP uncaging upon Triacsin C treatment. n = 29–52 cells per group. (L) Triacsin C reduces extracellular cholesterol accumulation via ELISA. n = 4 biological replicates. (M) MEA recording conducted 48 h post CM incubation onto APOE3 neurons. n = 5–8 biological replicates. Statistical testing performed using unpaired t test (C, D, J, and L). All others used ANOVA with post-hoc Tukey test. N.s. = not significant; *p-value < 0.05; **p-value < 0.01; ***p-value < 0.001; ****p-value < 0.0001. Error bars reflect SEM.

Comment in

References

    1. Abud EM, Ramirez RN, Martinez ES, Healy LM, Nguyen CHH, Newman SA, Yeromin AV, Scarfone VM, Marsh SE, Fimbres C, et al. (2017). iPSC-derived human microglia-like cells to study neurological diseases. Neuron 94, 278–293.e9. - PMC - PubMed
    1. Badimon A, Strasburger HJ, Ayata P, Chen X, Nair A, Ikegami A, Hwang P, Chan AT, Graves SM, Uweru JO, et al. (2020). Negative feedback control of neuronal activity by microglia. Nature 586, 417–423. - PMC - PubMed
    1. Boscia F, Esposito CL, Casamassa A, de Franciscis V, Annunziato L, and Cerchia L (2013). The isolectin IB4 binds RET receptor tyrosine kinase in microglia. J. Neurochem. 126, 428–436. - PubMed
    1. Bukiya AN, Blank PS, and Rosenhouse-Dantsker A (2019). Cholesterol intake and statin use regulate neuronal G protein-gated inwardly rectifying potassium channels. J. Lipid Res. 60, 19–29. - PMC - PubMed
    1. Bukiya AN, Durdagi S, Noskov S, and Rosenhouse-Dantsker A (2017). Cholesterol up-regulates neuronal G protein-gated inwardly rectifying potassium (GIRK) channel activity in the hippocampus. J. Biol. Chem. 292, 6135–6147. - PMC - PubMed

Publication types