. 2022 Aug 4;29(8):1213-1228.e8.
doi: 10.1016/j.stem.2022.07.008.

Dynamic and adaptive cancer stem cell population admixture in colorectal neoplasia

Affiliations

Dynamic and adaptive cancer stem cell population admixture in colorectal neoplasia

Ester Gil Vasquez et al. Cell Stem Cell. .

Erratum in

  • Dynamic and adaptive cancer stem cell population admixture in colorectal neoplasia.
    Gil Vazquez E, Nasreddin N, Valbuena GN, Mulholland EJ, Belnoue-Davis HL, Eggington HR, Schenck RO, Wouters VM, Wirapati P, Gilroy K, Lannagan TRM, Flanagan DJ, Najumudeen AK, Omwenga S, McCorry AMB, Easton A, Koelzer VH, East JE, Morton D, Trusolino L, Maughan T, Campbell AD, Loughrey MB, Dunne PD, Tsantoulis P, Huels DJ, Tejpar S, Sansom OJ, Leedham SJ. Gil Vazquez E, et al. Cell Stem Cell. 2022 Nov 3;29(11):1612. doi: 10.1016/j.stem.2022.09.005. Cell Stem Cell. 2022. PMID: 36332574 Free PMC article. No abstract available.

Abstract

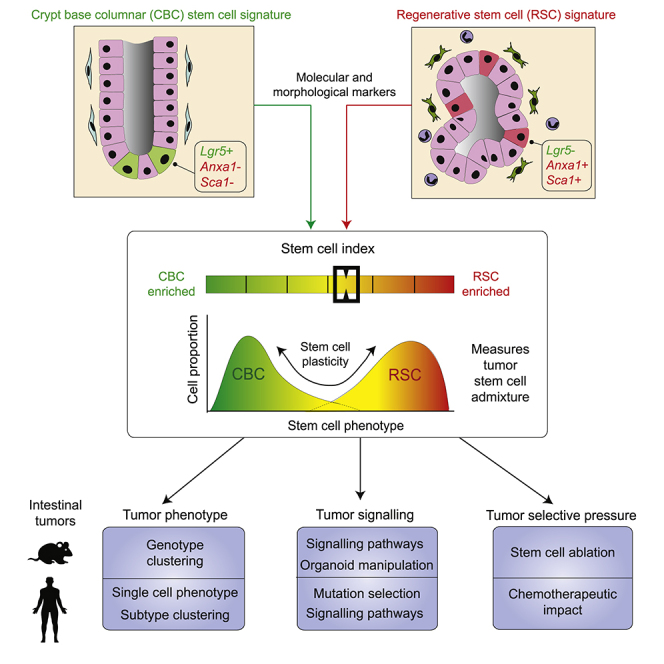
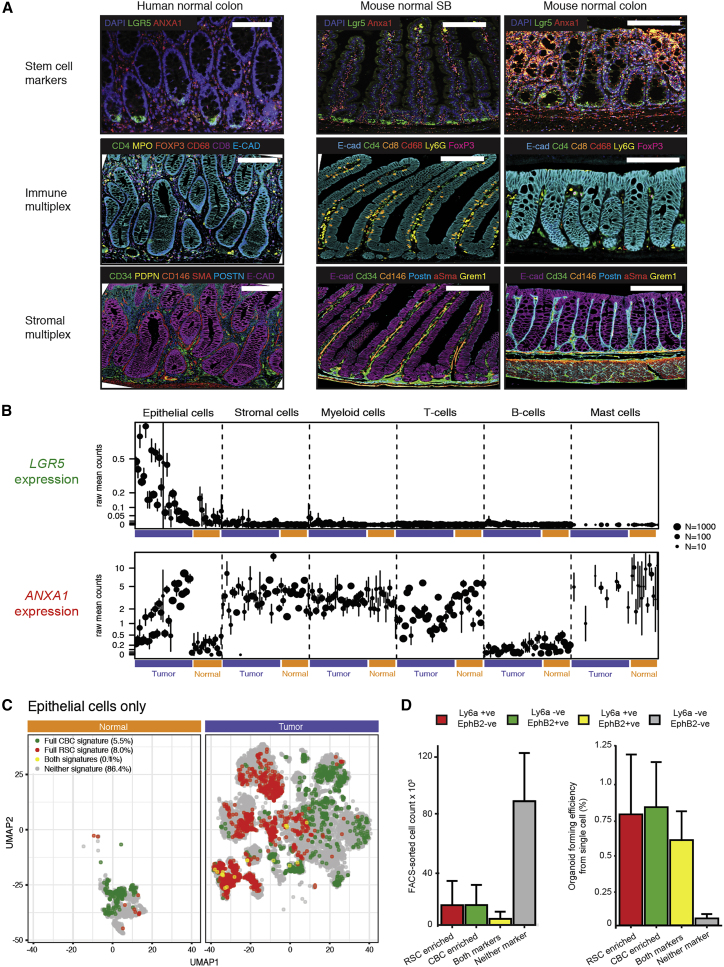
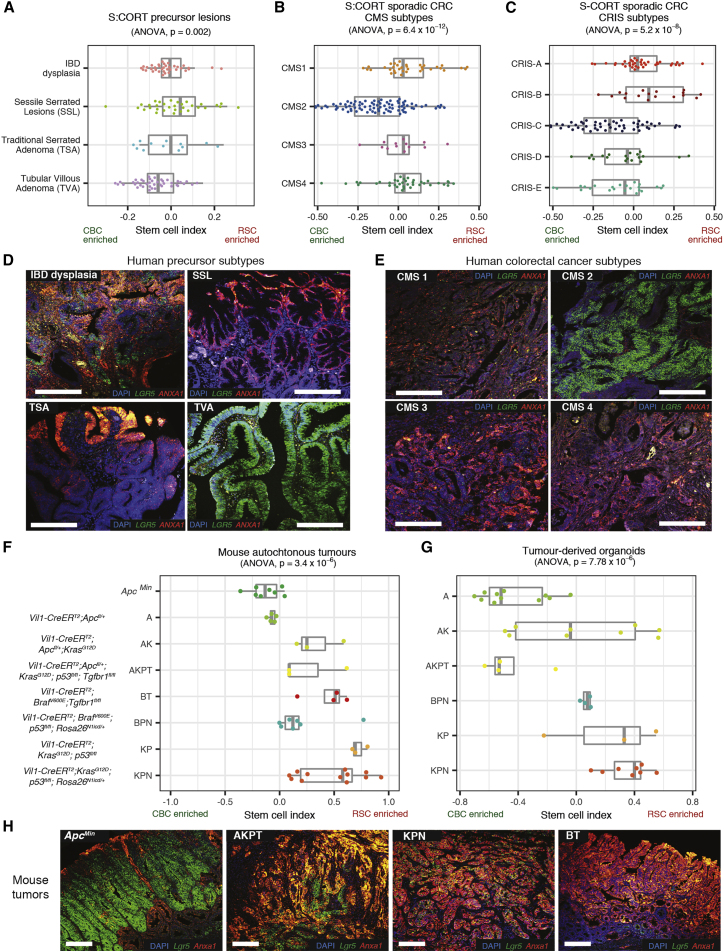
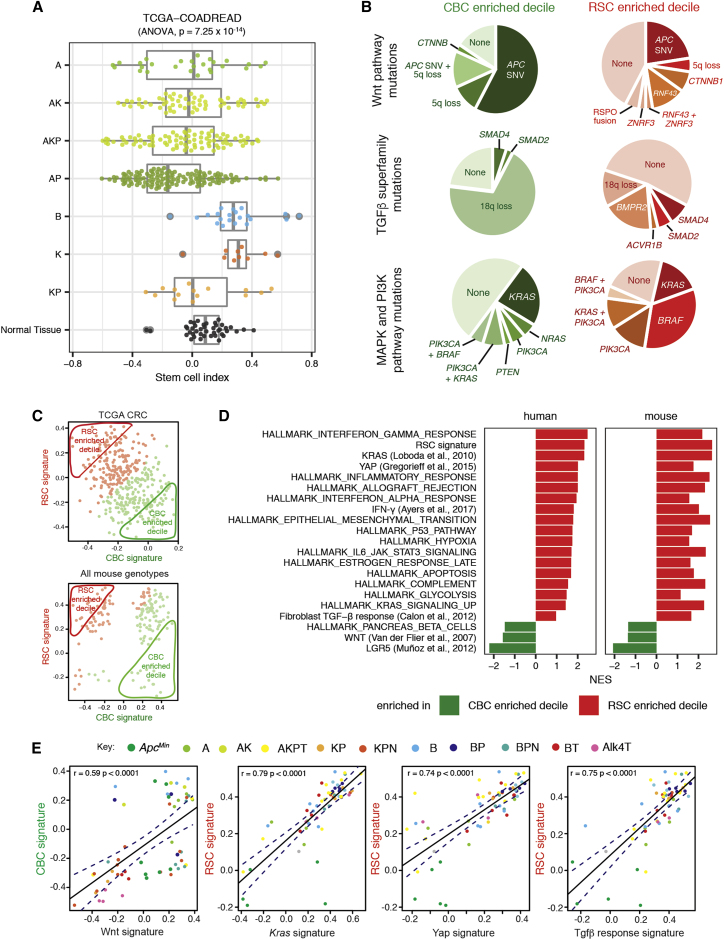
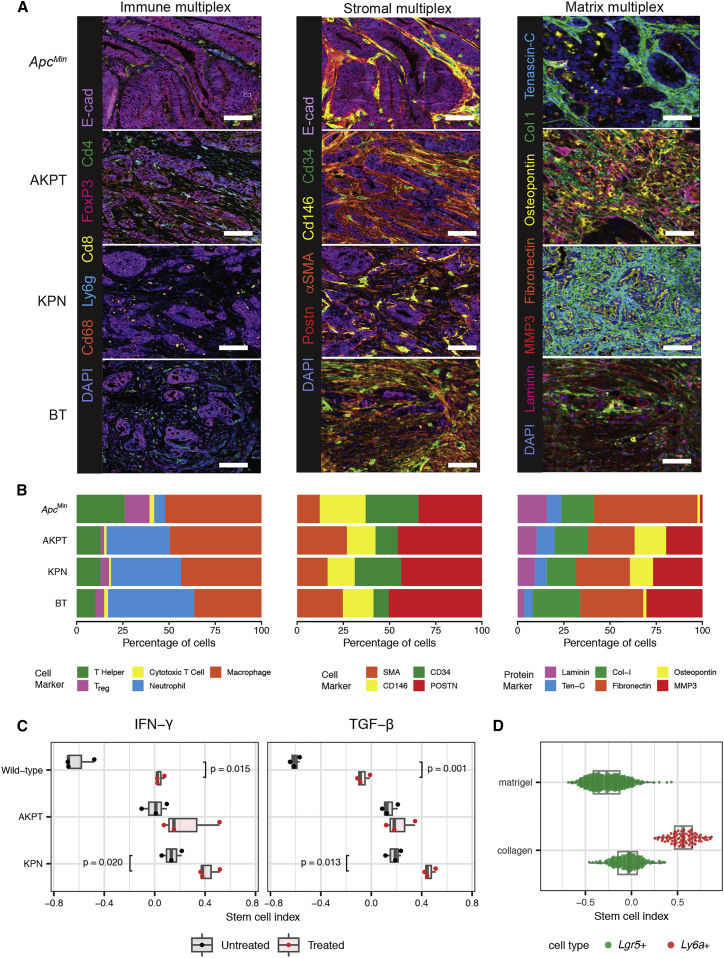
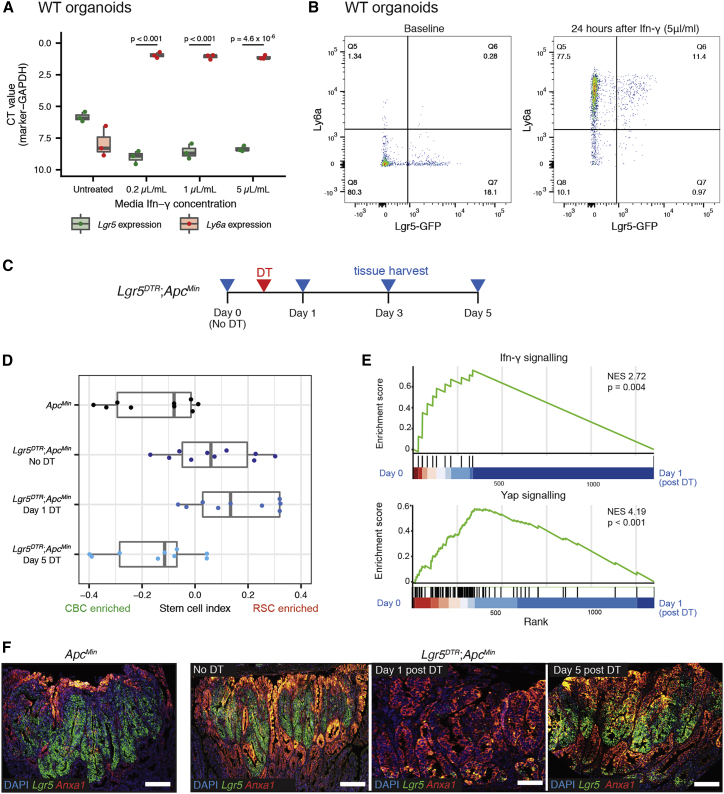
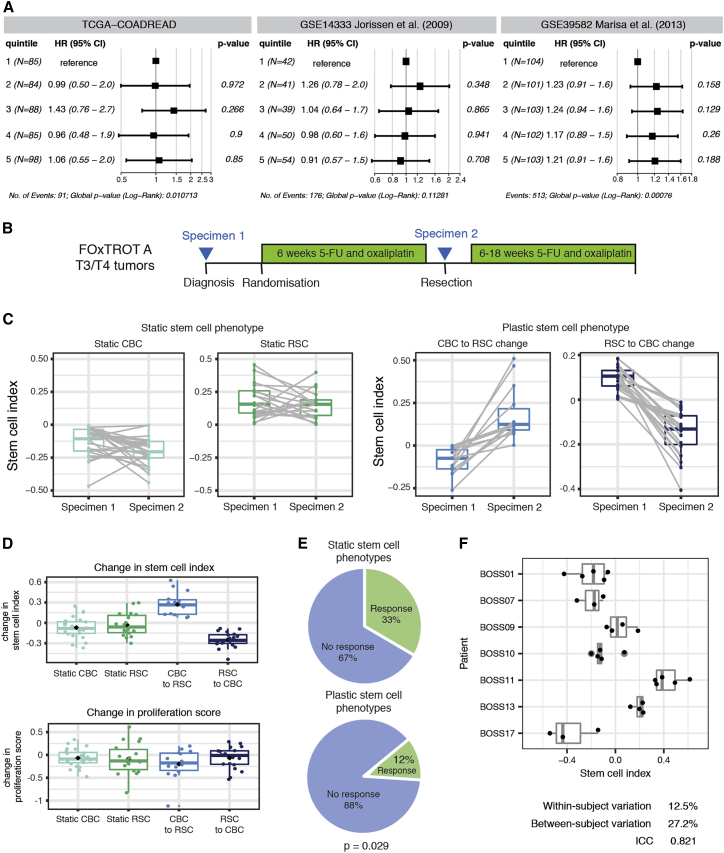
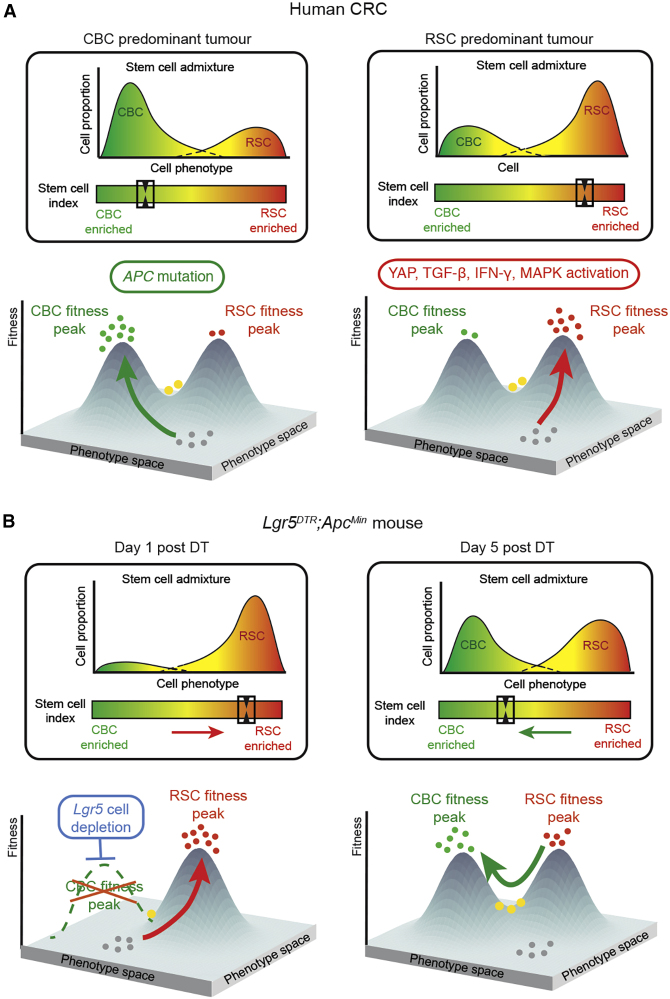
Intestinal homeostasis is underpinned by LGR5+ve crypt-base columnar stem cells (CBCs), but following injury, dedifferentiation results in the emergence of LGR5-ve regenerative stem cell populations (RSCs), characterized by fetal transcriptional profiles. Neoplasia hijacks regenerative signaling, so we assessed the distribution of CBCs and RSCs in mouse and human intestinal tumors. Using combined molecular-morphological analysis, we demonstrate variable expression of stem cell markers across a range of lesions. The degree of CBC-RSC admixture was associated with both epithelial mutation and microenvironmental signaling disruption and could be mapped across disease molecular subtypes. The CBC-RSC equilibrium was adaptive, with a dynamic response to acute selective pressure, and adaptability was associated with chemoresistance. We propose a fitness landscape model where individual tumors have equilibrated stem cell population distributions along a CBC-RSC phenotypic axis. Cellular plasticity is represented by position shift along this axis and is influenced by cell-intrinsic, extrinsic, and therapeutic selective pressures.

Keywords: cell plasticity; colorectal cancer; colorectal neoplasia; intestinal polyps; intestinal stem cells; molecular phenotyping; stem cells.


Conflict of interest statement

Declaration of interests S.J.L. has received grant income from UCB Pharma. V.H.K. has served as an invited speaker on behalf of Indica Labs. All other authors declare no competing interests.

Figures

None
Graphical abstract
Figure 1
Figure 1
Molecular and morphological assessment of the crypt-base columnar and regenerative stem cell marker expression spectrum (A) Dual color in situ hybridization (ISH) and multiplex immunohistochemistry (IHC) to show expression pattern of representative CBC and RSC markers alongside homeostatic immune and stromal cell distribution in normal mouse and human intestine. Scale bar, 100 μm. (B) Distribution of human multicompartmental scRNA expression of LGR5 (CBC marker) and ANXA1 (RSC marker) in normal compartments (orange bars) and cancer cell compartments (purple bars). Mean expression and 95% confidence intervals are shown. (C) Uniform Manifold Approximation and Projection (UMAP) plot of single epithelial cells from human normal and colorectal cancer samples showing cell populations enriched for CBC (green cells), RSC (red cells), and mixed CBC and RSC gene expression (yellow cells). Cells with no enriched stem cell signature expression are shown in gray. (D) Stem cell-marker-expressing cell count and organoid forming efficiency from plated single cells following FACS segregation of KPN mouse primary tumors, measured at day 7 post seeding (mean ± SD shown).
Figure 2
Figure 2
Application of stem cell index to mouse and human neoplasia (A–C) Using stem cell index to map human colorectal precursor lesions (A), colorectal cancer consensus molecular subtypes (CMS) (B), and colorectal cancer intrinsic subtypes (CRIS) (C) across a molecularly defined CBC to RSC expression spectrum (using S-CORT datasets). (D and E) Dual-color ISH for LGR5 (CBC marker, green) and ANXA1 (RSC marker, red) expression in representative human precursor lesions (D) and representative human colorectal cancers (E) segregated by consensus molecular subtype. (F and G) Using stem cell index to map mouse autochthonous tumors (F) and matched derived organoids (G) across a molecularly defined CBC to RSC expression spectrum. (H) Dual-color ISH for Lgr5 (CBC marker, green) and Anxa1 (RSC marker, red) expression in representative genotype tumors across the CBC to RSC spectrum. Statistical analysis, ANOVA, p values as stated. All animals crossed with Vil-CreERT2. Scale bars, 100 μm. Driver alleles initialization: A is Apcfl/+, ApcMin is ApcMin, B is BrafV600E, K is KrasG12D, P is p53fl/fl, T is Tgfβr1fl/fl, N is Rosa26N1icd/+.
Figure 3
Figure 3
Driver genes and pathways associated with variable stem cell molecular phenotype (A) Human genotype-stem cell phenotype correlation based on stem cell index distribution in TCGA tumors with different putative driver gene single-nucleotide variant (SNV) mutation genotypes, contrasted to normal tissue from same dataset (driver gene initials: A is APC, K is KRAS, P is p53, B is BRAF). (B) Comparison of mutation type and prevalence disrupting the Wnt pathway, MAPK and PIK3CA pathways, and the TGFβ superfamily in TCGA tumors subdivided into CBC- and RSC-predominant deciles. (C) Segregation of mouse and human lesions by CBC (x axis) and RSC (y axis) signature expression. Predominant (above median) expression signature in each tumor is defined by color (CBC in green and RSC in red), and the 10% most polarized CBC- or RSC-expressing tumors were segregated into CBC- and RSC-enriched deciles for comparison. (D) Gene set enrichment analysis of hallmark and select pathways in bulk transcriptome from human tumors (TCGA) and murine lesions (Glasgow dataset) segregated into CBC- and RSC-predominant deciles. Pathways shown have PFDR ≤ 0.25 apart from YAP in the mouse lesions and Fibroblast TGFβ response in the human tumors. (E) Correlation of key pathway expression signatures with CBC or RSC gene expression across a range of mouse models. Different genotypes are identified by different colors as determined by the key. Driver alleles initialization: A is Apcfl/+, ApcMin is ApcMin, B is BrafV600E, K is KrasG12D, P is p53fl/fl, T is Tgfβr1fl/fl, N is Rosa26N1icd/+, Alk4 is Alk4fl/fl.
Figure 4
Figure 4
Microenvironmental landscaping and crosstalk influences epithelial stem cell phenotype (A) Representative multiplex IHC images of immune, stromal, and matrix landscapes in mouse tumors selected from across the stem cell phenotypic axis. Scale bars, 100 μm. (B) Variable proportion of different cell/matrix components in tumors from each genotype quantified from multiplex IHC images (n = 3 mice per genotype). (C) Impact of media supplementation of IFN-γ (1 μL/mL) and TGFβ1 (0.5 μL/mL) on stem cell phenotype of wild-type and AKPT and KPN mouse tumor organoids. t test, p values as stated. (D) Stem cell index applied to single-cell transcriptome data derived from organoids grown in Matrigel or collagen matrix (from Ramadan et al., 2021).
Figure 5
Figure 5
Adaptive shift of stem cell phenotype under selective pressure (A) Shift in stem cell-marker expression detected by qRT-PCR following exposure of wild-type organoids to increasing concentrations of media IFN-γ. Statistical analysis, t test, p values as stated. (B) Skewed expression of stem cell markers, detected by FACS for Ly6a and GFP, following exposure of Lgr5-GFP labeled murine organoids to 5 μL/mL of media IFN-γ. (C) Schematic showing timing of recombination, Diphtheria Toxin (DT) activation, and tissue harvesting of Lgr5DTR;ApcMin mice. (D) Using stem cell index to map polyp tissue from ApcMin and Lgr5DTR;ApcMin to show dynamic change in stem cell molecular phenotype measured by stem cell index, before and after DTR activation and CBC cell ablation. (E) Gene set enrichment analysis showing enrichment of Ifn-γ signaling and Yap signaling between day 0 (unrecombined) and day 1 (after DTR stem cell ablation). (F) Dual-color ISH for Lgr5 (CBC marker, green) and Anxa1 (RSC marker, red) to show marker expression change in ApcMin and Lgr5DTR;ApcMin polyps before and after CBC ablation. Scale bars, 100 μm.
Figure 6
Figure 6
Human translational implications (A) Forest plots of progression-free survival (PFS) Hazard Ratios (HRs) (TCGA-COADREAD) and disease-free survival (DFS) HRs (Jorissen et al., 2009; Marisa et al., 2013) for quintiles of tumor stem cell index. Data are presented as HR with error bars indicating the 95% confidence interval (CI). p values from a Cox proportional hazards regression are shown. (B) FOxTROT (track A) trial schedule showing specimen acquisition before (specimen 1) and after 6 weeks (specimen 2) of 5-FU and oxaliplatin chemotherapy. (C) Ladder plots showing GSVA (RSC-CBC signature) of human tumor samples before and after chemotherapy, with patients grouped as “static” or “plastic” depending on magnitude of signature change following therapy. (D) No change in cell proliferation score in groups of tumors segregated by post treatment shift in stem cell index. (E) Proportion of patients with a documented response to chemotherapy in the FOxTROT trial when grouped by static or plastic stem cell response to treatment. Statistical analysis, Fisher’s exact test, p value as stated. (F) Low within-subject variation of the stem cell index from random non-adjacent biopsies from the BOSS trial.
Figure 7
Figure 7
Fitness landscape model Tumor stem cell phenotype can be represented as a fitness landscape model, where Lgr5+ve CBC and Lgr5−ve RSC represent distinct but interlinked fitness peaks situated along a phenotypic axis. (A) Epithelial cells “climb” these fitness peaks (arrows) through the combination of acquired epithelial mutations and the influence of microenvironmental signaling, placing them at distinct points within the fitness landscape. Bulk transcriptome data can be used to calculate the stem cell index, which reflects stem cell population admixture and can be used as a measure of individual tumor position within this phenotypic axis (boxes). (B) Application of a selective pressure to a fitness peak (e.g Lgr5+ CBC ablation) alters the morphogenic signaling landscape and shifts the stem cell equilibrium toward an alternative phenotype at day 1. Rapid regeneration of the lost CBC population restores the stem cell equilibrium after 5 days. These dynamic shifts can be measured by change in the stem cell index (boxes). Key: green dots, CBC cells; red dots, RSC cells; yellow dots, both marker-expressing cells; gray dots, no stem cell-marker-expressing cells.

References

    1. Alderdice M., Richman S.D., Gollins S., Stewart J.P., Hurt C., Adams R., McCorry A.M., Roddy A.C., Vimalachandran D., Isella C., et al. Prospective patient stratification into robust cancer-cell intrinsic subtypes from colorectal cancer biopsies. J. Pathol. 2018;245:19–28. doi: 10.1002/path.5051. - DOI - PMC - PubMed
    1. Aran D., Looney A.P., Liu L., Wu E., Fong V., Hsu A., Chak S., Naikawadi R.P., Wolters P.J., Abate A.R., et al. Reference-based analysis of lung single-cell sequencing reveals a transitional profibrotic macrophage. Nat. Immunol. 2019;20:163–172. doi: 10.1038/s41590-018-0276-y. - DOI - PMC - PubMed
    1. Ayers M., Lunceford J., Nebozhyn M., Murphy E., Loboda A., Kaufman D.R., Albright A., Cheng J.D., Kang S.P., Shankaran V., et al. IFN-γ-related mRNA profile predicts clinical response to PD-1 blockade. J. Clin. Invest. 2017;127:2930–2940. doi: 10.1172/jci91190. - DOI - PMC - PubMed
    1. Ayyaz A., Kumar S., Sangiorgi B., Ghoshal B., Gosio J., Ouladan S., Fink M., Barutcu S., Trcka D., Shen J., et al. Single-cell transcriptomes of the regenerating intestine reveal a revival stem cell. Nature. 2019;569:121–125. doi: 10.1038/s41586-019-1154-y. - DOI - PubMed
    1. Bankhead P., Loughrey M.B., Fernández J.A., Dombrowski Y., McArt D.G., Dunne P.D., McQuaid S., Gray R.T., Murray L.J., Coleman H.G., et al. QuPath: Open source software for digital pathology image analysis. Sci. Rep. 2017;7:16878. doi: 10.1038/s41598-017-17204-5. - DOI - PMC - PubMed

Publication types

Substances

LinkOut - more resources