. 2022 Aug 4;29(8):1246-1261.e6.
doi: 10.1016/j.stem.2022.06.013.

Lymphatics and fibroblasts support intestinal stem cells in homeostasis and injury

Affiliations

Lymphatics and fibroblasts support intestinal stem cells in homeostasis and injury

Norihiro Goto et al. Cell Stem Cell. .

Abstract

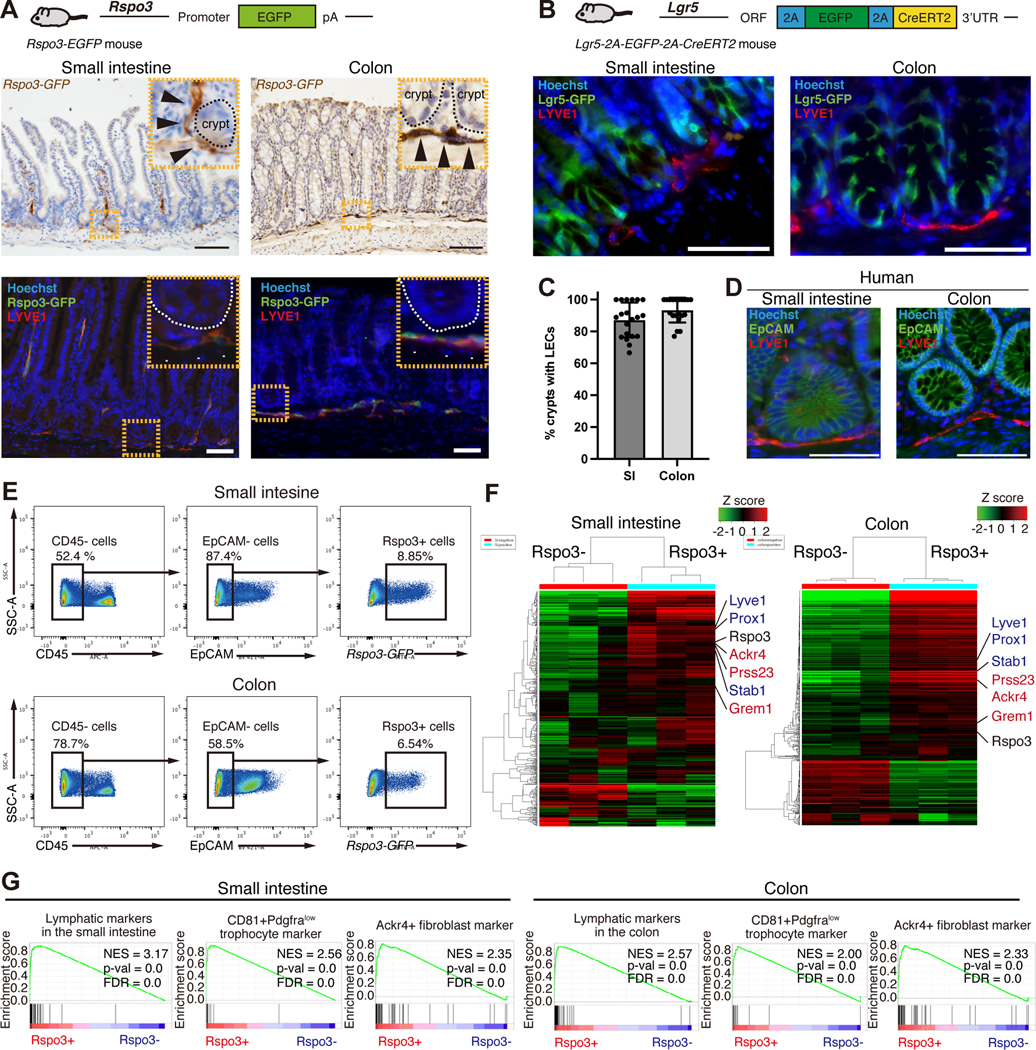
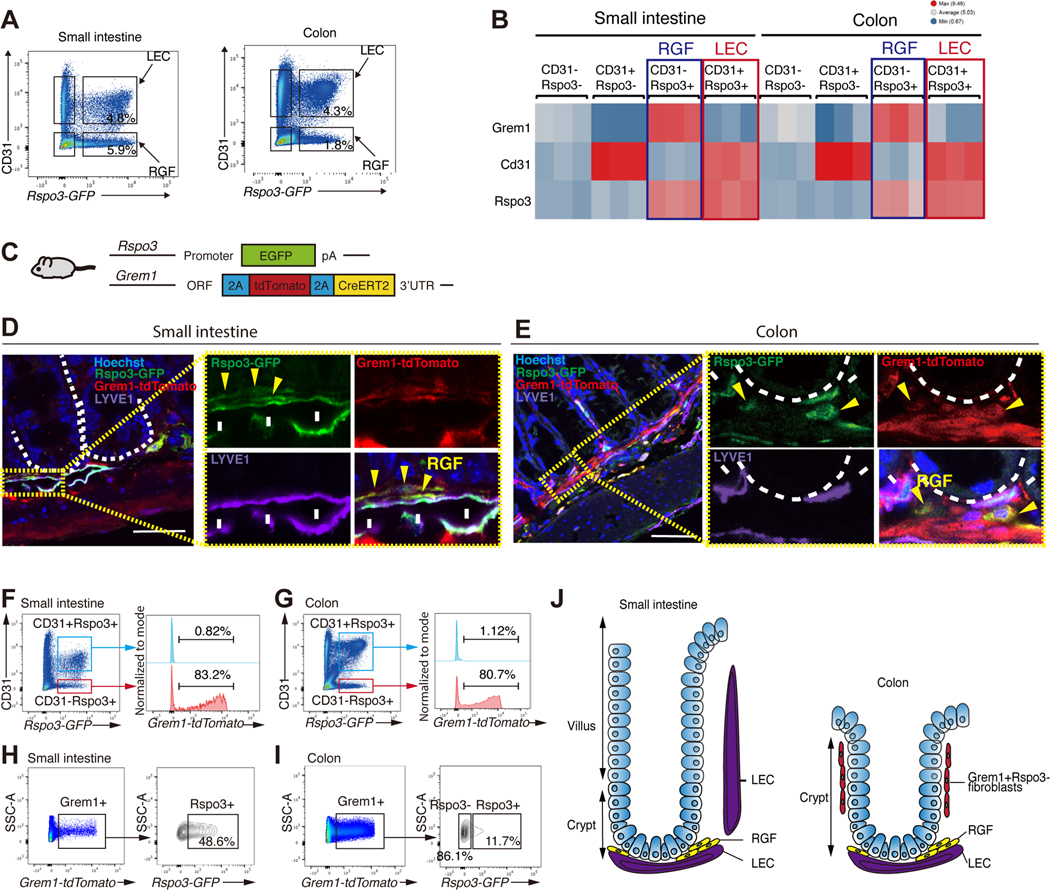
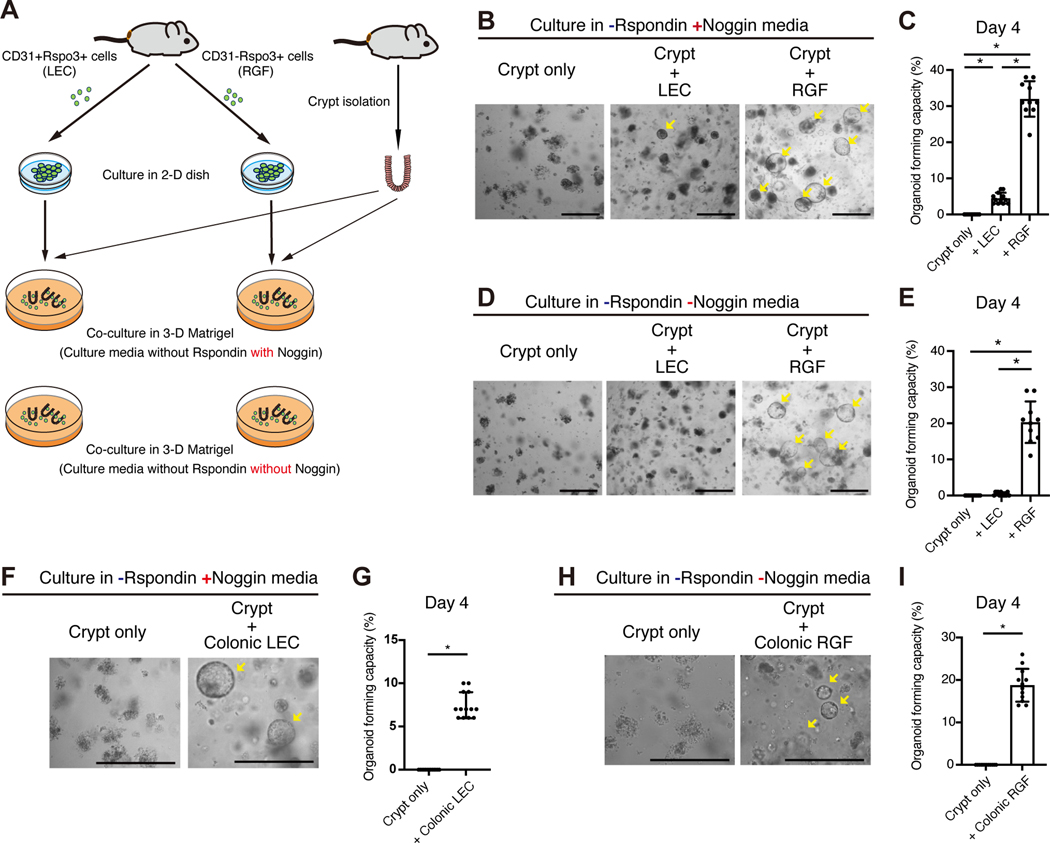
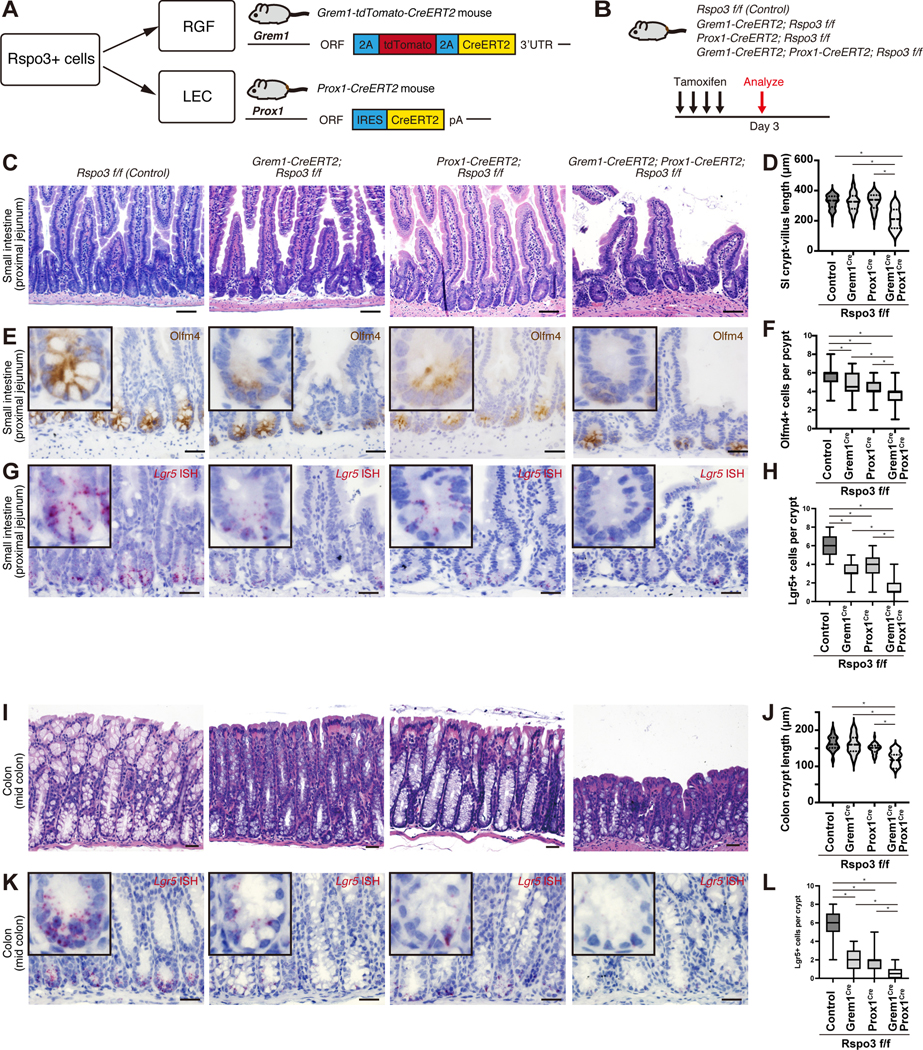
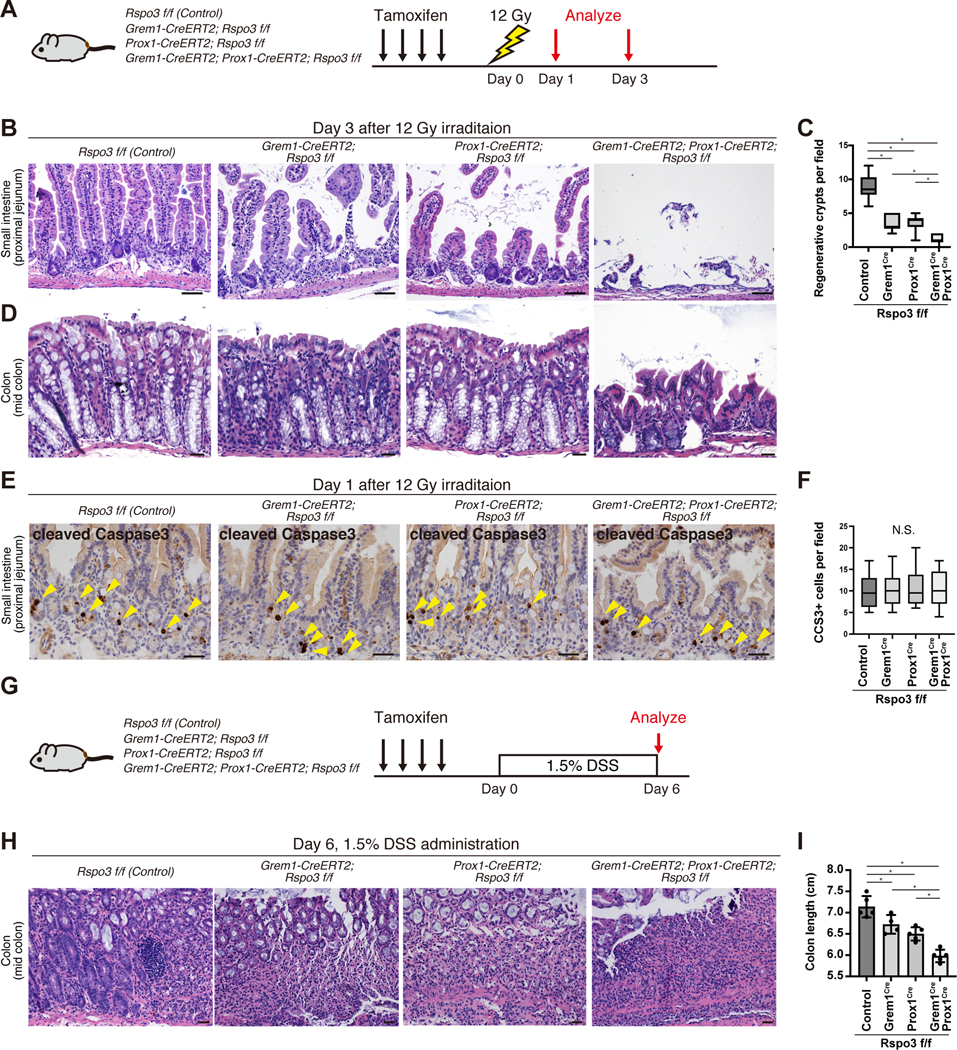
Lgr5+ intestinal stem cells (ISCs) depend on niche factors for their proper function. However, the source of these ISC niche factors and how they support ISCs in vivo remain controversial. Here, we report that ISCs depend on lymphatic endothelial cells (LECs) and RSPO3+GREM1+ fibroblasts (RGFs). In the intestine and colon, LECs are surrounded by RGFs and are located near ISCs at the crypt base. Both LECs and RGFs provide the critical ISC niche factor RSPO3 to support ISCs, where RSPO3 loss in both cell types drastically compromises ISC numbers, villi length, and repair after injury. In response to injury, LEC and RGF numbers expand and produce greater amounts of RSPO3 and other growth/angiocrine factors to foster intestinal repair. We propose that LECs represent a novel niche component for ISCs, which together with RGFs serve as the major in vivo RSPO3 source for ISCs in homeostasis and injury-mediated regeneration.

Keywords: Lgr5; RSPO3; fibroblast; intestinal stem cell; lymphatic endothelial cell.


Conflict of interest statement

Declaration of interests Ö.H.Y. holds equity and is an SAB member in Ava Lifesciences. Ö.H.Y. receives research support from Microbial Machines.

Figures

Figure 1.
Figure 1.. RSPO3+ LECs reside close to Lgr5+ ISCs
(A) Schematic of Rspo3GFP mice (top). Rspo3GFP expression by immunohistochemistry in the small and colon (middle). Black arrowheads indicate endothelial structures in close proximity to the crypt. Rspo3GFP is expressed by LYVE1+ LECs (bottom). White arrowheads indicate the co-expression of Rspo3GFP and LYVE1. (B) Schematic (top) of Lgr5–2A-GFP-2A-CreERT2 mice. IF shows the presence of LYVE1+ LECs residing near Lgr5+ ISCs in the small intestine and colon. (C) The percentage of the crypts with adjacent LYVE1+ LECs in the small intestine and colon. n = 20 from 6 mice per group. (D) IF for LYVE1 and EpCAM in the human small intestine and colon. (E) CD45-/EpCAM-/Rspo3GFP+ cells from the small intestinal and colonic stromal cells of Rspo3GFP mice by flow cytometry. (F) The heatmap of RNA-seq of sorted CD45/EpCAM/Rspo3GFP− and CD45/EpCAM/Rspo3GFP+ cells in the small intestine and colon. n = 3 mice per group. (G) GSEA of lymphatic markers, CD81+Pdgfralow trophocyte markers, and Ackr4+ fibroblast markers. FDR, false-discovery rate; NES, normalized enrichment score. Scale bar, 50 μm (A, B, D). Data are mean ± SD. See also Figure S1.
Figure 2.
Figure 2.. scRNA-seq of RSPO3+ cells in the small intestine and colon
(A) UMAP of scRNA-seq of small intestinal Rspo3GFP+ cells (3,774 cells from 2 mice). (B) Relative expression of Rspo3, LEC marker genes, and Grem1+ fibroblast marker genes, and telocyte marker genes projected onto the UMAP plot. (C) RGF 1 clusters are CD81+Adamdec1− whereas RGF 2 cluster is Cd81−Adamdec1+. (D) Dot plots of expression patterns of ISC niche factors in LEC and RGF subclusters. (E) UMAP of scRNA-seq of colonic Rspo3GFP+ cells (7,901 cells from 2 mice). (F) Relative expression of Rspo3, LEC marker genes, and Grem1+ fibroblast marker genes onto the UMAP plot. (G) RGF 1 cluster is CD81+Adamdec1− whereas RGF 2 cluster is Cd81−Adamdec1+. (H) Dot plots of expression patterns of ISC niche factors in LEC and RGF subclusters. See also Figures S1 and S2.
Figure 3.
Figure 3.. LECs and RGFs are the major cellular sources of mucosal RSPO3
(A) Flow cytometry of EpCAM-CD45- stromal cells using Rspo3GFP and CD31 in the small intestine and colon. (B) The heatmap of RNA-seq on CD31−Rspo3GFP−, CD31+Rspo3GFP−, CD31−Rspo3GFP+, and CD31+Rspo3GFP+ cells in the small intestine and colon. n = 3 mice per group. (C) Schematic of Rspo3GFP; Grem1-tdTomato mouse. (D-E) Confocal microscopy images of IF for Rspo3GFP, Grem1-tdTomato, and LYVE1 in the small intestine (D) and colon (E). Yellow arrowheads indicate RGFs. White arrows indicate LECs. (F-I) Flow cytometry of EpCAM0CD45 stromal cells in the small intestine and colon of Rspo3GFP; Grem1-tdTomato mice. (J) Schematic of RSPO3 and/or GREM1 positive cells in the small intestine and colon. Scale bar, 10 μm (D) and 50 μm (E). See also Figures S3 and S4.
Figure 4.
Figure 4.. LECs and RGFs support ISCs in vitro
(A) Schematic of heterotypic co-culture assay. (B-C) Representative images (B) and quantification (C) of co-culture of small intestinal LECs or RGFs with the crypts in the culture media supplemented with Noggin, but not with RSPO. n = 10 – 12 from 3 mice per group. (D-E) Representative images (D) and quantification (E) of co-culture of small intestinal LECs or RGFs with the crypts in the culture media without Noggin and RSPO. n = 10 – 12 from 3 mice per group. (F-G) Representative images (F) and quantification (G) of co-culture of colonic LECs with the crypts in the culture media supplemented with Noggin, but not with RSPO. n = 13 from 3 mice per group. (H-I) Representative images (H) and quantification (l) of co-culture of colonic RGFs with the crypts in the culture media without Noggin and RSPO. n = 12 from 3 mice per group. One-way ANOVA (C, E). Unpaired two-tailed t-tests (G, I). Data are mean ± SD. *p < 0.05. Scale bar, 20 μm (B, D, F, H). Arrows indicate organoid formation. See also Figure S4.
Figure 5.
Figure 5.. LECs and RGFs support ISCs in vivo
(A) Schematic of the Cre mouse models to target RSPO3+ cells. (B) Schematic of the mouse models of RSPO3 loss in LECs, RGFs, or both. (C-L) H&E staining of the small intestine (C) and colon (I); immunohistochemistry for Olfm4 in the small intestine (E); Lgr5 mRNA expression in the small intestine (G) and colon (K) by ISH after inducing RSPO3 loss in LECs, RGFs, or both. Quantification of the crypt- villus length in the proximal jejunum of the small intestine (D) (n = 100 crypt-villi from 6 mice per group); Olfm4+ cells in the proximal jejunum of the small intestine (F) (n = 60 crypts from 6 mice per group); Lgr5+ cells in the proximal jejunum of the small intestine (H) (n = 50 crypts from 6 mice per group); crypt length in the mid colon (J) (n = 40 crypts from 6 mice); Lgr5+ cells in the mid colon (L) (n = 50 crypts from 6 mice per group) after inducing RSPO3 loss in LECs, RGFs, or both. One-way ANOVA (D, F, H, J, L). For box-and-whisker plots (F, H, L), data were expressed as box-and- whisker from the minimum to the maximum. *p < 0.05. Scale bar, 20 μm (C, E, G, I, K).See also Figure S5.
Figure 6.
Figure 6.. LECs and RGFs support post-injury regeneration in vivo
(A) Schematic of irradiation experiments. (B-D) H&E staining of the small intestine (B) and colon (D) and quantification of regenerative crypts in the proximal jejunum (C) (n = 10 fields from 6 mice per group) day 3 post-irradiation following RSPO3 loss in LECs, RGFs, or both. (E-F) immunohistochemistry for CCS3 in the small intestine (E) and quantification of CCS3+ cells (F) day 1 post-irradiation following RSPO3 loss in LECs, RGFs, or both (n = 20 fields from 3 mice per group). (G-I) Schematic of DSS-induced colitis experiments (G). H&E staining of the colon (H) and the colon length (I) at day 6 (n= 4 – 5 mice per group). One-way ANOVA (C, F, I). For box-and-whisker plots (C, F), data were expressed as box-and-whisker from the minimum to the maximum. *p < 0.05. N.S. not significant. Scale bar, 20 μm (B, D, E, H).
Figure 7.
Figure 7.. LECs and RGFs expand to facilitate epithelial regeneration after irradiation induced damage
(A) IF for LYVE1 in the small intestine post-irradiation. (B-C) Flow cytometry (B) and quantification (C) of LECs and RGFs from the small intestinal EpCAM-CD45- stromal cells. n = 5 mice per group. (D) Confocal microscopy of IF for Rspo3GFP, Grem1-tdTomato, and LYVE1 in the small intestine of Rspo3GFP; Grem1-tdTomato mouse day 3 post-irradiation. Yellow arrowheads indicate expanded RGFs. White arrows indicate LECs. (E) UMAP of scRNA-seq of small intestinal Rspo3GFP+ cells 3 days post-irradiation (Control: 6,171 cells from 2 mice, irradiation: 11,706 cells from 2 mice). (F) Violin plots for Rspo3 expression. (G) Violin plots for Il1r1 expression. (H) GSEA of IL-1-mediated signaling pathway genes. (I-J) Schematic for IL-1a treatment of cultured RGFs (I). qRT-PCR of Rspo3 mRNA expression in RGFs (J). n = 3 mice per group. (K-M) Schematic of co-culture experiments of IL-1a- pretreated RGFs and crypts (K). Representative images (L) and quantification of organoid forming capacity (M) in the co-culture. n = 12 from 3 mice per group. (N) Model of how LECs and RGFs support ISCs in homeostasis and injury. Unpaired two-tailed t-tests (C, J, M). Wilcox test (F, G). Data are mean ± SD. *p < 0.05. Scale bar, 50 μm (A) and 20 μm (D, L). Arrows indicate organoid formation. See also Figure S7.

Comment in

References

    1. Barbie DA, Tamayo P, Boehm JS, Kim SY, Moody SE, Dunn IF, Schinzel AC, Sandy P, Meylan E, Scholl C, et al. (2009). Systematic RNA interference reveals that oncogenic KRAS-driven cancers require TBK1. Nature 462, 108–112. - PMC - PubMed
    1. Barker N, van Es JH, Kuipers J, Kujala P, van den Born M, Cozijnsen M, Haegebarth A, Korving J, Begthel H, Peters PJ, et al. (2007). Identification of stem cells in small intestine and colon by marker gene Lgr5. Nature 449, 1003–1007. - PubMed
    1. Beyaz S, Mana MD, Roper J, Kedrin D, Saadatpour A, Hong SJ, Bauer-Rowe KE, Xifaras ME, Akkad A, Arias E, et al. (2016). High-fat diet enhances stemness and tumorigenicity of intestinal progenitors. Nature 531, 53–58. - PMC - PubMed
    1. Bjorndahl M, Cao R, Nissen LJ, Clasper S, Johnson LA, Xue Y, Zhou Z, Jackson D, Hansen AJ, and Cao Y. (2005). Insulin-like growth factors 1 and 2 induce lymphangiogenesis in vivo. Proc Natl Acad Sci U S A 102, 15593–15598. - PMC - PubMed
    1. Brugger MD, Valenta T, Fazilaty H, Hausmann G, and Basler K. (2020). Distinct populations of crypt- associated fibroblasts act as signaling hubs to control colon homeostasis. PLoS Biol 18, e3001032. - PMC - PubMed

Publication types