. 2022 Sep 13;17(9):2005-2022.
doi: 10.1016/j.stemcr.2022.07.003. Epub 2022 Aug 4.

Dual inhibition of MAPK and PI3K/AKT pathways enhances maturation of human iPSC-derived cardiomyocytes

Affiliations

Dual inhibition of MAPK and PI3K/AKT pathways enhances maturation of human iPSC-derived cardiomyocytes

Bayardo I Garay et al. Stem Cell Reports. .

Erratum in

Abstract

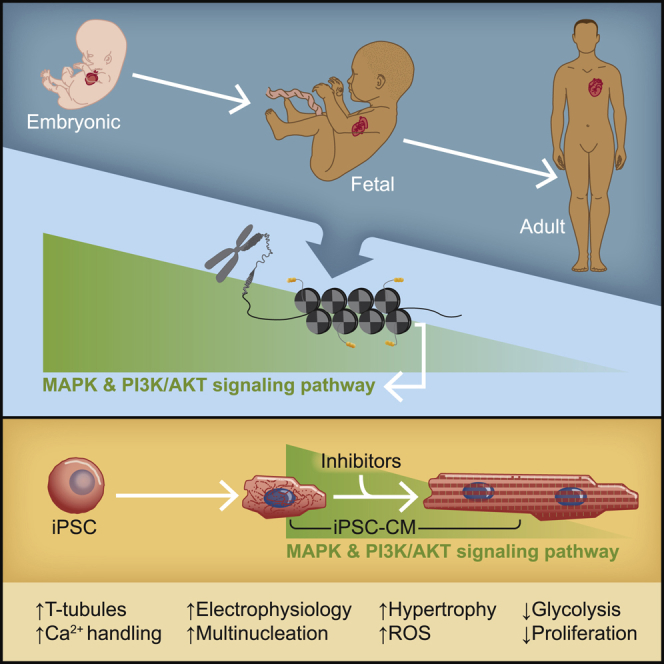
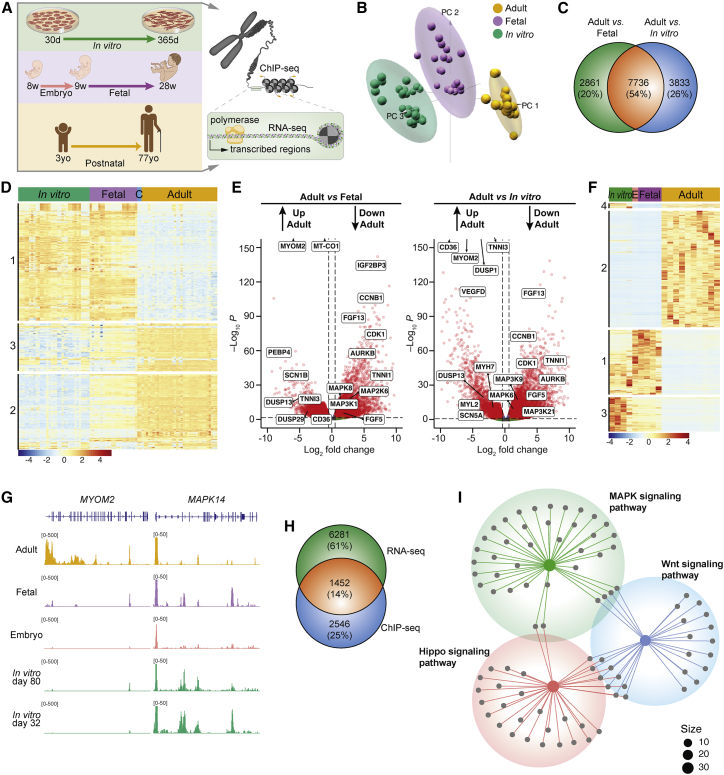
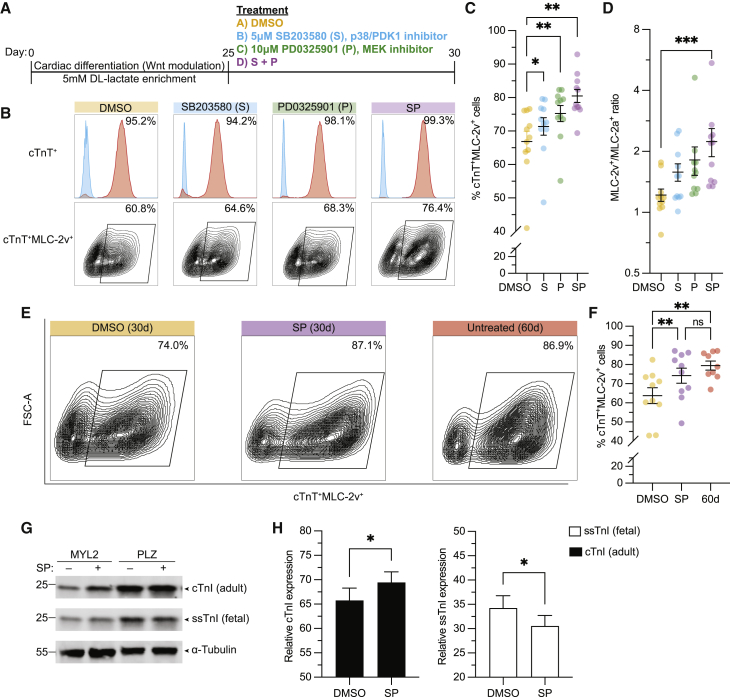
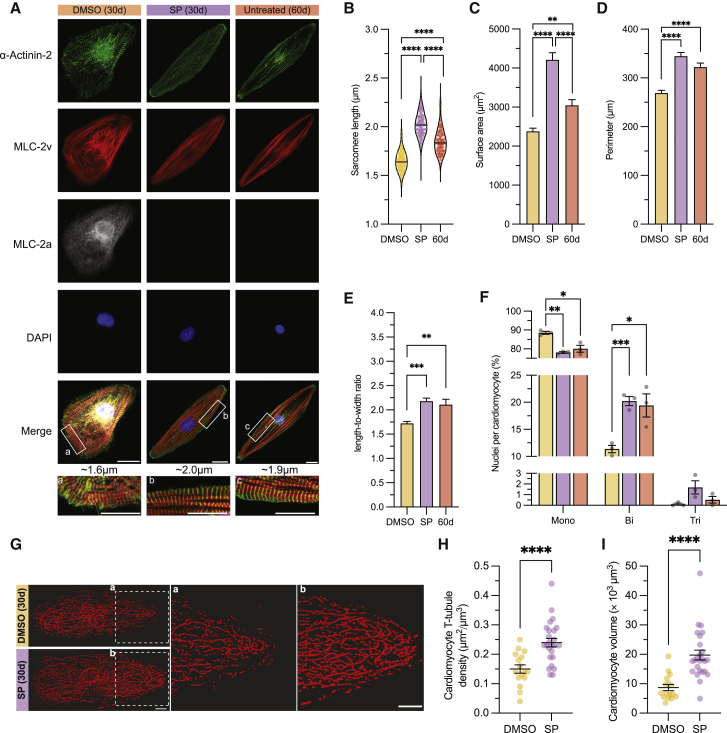
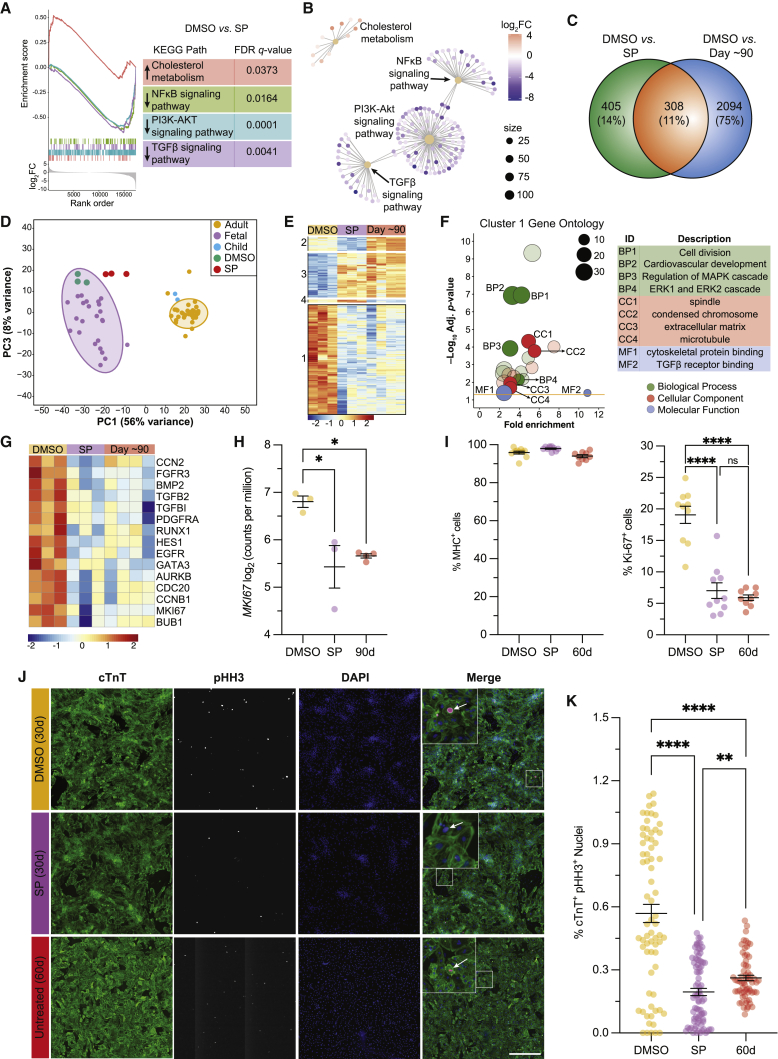
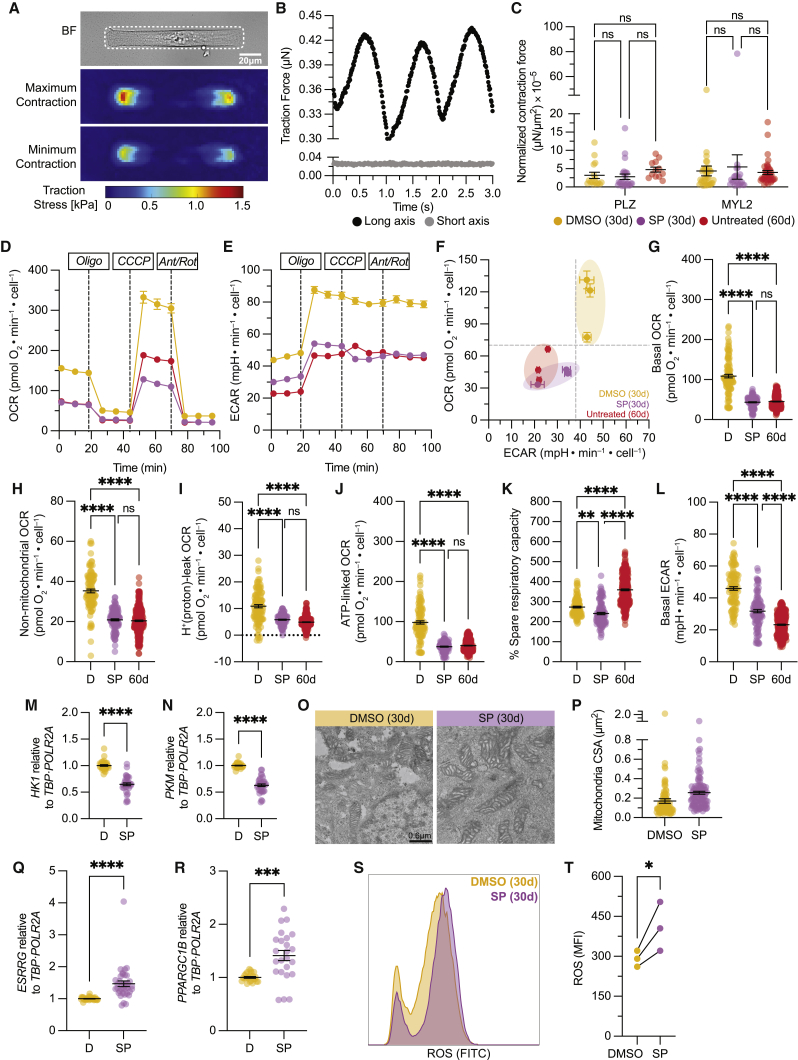
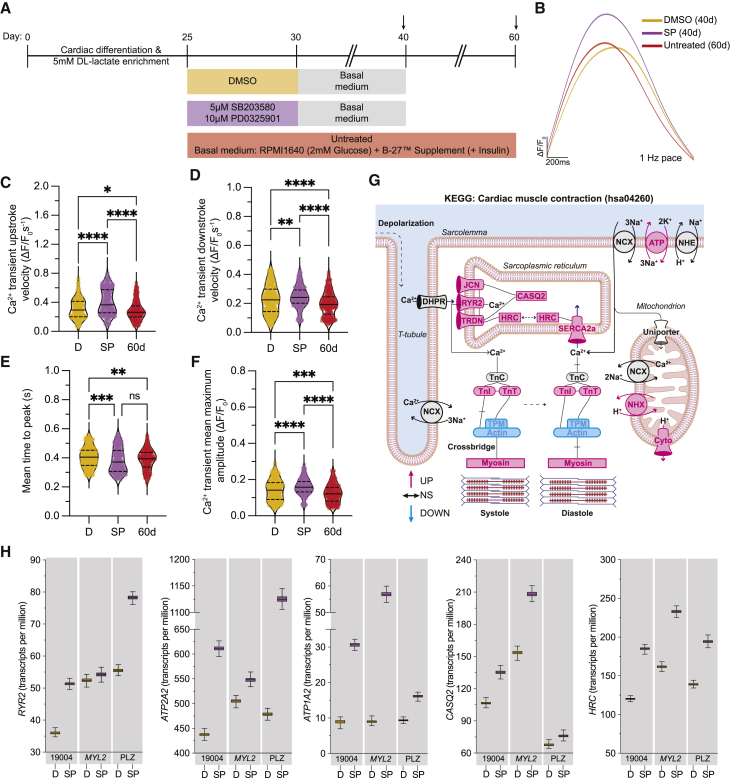
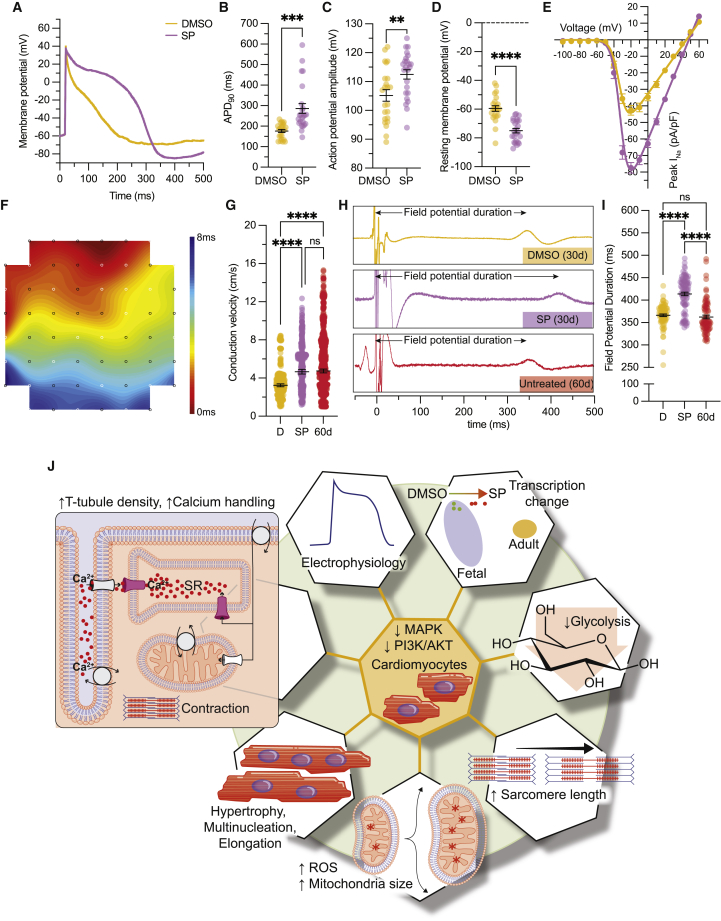
Human induced pluripotent stem cell-derived cardiomyocytes (hiPSC-CMs) provide great opportunities for mechanistic dissection of human cardiac pathophysiology; however, hiPSC-CMs remain immature relative to the adult heart. To identify novel signaling pathways driving the maturation process during heart development, we analyzed published transcriptional and epigenetic datasets from hiPSC-CMs and prenatal and postnatal human hearts. These analyses revealed that several components of the MAPK and PI3K-AKT pathways are downregulated in the postnatal heart. Here, we show that dual inhibition of these pathways for only 5 days significantly enhances the maturation of day 30 hiPSC-CMs in many domains: hypertrophy, multinucleation, metabolism, T-tubule density, calcium handling, and electrophysiology, many equivalent to day 60 hiPSC-CMs. These data indicate that the MAPK/PI3K/AKT pathways are involved in cardiomyocyte maturation and provide proof of concept for the manipulation of key signaling pathways for optimal hiPSC-CM maturation, a critical aspect of faithful in vitro modeling of cardiac pathologies and subsequent drug discovery.

Keywords: MAPK; PI3K-AKT; calcium handling; cardiomyocyte; electrophysiology; inhibitors; maturation; multinucleation; pluripotent stem cells.


Conflict of interest statement

Conflicts of interest The authors declare no competing interests.

Figures

None
Graphical abstract
Figure 1
Figure 1
Signaling pathways downregulated in the postnatal heart (A) Scheme for comparative analyses of RNA-seq and H3K27ac ChIP-seq. (B) Principal-component analysis for adult (orange), fetal (purple), and in vitro (green) samples. (C) Venn diagram of RNA-seq pairwise comparisons showing DEGs. (D) RNA-seq hierarchical clustering of the top 1,000 DEGs shared among all samples. Clusters are indicated on left margin. C, 3-year-old child. (E) Volcano plot for coding genes. (F) ChIP-seq hierarchical clustering for 25,149 loci with differential H3K27ac deposition. Clusters are indicated on left margin. E, embryo (CS22). (G) ChIP-seq tracks for M protein (MYOM2, cluster 2) and p38α (MAPK14, cluster 3) in pooled biological replicates. (H) Venn diagram for DEGs shared among ChIP-seq, clusters 1 and 3, and RNA-seq. (I) Gene-network plot of KEGG pathway enrichment analysis of the most downregulated genes in the adult heart, with cluster size scale at the bottom right.
Figure 2
Figure 2
Inhibition of MAPK/PI3K/AKT improves the expression of adult isoform sarcomeric proteins in day 30 hiPSC-CMs to day 60 levels (A) Scheme for ventricular CM differentiation and treatment with MAPK/PI3K/AKT inhibitors. (B) Representative flow cytometry plots of day 30 hiPSC-CMs show cTnT+ (upper panel) and the cTnT+ MLC-2v+ (lower panel) population. (C) Bar graph shows summary of fluorescence-activated cell sorting (FACS) analysis for cTnT+MLC-2v+ hiPSC-CMs per treatment at day 30. (D) Graph shows MLC-2v+/MLC-2a+ ratio by FACS on day 30 hiPSC-CMs. (E) Representative FACS plot for cTnT+MLC-2v+ expression per condition. (F) Bar graph shows the frequency of cTnT+MLC-2v+ in day 30 hiPSC-CMs treated with SP or DMSO, compared with untreated day 60 CMs as a reference. (G and H) Western blot for cTnI, ssTnI, and α-tubulin (G) and (H) quantification of stoichiometric relationship in day 30 DMSO- or SP-treated hiPSC-CMs. Data are presented as mean ± SEM. For (C) and (D), n = 3 (PLZ/19004) or 5 (MYL2) independent experiments per condition using all 3 cell lines; for (F), n = 3 independent experiments per condition using all 3 cell lines; for (G), n = 3 (PLZ/MYL2) independent experiments per condition. ns, p > 0.05; p < 0.05, ∗∗p < 0.01, and ∗∗∗p < 0.001.
Figure 3
Figure 3
Morphological improvements in day 30 hiPSC-CMs upon MAPK/PI3K/AKT inhibition (A) Representative IF images for α-actinin-2, MLC-2v, MLC-2a, DAPI, and merge for DMSO- and SP-treated day 30 hiPSC-CMs as well as untreated day 60 CMs. Inset indicates representative mean for SL. Scale bar, 20 μm. (B) Violin plot of SL with mean values represented by black line. (C–F) Bar graphs show quantification data for cell surface area (C), cell perimeter (D), length-to-width ratio (E), and nucleation levels (F). (G) Representative 3D volume rendering of T-tubules in day 30 DMSO- and SP-treated hiPSC-CMs. (H and I) Quantification of T-tubule density (H) and (I) CM volume. Data are presented as mean ± SEM of 3 independent experiments using all three cell lines (PLZ/19004/MYL2). For (G–I), n = 4–10 cells per experiment, 3 independent experiments in MYL2 line. p < 0.05, ∗∗p < 0.01, ∗∗∗p < 0.001, and ∗∗∗∗p < 0.0001.
Figure 4
Figure 4
Transcriptional signatures of hiPSC-CMs upon MAPK/PI3K/AKT inhibition (A) GSE analysis with upregulated and downregulated KEGG pathways (arrows). (B) Gene-network plot for differentially expressed KEGG pathways. (C) Venn diagram of pairwise comparison DEGs. (D) Principal-component analysis of adult, 3-year-old child, fetal, and day 30 DMSO- and SP-treated hiPSC-CMs with 95% confidence interval. (E) Hierarchical clustering of 308 shared DEGs; clusters on left margin. (F) Cluster 1 GO analysis. (G) Hierarchical clustering of selected genes annotated to cell division/proliferation biological processes. (H) Bar plot with log-transformed counts per million values for MKI67, each dot is an independent cell line. (I) Summary of myosin heavy chain (MHC+) and Ki-67+ FACS data; n = 3 independent experiments per condition for each cell line (PLZ/19004/MYL2). (J) Representative IF images of cTnT and phospho-histone H3 (pHH3) staining. Scale bar, 500 μm. (K) Summary dot-plot quantification of cTnT+ pHH3+ nuclei. n = 30 technical replicates, 4 independent experiments per condition from a representative cell line (PLZ). Data are presented as mean ± SEM; n = 1–3 independent experiments per cell line unless specified. p < 0.05, ∗∗p < 0.01, ∗∗∗p < 0.001, and ∗∗∗∗p < 0.0001.
Figure 5
Figure 5
Traction force profile and metabolic shift upon MAPK/PI3K/AKT inhibition (A) Bright-field image of micropatterned hiPSC-CM (cell outlined by a white dashed line) and heatmaps of the cell-induced substrate surface tractions. (B) Total traction force exerted by the representative CM in the direction of its long and short axes over 3 s. (C) Normalized contraction force in day 30 DMSO- and SP-treated groups compared with day 60 untreated CMs. (D–F) Mean kinetic profile of OCR and ECAR from day 30 DMSO- and SP-treated and day 60 untreated hiPSC-CMs. (G–L) Dot-plot quantification of (G) basal, (H) non-mitochondrial, (I) proton leak, (J) ATP-linked, (K) percentage spare capacity OCR, and (L) basal ECAR. (M and N) Normalized gene expression of (M) HK1 and (N) PKM. (O) Representative transmission electron micrograph of mitochondria on hiPSC-CMs; scale bar, 0.6 μm. (P) Quantification of mitochondrial cross-sectional area. (Q and R) Normalized gene expression of (Q) ESRRG and (R) PPARGC1B. (S and T) Representative FACS plot for ROS measurement (S) and (T) quantification of mean fluorescence intensity (MFI). Data are presented as mean ± SEM. For (C), n = 6–14 cells per experiment, 3 independent experiments in PLZ/MYL2; for (D)–(L), n = 8–48 technical replicates per experiment per condition per line, 3 independent experiments in PLZ/19004/MYL2; for (M), (N), (Q), and (R), n = 3 independent experiments per condition in PLZ/19004/MYL2; for (P), n = 20–40 mitochondria per cell, 4 or 5 cells per condition, 1 independent experiment in MYL2; for (T), n = 3 independent experiments in PLZ. p < 0.05, ∗∗p < 0.01, ∗∗∗p < 0.001, and ∗∗∗∗p < 0.0001.
Figure 6
Figure 6
Calcium handling profile upon MAPK/PI3K/AKT inhibition (A) Scheme for maintenance and treatment of hiPSC-CMs with SP; arrows indicate when Ca2+ handling was measured. (B) Representative averaged Ca2+ transient of day 40 DMSO control and SP treatment relative to day 60 untreated CMs with 95% confidence interval, paced at 1 Hz. (C–F) Violin plots show Ca2+ transient upstroke velocity (C), Ca2+ transient downstroke velocity (D), mean time to peak (E), and Ca2+ transient mean maximum amplitude (F). n = 4 technical replicates per condition, 3 independent experiments in PLZ/19004/MYL2. Data presented as mean (solid line) and quartiles (dashed line). (G) Rendering of KEGG cardiac muscle contraction pathway (hsa04260) with DEGs color-coded for upregulation (pink), downregulated (blue), or no significant change (black). (H) Whisker plots of transcript-level expression of Ca2+-handling genes involved in cardiac muscle contraction. Error bars show the normalized bootstraps across all samples (n = 1,000). p < 0.05, ∗∗p < 0.01, ∗∗∗p < 0.001, and ∗∗∗∗p < 0.0001.
Figure 7
Figure 7
Electrophysiological properties of hiPSC-CMs upon MAPK/PI3K/AKT inhibition (A) Representative AP trace of DMSO- and SP-treated hiPSC-CMs on day 31. (B–D) Dot-plot quantification of (B) APD90, (C) AP amplitude, and (D) resting membrane potential. (E) Current-voltage plot of INa. (F) Representative propagation map. (G) Dot-plot quantification of conduction velocity in DMSO- and SP-treated hiPSC-CMs on day 31 compared with day 60 untreated CMs. (H) Averaged field potential trace of day 31 DMSO- or SP-treated hiPSC-CMs along with day 60 untreated CMs. n = 300 beats per condition. (I) Dot-plot quantification of FPD. (J) Graphical summary of changes observed upon MAPK/PI3K/AKT inhibition. Data are presented as mean ± SEM. For (B)–(E), n = 23–24 cells from 2 independent experiments in PLZ. For (F)–(I), n = 40-59 electrodes per experiment, 2 (DMSO/SP) or 4 (day 60) independent experiments (PLZ/MYL2). ns, p > 0.05; ∗∗p < 0.01, ∗∗∗p < 0.001, and ∗∗∗∗p < 0.0001.

References

    1. Allen L.F., Sebolt-Leopold J., Meyer M.B. CI-1040 (PD184352), a targeted signal transduction inhibitor of MEK (MAPKK) Semin. Oncol. 2003;30:105–116. doi: 10.1053/j.seminoncol.2003.08.012. - DOI - PubMed
    1. Bedada F.B., Chan S.S.K., Metzger S.K., Zhang L., Zhang J., Garry D.J., Kamp T.J., Kyba M., Metzger J.M. Acquisition of a quantitative, stoichiometrically conserved ratiometric marker of maturation status in stem cell-derived cardiac myocytes. Stem Cell Rep. 2014;3:594–605. doi: 10.1016/j.stemcr.2014.07.012. - DOI - PMC - PubMed
    1. Bergmann O., Zdunek S., Felker A., Salehpour M., Alkass K., Bernard S., Sjostrom S.L., Szewczykowska M., Jackowska T., Dos Remedios C., et al. Dynamics of cell generation and turnover in the human heart. Cell. 2015;161:1566–1575. doi: 10.1016/j.cell.2015.05.026. - DOI - PubMed
    1. Burridge P.W., Matsa E., Shukla P., Lin Z.C., Churko J.M., Ebert A.D., Lan F., Diecke S., Huber B., Mordwinkin N.M., et al. Chemically defined generation of human cardiomyocytes. Nat. Methods. 2014;11:855–860. doi: 10.1038/nmeth.2999. - DOI - PMC - PubMed
    1. Chan Y.C., Ting S., Lee Y.K., Ng K.M., Zhang J., Chen Z., Siu C.W., Oh S.K.W., Tse H.F. Electrical stimulation promotes maturation of cardiomyocytes derived from human embryonic stem cells. J. Cardiovasc. Transl. Res. 2013;6:989–999. doi: 10.1007/s12265-013-9510-z. - DOI - PubMed

Publication types

MeSH terms

Substances