. 2022 Aug 9;55(8):1386-1401.e10.
doi: 10.1016/j.immuni.2022.06.022. Epub 2022 Aug 4.

DNA methyltransferase 3 alpha and TET methylcytosine dioxygenase 2 restrain mitochondrial DNA-mediated interferon signaling in macrophages

Affiliations

DNA methyltransferase 3 alpha and TET methylcytosine dioxygenase 2 restrain mitochondrial DNA-mediated interferon signaling in macrophages

Isidoro Cobo et al. Immunity. .

Abstract

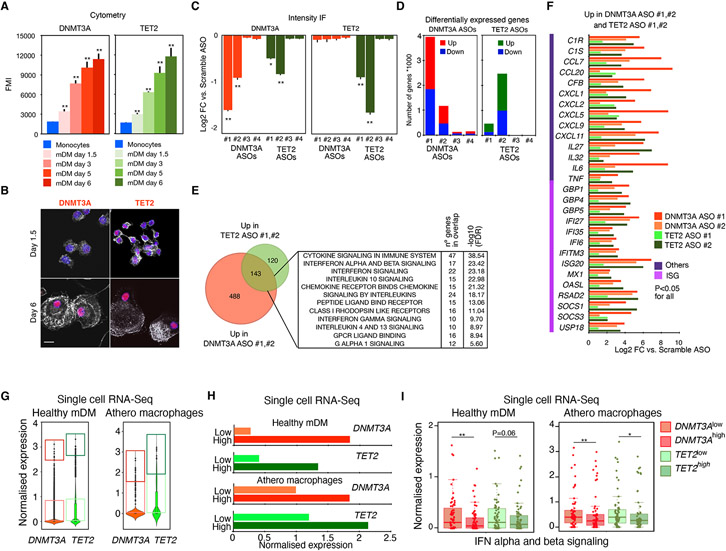
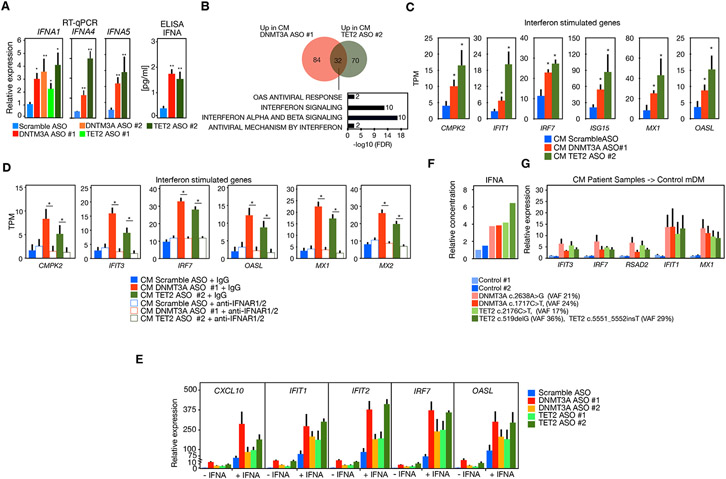
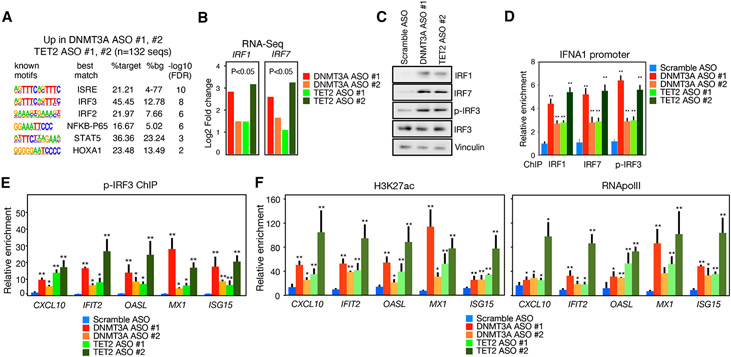
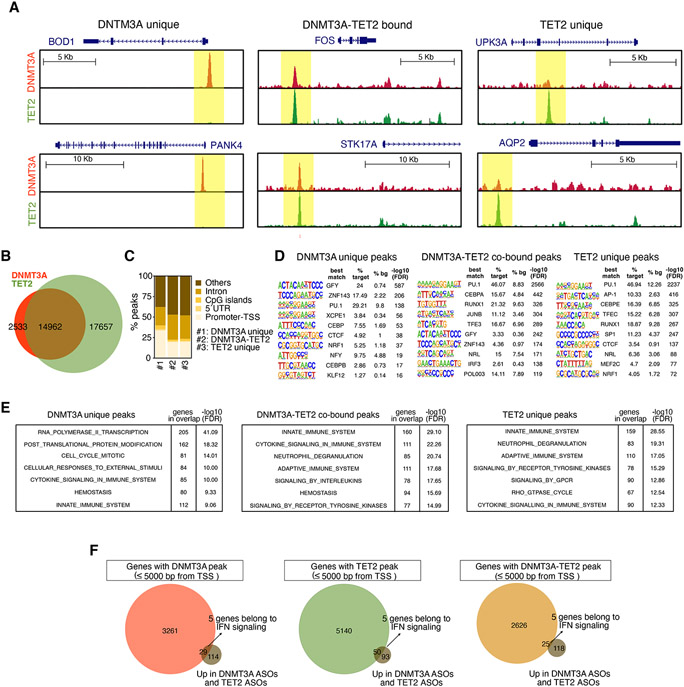
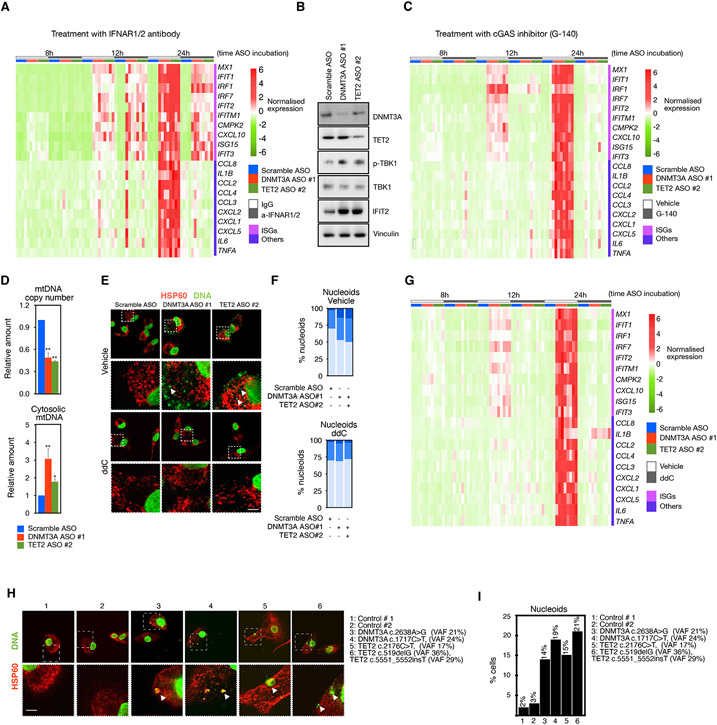
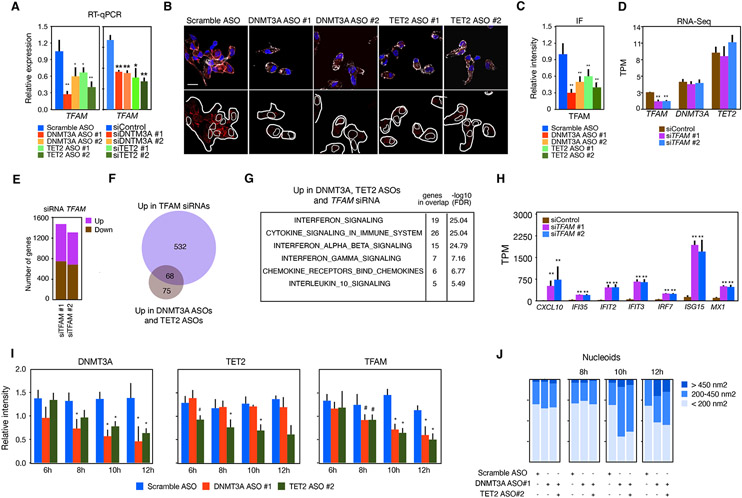
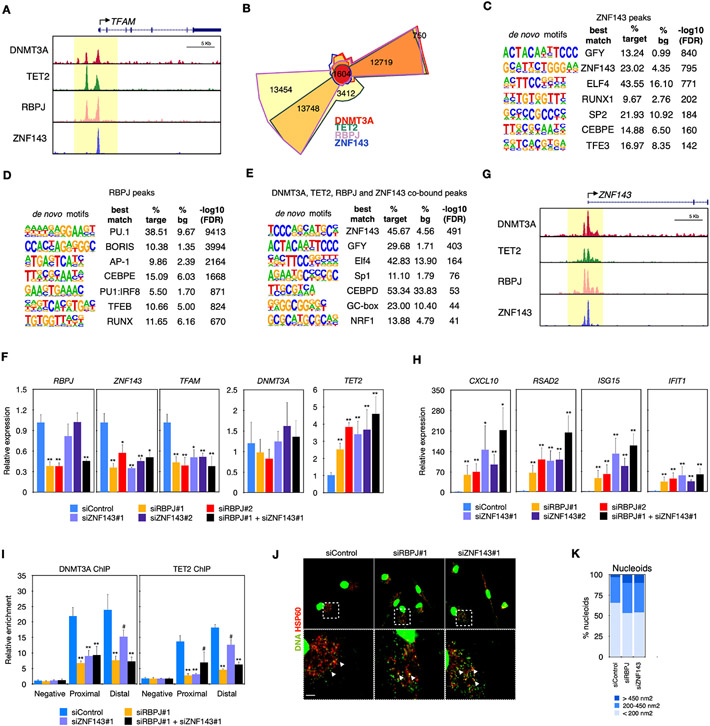
Deleterious somatic mutations in DNA methyltransferase 3 alpha (DNMT3A) and TET mehtylcytosine dioxygenase 2 (TET2) are associated with clonal expansion of hematopoietic cells and higher risk of cardiovascular disease (CVD). Here, we investigated roles of DNMT3A and TET2 in normal human monocyte-derived macrophages (MDM), in MDM isolated from individuals with DNMT3A or TET2 mutations, and in macrophages isolated from human atherosclerotic plaques. We found that loss of function of DNMT3A or TET2 resulted in a type I interferon response due to impaired mitochondrial DNA integrity and activation of cGAS signaling. DNMT3A and TET2 normally maintained mitochondrial DNA integrity by regulating the expression of transcription factor A mitochondria (TFAM) dependent on their interactions with RBPJ and ZNF143 at regulatory regions of the TFAM gene. These findings suggest that targeting the cGAS-type I IFN pathway may have therapeutic value in reducing risk of CVD in patients with DNMT3A or TET2 mutations.

Keywords: DNMT3A; TET2; TFAM; atherosclerosis; clonal hematopoiesis; interferon; mitochondria DNA; transcriptional regulation.


Conflict of interest statement

Declaration of interests C.K.G. is a cofounder and member of the scientific advisory board of Asteroid Therapeutics.

Figures

Figure 1.
Figure 1.. Transcriptional effect of DNMT3A and TET2 ablation in normal and atherosclerotic macrophages
(A) Intracellular staining analysis of DNTM3A and TET2 by flow cytometry at different stages of differentiation of monocyte-derived macrophages versus circulating monocytes (day 0) (n = 3 donors/experiment, 1 representative donor is shown). Scale bars: 5 μm. (B) IF analysis of DNMT3A and TET2 in monocyte-derived macrophages 6 days after differentiation versus 1.5 days (n = 3 donors/experiment, 1 representative donor is shown). Scale bars: 5 μm. (C) Protein quantification of DNMT3A and TET2 by IF in monocyte-derived macrophages transfected with the indicated ASOs against DNMT3A or TET2. (n = 3 donors). (D) Bar plots showing the number of differentially expressed genes (DEG) in monocyte-derived macrophages transfected with the indicated ASOs targeting DNMT3A or TET2 (n = 3 donors). (E) Venn diagram showing overlap between upregulated genes in both DNMT3A ASO and TET2 ASO and associated gene ontology term enrichment. (F) Log2 fold change of the indicated interferon stimulated genes (ISGs) and other inflammatory genes in MDM treated with DNTM3A ASOs or TET2 ASOs. Adjusted p < 0.05 for all versus control ASO. (G) Macrophages differentiated from monocytes isolated from individuals with no mutations (left panel) or macrophages isolated from atherosclerotic plaque (right panel) were stratified by DNMT3A or TET2 expression according to single-cell RNA-seq. Data corresponds to normalized expression values. (n = 3/group). Boxes denote upper (DNMT3AHigh and TET2High) and lower (DNMT3ALow and TET2Low) quartiles of expression, excluding cells with 0 values. (H) Bar graphs of the average expression values of DNMT3A or TET2 in DNMT3ALow versus DNMT3AHigh or TET2Low versus TET2High in healthy macrophages or atherosclerotic macrophages, respectively, as defined in (G). (I) Boxplot of expression of interferon stimulated genes determined by scRNA-seq data of MDM from healthy donors (left) or from macrophages isolated from atherosclerotic plaques (right) in cells with low DNMT3A or TET2 compared to high DNMT3A or TET2 as defined in (G), respectively. Data corresponds to normalized expression values. Mann-Whitney U test was used to calculate statistical significance. *p < 0.05; **p < 0.01. Also see Figure S1.
Figure 2.
Figure 2.. Effect of deleterious mutations or ablation of DNTM3A or TET2 in bystander cells
(A) RT-qPCR (left) of IFNA1, IFNA4, and IFNA5 and protein secretion analysis by ELISA (right) of IFNα in MDM transfected with DNMT3A ASO or TET2 ASO (n ≥ 3 donors). (B) Venn diagram and pathway analysis of genes differentially expressed in normal MDM incubated with conditioned media from macrophages transfected with DNMT3A ASO 1 or TET2 ASO 2(n = 4 donors). (C) Representative examples of ISG expression in macrophages treated with conditioned media from macrophages transfected with DNMT3A ASO 1 or TET2 ASO 2. (D) Analysis by RNA-seq of expression of ISG in macrophages incubated with conditioned media from macrophages transfected with DNMT3A ASO 1 or TET2 ASO 2 with and without IFNαR2 antibody (n = 2 donors). (E) RT-qPCR of ISGs in MDM transfected with DNMT3A ASO or TET2 ASO with and without treatment with IFNα (n = 4 donors). (F) Relative concentrations of IFNα in culture supernatant of macrophages differentiated from monocytes from two individuals with DNMT3A mutations or TET2 mutations compared to two individuals without detectable mutation (control 1 and control 2). (G) RT-qPCR analysis of ISG expression in MDM treated with conditioned media of macrophages with DNMT3A or TET2 mutations versus conditioned media from control individuals. Mann-Whitney U test was used to calculate statistical significance in all panels except in (E) where Student’s t test was used. *p < 0.05; **p < 0.01. Also see Figures S1 and S3.
Figure 3.
Figure 3.. Analysis of the molecular signature and signaling pathway altered by DNTM3A or TET2 ablation in macrophages
(A) Motif enrichment analyses of the promoters of upregulated genes in MDMs treated with DNMT3A ASOs and TET2 ASOs. (B) Protein analysis by IF of IRF1 and IRF7 in MDM incubated with reduced DNTM3A or TET2 expression (n = 3 donors). (C) ChIP-qPCR of IRF1, IRF7, or p-IRF3 at the IFNA1 promoter in MDM incubated with DNTM3A ASO or TET2 ASO (n = 3 donors). (D) ChIP-qPCR of p-IRF3 at the promoter of CXCL10, IFIT2, OASL, MX1, and ISG15 in mm treated with DNMT3A ASO or TET2 ASO as compared to scramble ASO (n = 4 donors). (E and F) H3K27ac and RNApolII ChIP signal at the promoters of CXCL10, IFIT2, OASL, MX1, ISG15 in macrophages with reduced DNMT3A or TET2 expression (n = 4 donors). Mann-Whitney U test was used to calculate statistical significance. *p < 0.05; **p < 0.01.
Figure 4.
Figure 4.. Genome-wide occupancy of DNMT3A and TET2
(A) Composite of genomic regions bound by DNMT3A only (left), by DNTM3A and TET2 (center), or by TET2 only (right). (B) Venn plot showing the overlap of all irreproducible discovery rate (IDR) peaks of DNMT3A and TET2 ChIP-seq (n = 4 donors). (C) Analysis of genomic distribution of DNMT3A or TET2 peaks (promoters defined by 1,000 bp upstream of TSS). (D) De novo motif analysis of DNMT3A (left) or TET2 (right) ChIP-seq peaks. (E) Pathway analysis of genes associated with DNTM3A unique peaks (left), or 25% of top best DNTM3A-TET2 cobound peaks (center), or 25% of top best TET2 unique peaks (right). (F) Venn plots of integrative analysis of upregulated genes in DNMT3A ASOs and TET2 ASOs with DNTM3A peak (left), TET2 peak (center), or DNMT3A-TET2 peak (right) as defined by 5,000 bp upstream of the TSS. Also see Figure S4.
Figure 5.
Figure 5.. Role of DNTM3A and TET2 in mitochondrial DNA integrity and activation of cGAS signaling
(A) RT-qPCR analysis of ISG or other inflammatory genes at 8, 12, or 14 h after incubation with DNMT3A ASO 1 or TET2 ASO 2 in the presence or absence of anti IFNAR2 (n = 4 donors). (B) Western blot analysis of p-TBK1, p-IRF3, and IFIT2 in lysates of MDM treated with DNMT3A ASO 1 or TET2 ASO 2 (n = 1 pool of 3 donors). (C) RT-qPCR analysis of ISGs or other inflammatory genes at 8, 12, or 14 h after incubation with DNMT3A ASO 1 or TET2 ASO 2 in the presence or absence of the cGAS inhibitor G-140 (n = 4 donors). (D) Bar graphs of mitochondrial copy number (top) and increased cytosolic mitochondrial DNA in extracts of MDM treated with DNMT3A ASO 1 or TET2 ASO 2 (n = 3 donors). (E) Immunofluorescence analysis of mitochondria (HSP60) and DNA in regions associated with mitochondria in MDM treated with DNMT3A ASO 1 or TET2 ASO 2 in the presence or absence of treatment with ddC (arrowheads) (n = 3 donors). Scale bars: 2 μm. (F) Quantification of cytosolic DNA (nucleoids) in MDM treated with DNMT3A ASO 1 or TET2 ASO 2 in the presence or absence of treatment with ddC (n = 3 donors). (G) RT-qPCR analysis of ISG or other inflammatory genes at 8, 12, or 14 h after incubation with DNMT3A ASO 1 or TET2 ASO 2 in the presence or absence of treatment with ddC (n = 4 donors). (H) Representative images by IF analysis of HSP60 and DNA showing larger nucleoids (arrowheads) in macrophages with DNMT3A or TET2 mutations. Scale bars: 2 μm. (I) Quantification of cytosolic DNA in macrophages with DNMT3A or TET2 mutations. Mann-Whitney U test was used to calculate statistical significance. *p < 0.05; **p < 0.01. Also see Figure S5.
Figure 6.
Figure 6.. DNMT3A and TET2 regulate the TFAM gene to restrain activation of ISGs
(A) RT-qPCR analysis of TFAM expression in MDM treated with DNMT3A ASOs or TET2 ASOs or siRNAs for DNMT3A or TET2 (n = 5 donors for ASOs and n = 3 donors for siRNA). (B) Protein expression by IF in MDM treated with DNMT3A ASOs or TET2 ASOs (n = 2 donors). Scale bars: 10 μm. (C) Quantification of protein expression shown in (B), downregulation in MDM treated with DNMT3A ASOs or TET2 ASOs (n = 2 donors). (D) Bar plots showing the number of differentially expressed genes in MDM treated with siTFAM 1 or siTFAM 2 versus siControl. (E) Bar plot showing reduced expression of TFAM (but not DNMT3A or TET2) in MDM treated with siRNAs for TFAM. (F) Venn plot showing the overlap between genes upregulated by DNTM3A ASOs and TET2 ASOs in MDM incubated with siRNAs for TFAM. (G) Pathway analysis of genes upregulated by DNMT3A ASOs, TET2 ASOs, and by TFAM siRNA showing enrichment in interferon signaling genes. (H) Bar plot showing the upregulation of IFN-stimulated genes in cells treated with siRNAs for TFAM. (I) Protein expression by IF of DNMT3A (left), TET2 (center), and TFAM (right) showing DNMT3A and TET2 reduction at 8 h, whereas TFAM reduction occurs at 10 h in MDM treated with DNMT3A ASOs or TET2 ASOs (n = 5 donors, one representative donor is shown). (J) Quantification of cytosolic nucleoids in MDM treated with DNMT3A ASOs or TET2 ASOs (n = 3 donors). Mann-Whitney U test was used to calculate statistical significance. *p < 0.05; **p < 0.01 except panel in (I) where Student’s t test was used to calculate statistical significance. Also see Figure S6.
Figure 7.
Figure 7.. Combinatorial binding of RBPJ, ZNF143, DNMT3A, and TET2 to coordinate TFAM expression and prevent type-I IFN signaling
(A) Composites of DNTM3A, TET2, RBPJ ,and ZNF143 ChIP-seq showing binding to TFAM promoter. (B) Chow-Ruskey plot showing the overlap between DNTM3a, TET2, ZNF143, and RBPJ ChIP-seqs (n = 4 donors for DNMT3A and TET2 ChIP-seqs and n = 2 donors for ZNF143 and RBPJ ChIP-seq). (C) HOMER analysis of motifs found in the 1,604 peaks co-bound by DNMT3A, TET2, RBPJ, and ZNF143 showing motifs for ZNF143, ELF4, PU.1, and CEBPD. (D) HOMER analysis of motifs found in ZNF143 peaks showing enrichment for ZNF143, ELF4, RUNX, PU.1, CEBPE, and MITF/TFE. (E) HOMER analysis of motifs found in RBPJ peaks showing enrichment in PU.1, BORIS, AP-1, CEBPE, PU.1-IRF8, and MITF/TFE. (F) RT-qPCR of RBPJ, ZNF143, DNTM3A, TET2, or TFAM in MDM treated with siRNAs for RBPJ or ZNF143 (n = 3 donors). (G) Composites of DNTM3A, TET2, RBPJ, and ZNF143 ChIP-seq showing binding to ZNF143 promoter. (H) RT-qPCR showing upregulation of CXCL10, RSAD2, ISG15, and IFIT1 in MDM treated with siRNAs for RBPJ or ZNF143 (n = 3 donors). (I) ChIP-qPCR over a control negative region (negative), proximal or distal region of TFAM promoter showing reduced binding of DNMT3A and TET2 in MDM treated with siRNAs for RBPJ or ZNF143 (n = 3 donors). (J) Representative images by IF analysis of HSP60 and DNA showing larger nucleoids (arrowheads) in macrophages with DNMT3A or TET2 mutations. Scale bars, 2 μm. (K) Quantification of cytosolic DNA showing increased number of macrophages treated with siRNA for RBPJ or ZNF143 or TFAM. Mann-Whitney U test was used to calculate statistical significance. *p < 0.05; **p < 0.01. Also see Figure S7.

Comment in

References

    1. Abe T, and Barber GN (2014). Cytosolic-DNA-mediated, STING-dependent proinflammatory gene induction necessitates canonical NF-kappaB activation through TBK1. J. Virol 88, 5328–5341. 10.1128/JVI.00037-14. - DOI - PMC - PubMed
    1. Acuna-Hidalgo R, Sengul H, Steehouwer M, van de Vorst M, Vermeulen SH, Kiemeney L, Veltman JA, Gilissen C, and Hoischen A (2017). Ultra-sensitive sequencing identifies high prevalence of clonal hematopoiesis-associated mutations throughout adult life. Am. J. Hum. Genet 101, 50–64. 10.1016/j.ajhg.2017.05.013. - DOI - PMC - PubMed
    1. Assmus B, Cremer S, Kirschbaum K, Culmann D, Kiefer K, Dorsheimer L, Rasper T, Abou-El-Ardat K, Herrmann E, Berkowitsch A, et al. (2021). Clonal haematopoiesis in chronic ischaemic heart failure: prognostic role of clone size for DNMT3A- and TET2-driver gene mutations. Eur. Heart J 42, 257–265. 10.1093/eurheartj/ehaa845. - DOI - PubMed
    1. Bobryshev YV, Ivanova EA, Chistiakov DA, Nikiforov NG, and Orekhov AN (2016). Macrophages and their role in atherosclerosis: pathophysiology and transcriptome analysis. BioMed Res. Int 2016, 9582430. 10.1155/2016/9582430. - DOI - PMC - PubMed
    1. Buscarlet M, Provost S, Zada YF, Barhdadi A, Bourgoin V, Lépine G, Mollica L, Szuber N, Dubé MP, and Busque L (2017). DNMT3A and TET2 dominate clonal hematopoiesis and demonstrate benign phenotypes and different genetic predispositions. Blood 130, 753–762. 10.1182/blood-2017-04-777029. - DOI - PubMed

Publication types

MeSH terms