. 2022 Sep;298(9):102336.
doi: 10.1016/j.jbc.2022.102336. Epub 2022 Aug 2.

A new fluorescent sensor mitoferrofluor indicates the presence of chelatable iron in polarized and depolarized mitochondria

Affiliations

A new fluorescent sensor mitoferrofluor indicates the presence of chelatable iron in polarized and depolarized mitochondria

Andaleb Kholmukhamedov et al. J Biol Chem. 2022 Sep.

Abstract

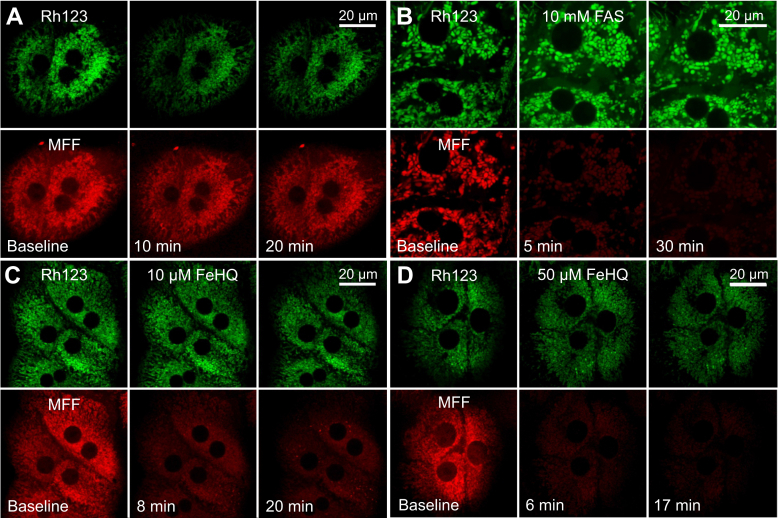
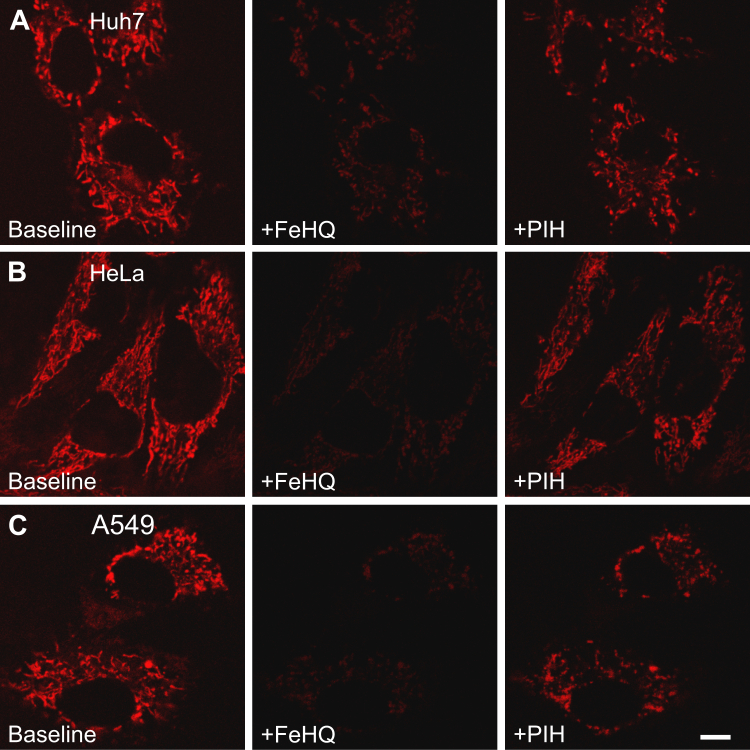
Mitochondrial chelatable iron contributes to the severity of several injury processes, including ischemia/reperfusion, oxidative stress, and drug toxicity. However, methods to measure this species in living cells are lacking. To measure mitochondrial chelatable iron in living cells, here we synthesized a new fluorescent indicator, mitoferrofluor (MFF). We designed cationic MFF to accumulate electrophoretically in polarized mitochondria, where a reactive group then forms covalent adducts with mitochondrial proteins to retain MFF even after subsequent depolarization. We also show in cell-free medium that Fe2+ (and Cu2+), but not Fe3+, Ca2+, or other biologically relevant divalent cations, strongly quenched MFF fluorescence. Using confocal microscopy, we demonstrate in hepatocytes that red MFF fluorescence colocalized with the green fluorescence of the mitochondrial membrane potential (ΔΨm) indicator, rhodamine 123 (Rh123), indicating selective accumulation into the mitochondria. Unlike Rh123, mitochondria retained MFF after ΔΨm collapse. Furthermore, intracellular delivery of iron with membrane-permeant Fe3+/8-hydroxyquinoline (FeHQ) quenched MFF fluorescence by ∼80% in hepatocytes and other cell lines, which was substantially restored by the membrane-permeant transition metal chelator pyridoxal isonicotinoyl hydrazone. We also show FeHQ quenched the fluorescence of cytosolically coloaded calcein, another Fe2+ indicator, confirming that Fe3+ in FeHQ undergoes intracellular reduction to Fe2+. Finally, MFF fluorescence did not change after addition of the calcium mobilizer thapsigargin, which shows MFF is insensitive to physiologically relevant increases of mitochondrial Ca2+. In conclusion, the new sensor reagent MFF fluorescence is an indicator of mitochondrial chelatable Fe2+ in normal hepatocytes with polarized mitochondria as well as in cells undergoing loss of ΔΨm.

Keywords: iron sensor; ischemia/reperfusion; membrane potential; mitochondria.


Conflict of interest statement

Conflict of interest The authors declare that they have no conflicts of interest with the contents of this article.

Figures

Figure 1
Figure 1
Scheme of synthesis of mitoferrofluor. See text for details.
Figure 2
Figure 2
Spectral properties and cation sensitivity of mitoferrofluor (MFF).A, absorbance spectra for MFF (1–10 μM) at 23 °C in 10 mM Tris–HCl containing 0.1% SDS, pH 8. Red line is absorbance in presence of 5 μM Fe2+ (FAS). B, excitation and emission spectra of MFF (0.5 μM) in the same medium with 600 nm and 560 nm emission and excitation, respectively, using a dual monochromator spectrofluorometer. C, quenching of MFF (4 μM) fluorescence by Fe2+ (FAS) but not Fe3+ (FeCl3). D, effect of pH on MFF (4 μM) fluorescence and its quenching by 1.5 μM Fe2+. E, sensitivity of MFF (4 μM) to various metal ions (1.5 μM). In panels (CE), fluorescence was measured with a fluorescence plate reader using a 544 nm excitation filter and a 600 nm long-pass emission filter. Data points are means ± SEM from triplicate measurements. In panel (F), cultured mouse hepatocytes were loaded with 1 μM MFF for 30 min in complete culture medium, washed with fresh medium three times, and incubated in fresh medium for 60 min followed by 100 μM PIH. After ∼30 min, cells were placed on the stage of a Zeiss LSM880 confocal microscope, and images of MFF fluorescence were collected every 1 min for 30 min at 0.3% laser power (4 μs/pixel). Plotted is total integrated MFF fluorescence minus background as a function of time. Data points are mean ± SEM from triplicate measurements. FAS, ferrous ammonium sulfate; PIH, pyridoxal isonicotinoyl hydrazone.
Figure 3
Figure 3
Covalent binding of mitoferrofluor (MFF) to mitochondria.A, an overnight-cultured mouse hepatocyte was loaded with MFF (1 μM for 30 min), washed, and incubated in culture medium for 30 min. The hepatocyte was then loaded with Rh123 (0.5 μM) for 30 min, washed, and incubated in Krebs-Ringer-Hepes buffer (in mM: 115 NaCl, 5 KCl, 1 KH2PO4, 2 CaC12, 1.2 MgSO4, and 25 Hepes, pH 7.4) with 150 nM Rh123 to maintain equilibrium distribution prior to confocal imaging. B, mouse hepatocytes were loaded with MFF (1 μM for 30 min), washed, and incubated in culture medium for 30 min. The cells were washed and incubated with supplemented ICB and 5 nM PMP to permeabilize the plasma membrane. A time series of confocal images was collected at 1 min intervals as CCCP (10 μM) was added after the second frame (0 min). Images shown are from before (left panel) and 2 min after (middle panel) addition of CCCP. The right panel plots red MFF fluorescence after background subtraction as a function of time (n = 14 cells). C, mouse hepatocytes were loaded with MTG (200 nM for 30 min), permeabilized, and exposed to CCCP as described in (B). The right panel plots green MTG fluorescence after background subtraction as a function of time (n = 12 cells). D, mouse hepatocytes were loaded with Rh123, as described in (A), followed by permeabilization and exposure to CCCP, as described in (B). The right panel plots green Rh123 fluorescence after background subtraction as a function of time (n = 21 cells). In (A), note colocalization of red MFF fluorescence with green Rh123 fluorescence, indicating mitochondrial loading of MFF. In (B) and (C), note mild mitochondrial swelling after CCCP addition, but retention of nearly all MFF and MTG fluorescence, consistent with covalent labeling of mitochondrial proteins by the fluorophores. By contrast in (D), Rh123 was rapidly and virtually completely released after CCCP. CCCP, carbonyl cyanide m-chlorophenyl hydrazone; ICB, intracellular buffer; MTG, MitoTracker green.
Figure 4
Figure 4
Fluorescence quenching after iron in mitoferrofluor (MFF)-loaded hepatocytes. Overnight-cultured rat hepatocytes were loaded with 1 μM MFF and 500 nM rhodamine 123, as described in Figure 3A, and then treated with vehicle (A), 10 mM FAS (B), and 10 and 50 μM FeHQ (C and D). Note marked quenching of mitochondrial MFF fluorescence after FAS and FeHQ but not after vehicle. Rh123 fluorescence was not lost. Images are representative of three or more experiments. FAS, ferrous ammonium sulfate; FeHQ, Fe3+/8-hydroxyquinoline.
Figure 5
Figure 5
Quenching of cytosolic calcein and mitochondrial mitoferrofluor (MFF) fluorescence by ferric 8-hydroxyquinoline: Reversal by pyridoxal isonicotinoyl hydrazone. Overnight-cultured rat hepatocytes were loaded with 1 μM MFF and 1 μM calcein-acetoxymethylester, and then incubated with 100 μM calcein-free acid in the extracellular medium, as described in Experimental procedures. A, no other additions were made. B, 10 μM FeHQ was added as indicated. C, FeHQ and 1 mM PIH were sequentially added. Note that fluorescence of MFF and calcein was stable for at least 40 min (A). After addition of 10 μM FeHQ, both MFF and intracellular calcein became strongly quenched (B and C). Addition of PIH substantially reverted FeHQ-dependent quenching of both MFF and calcein (C). Images are representative of three or more experiments. FeHQ, Fe3+/8-hydroxyquinoline; PIH, pyridoxal isonicotinoyl hydrazone.
Figure 6
Figure 6
Lack of response of mitoferrofluor (MFF) to increased mitochondrial Ca2+. In separate experiments, overnight-cultured rat hepatocytes were loaded with 10 μM Rhod-2 AM (A), a red-fluorescing Ca2+ indicator, and 1 μM MFF (B). Thapsigargin (Tg, 2 μM) was then added. In (A), note a time-dependent increase in mitochondrial Rhod-2 fluorescence in a heterogeneous fashion. The asterisk identifies an area of diffuse Rhod-2 fluorescence that decreased after thapsigargin. In (B), MFF fluorescence remained virtually unchanged after thapsigargin, and heterogeneous changes of MFF fluorescence were completely absent. Images are representative of three or more experiments.
Figure 7
Figure 7
Iron quenches mitoferrofluor (MFF) fluorescence in mitochondria of cultured cell lines. Huh7, HeLa, and A549 cells (A–C, respectively) were loaded with 1 μM MFF for 30 min in culture medium and then thrice washed with medium. After ∼60 min more of incubation, the cells were placed on the microscope, and the red fluorescence of MFF was imaged before (Baseline) and after sequential addition of 50 μM FeHQ and 100 μM PIH at 5 min intervals. Note, quenching of MFF fluorescence after FeHQ and partial recovery of fluorescence after PIH in each cell type. Images are representative of three or more experiments. The scale bar represents 10 μm. FeHQ, Fe3+/8-hydroxyquinoline; PIH, pyridoxal isonicotinoyl hydrazone.
Figure 8
Figure 8
Mitoferrofluor (MFF), RPA, and MitoTracker green do not change mitochondrial respiration. Overnight-cultured rat hepatocytes were loaded with dimethyl sulfoxide (DMSO, vehicle), 1 μM MFF, 1 μM RPA, or 1 μM MTG. OCR was measured before (Basal) and after sequential addition of oligomycin (1 μM), FCCP (1 μM), and antimycin/rotenone (1 μM each) with a Seahorse XFe96 extracellular flux analyzer. Error bars are SD. MTG, MitoTracker Green; OCR, oxygen consumption rate; RPA, rhodamine B-[(1,10-phenanthrolin-5-yl)aminocarbonyl]benzyl ester.

References

    1. Starke P.E., Farber J.L. Ferric iron and superoxide ions are required for the killing of cultured hepatocytes by hydrogen peroxide. Evidence for the participation of hydroxyl radicals formed by an iron-catalyzed Haber-Weiss reaction. J. Biol. Chem. 1985;260:10099–10104. - PubMed
    1. Kehrer J.P. The Haber-Weiss reaction and mechanisms of toxicity. Toxicology. 2000;149:43–50. - PubMed
    1. Lemasters J.J. In: The Liver. Biology and Pathobiology. Arias I.M., Boyer J.L., Chisari F.V., Fausto N., Schachter D., Shafritz D.A., editors. Lippincott, Williams & Wilkins; Philadelphia, PA: 2001. Hypoxic, ischemic and reperfusion injury to liver; pp. 257–279.
    1. Gaschler M.M., Stockwell B.R. Lipid peroxidation in cell death. Biochem. Biophys. Res. Commun. 2017;482:419–425. - PMC - PubMed
    1. Hung H.I., Schwartz J.M., Maldonado E.N., Lemasters J.J., Nieminen A.L. Mitoferrin-2-dependent mitochondrial iron uptake sensitizes human head and neck squamous carcinoma cells to photodynamic therapy. J. Biol. Chem. 2013;288:677–686. - PMC - PubMed

Publication types

LinkOut - more resources