. 2022 Nov;102(5):1042-1056.
doi: 10.1016/j.kint.2022.07.003. Epub 2022 Aug 2.

Persistent DNA damage underlies tubular cell polyploidization and progression to chronic kidney disease in kidneys deficient in the DNA repair protein FAN1

Affiliations

Persistent DNA damage underlies tubular cell polyploidization and progression to chronic kidney disease in kidneys deficient in the DNA repair protein FAN1

Merlin Airik et al. Kidney Int. 2022 Nov.

Abstract

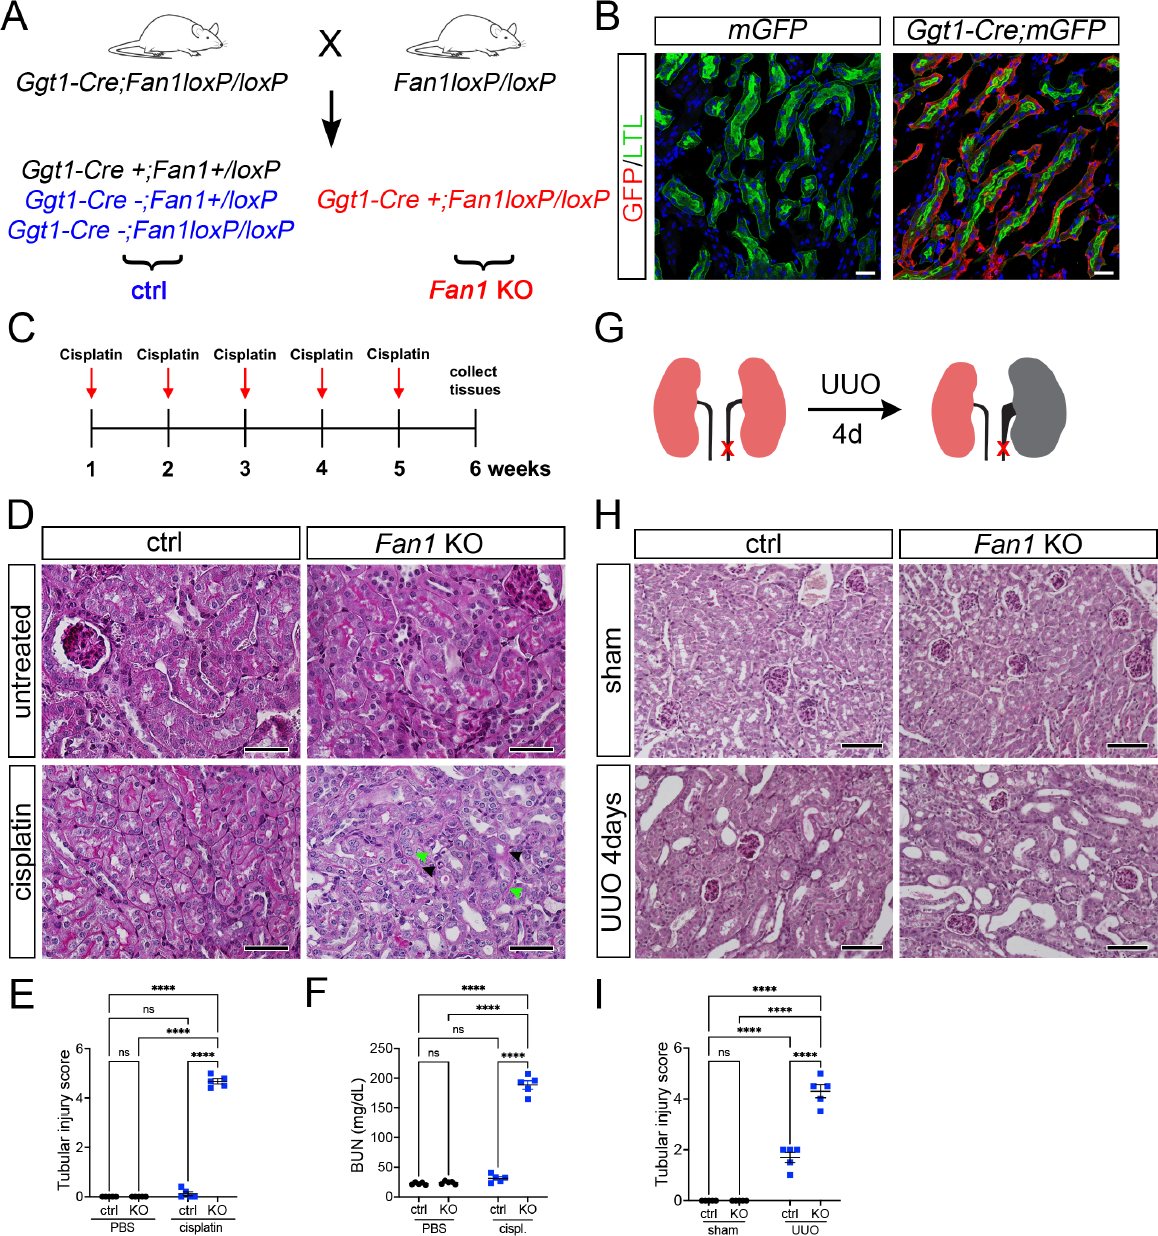
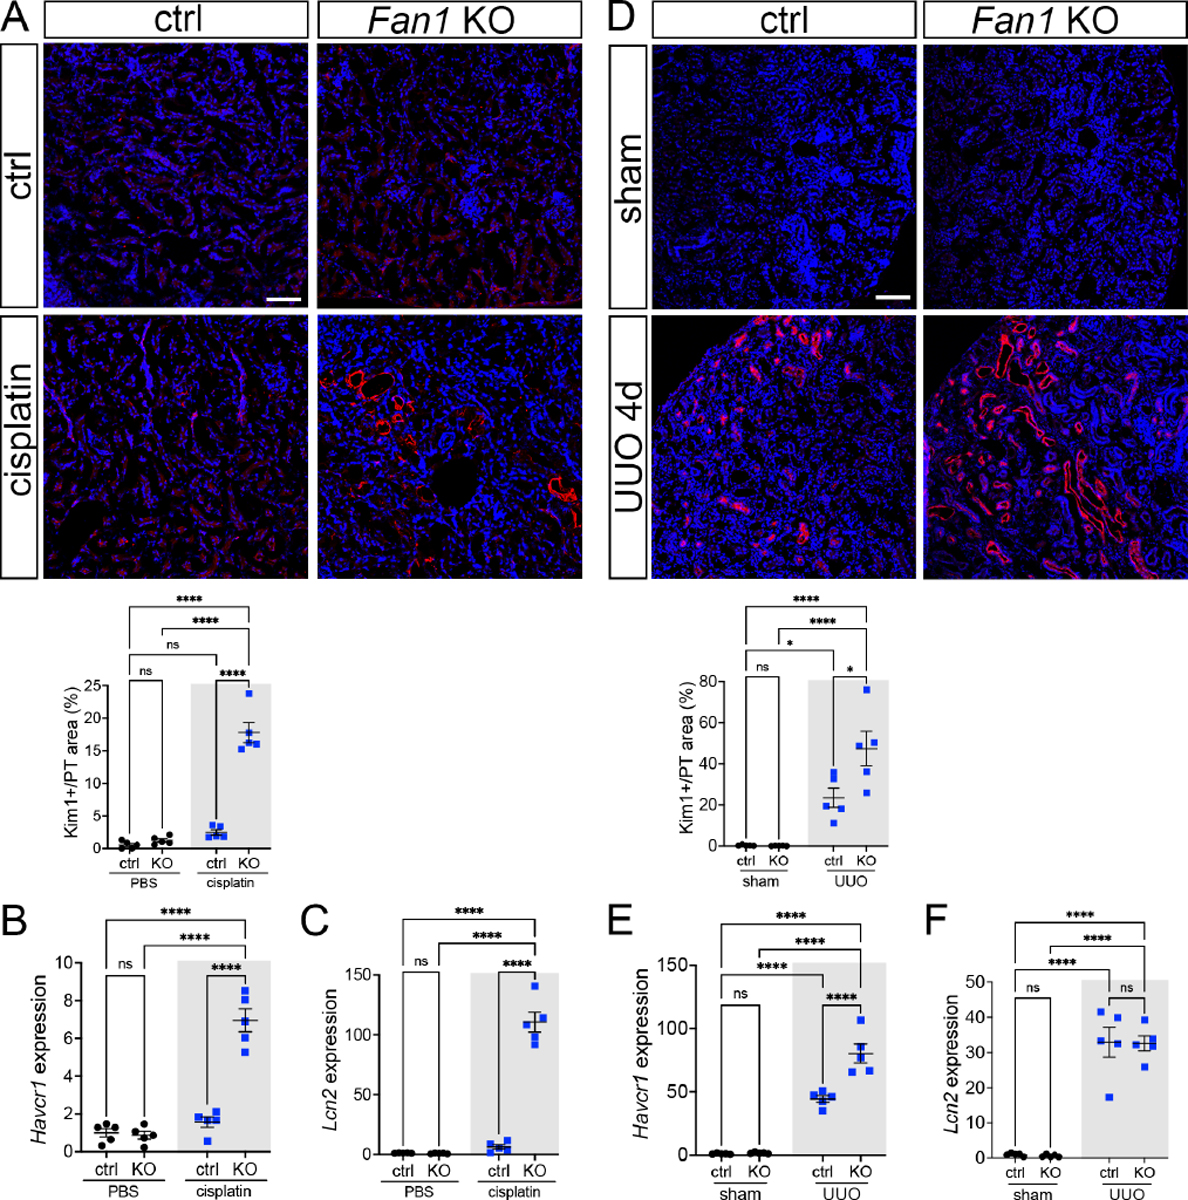
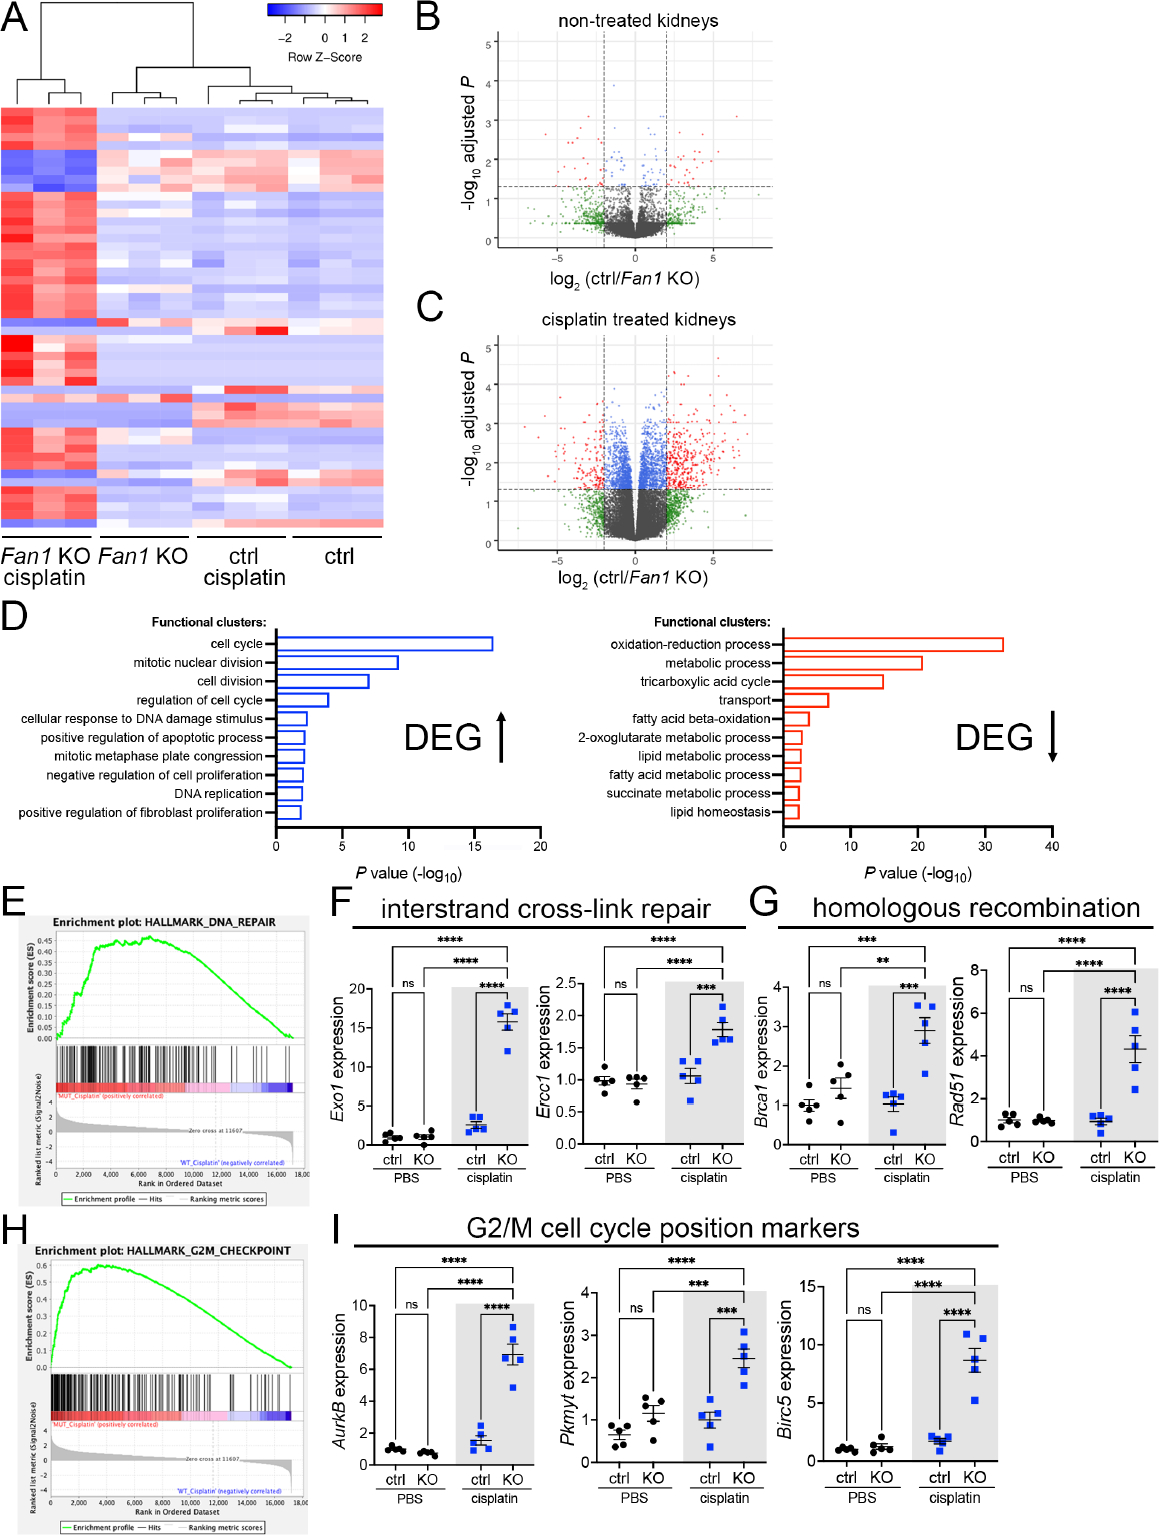
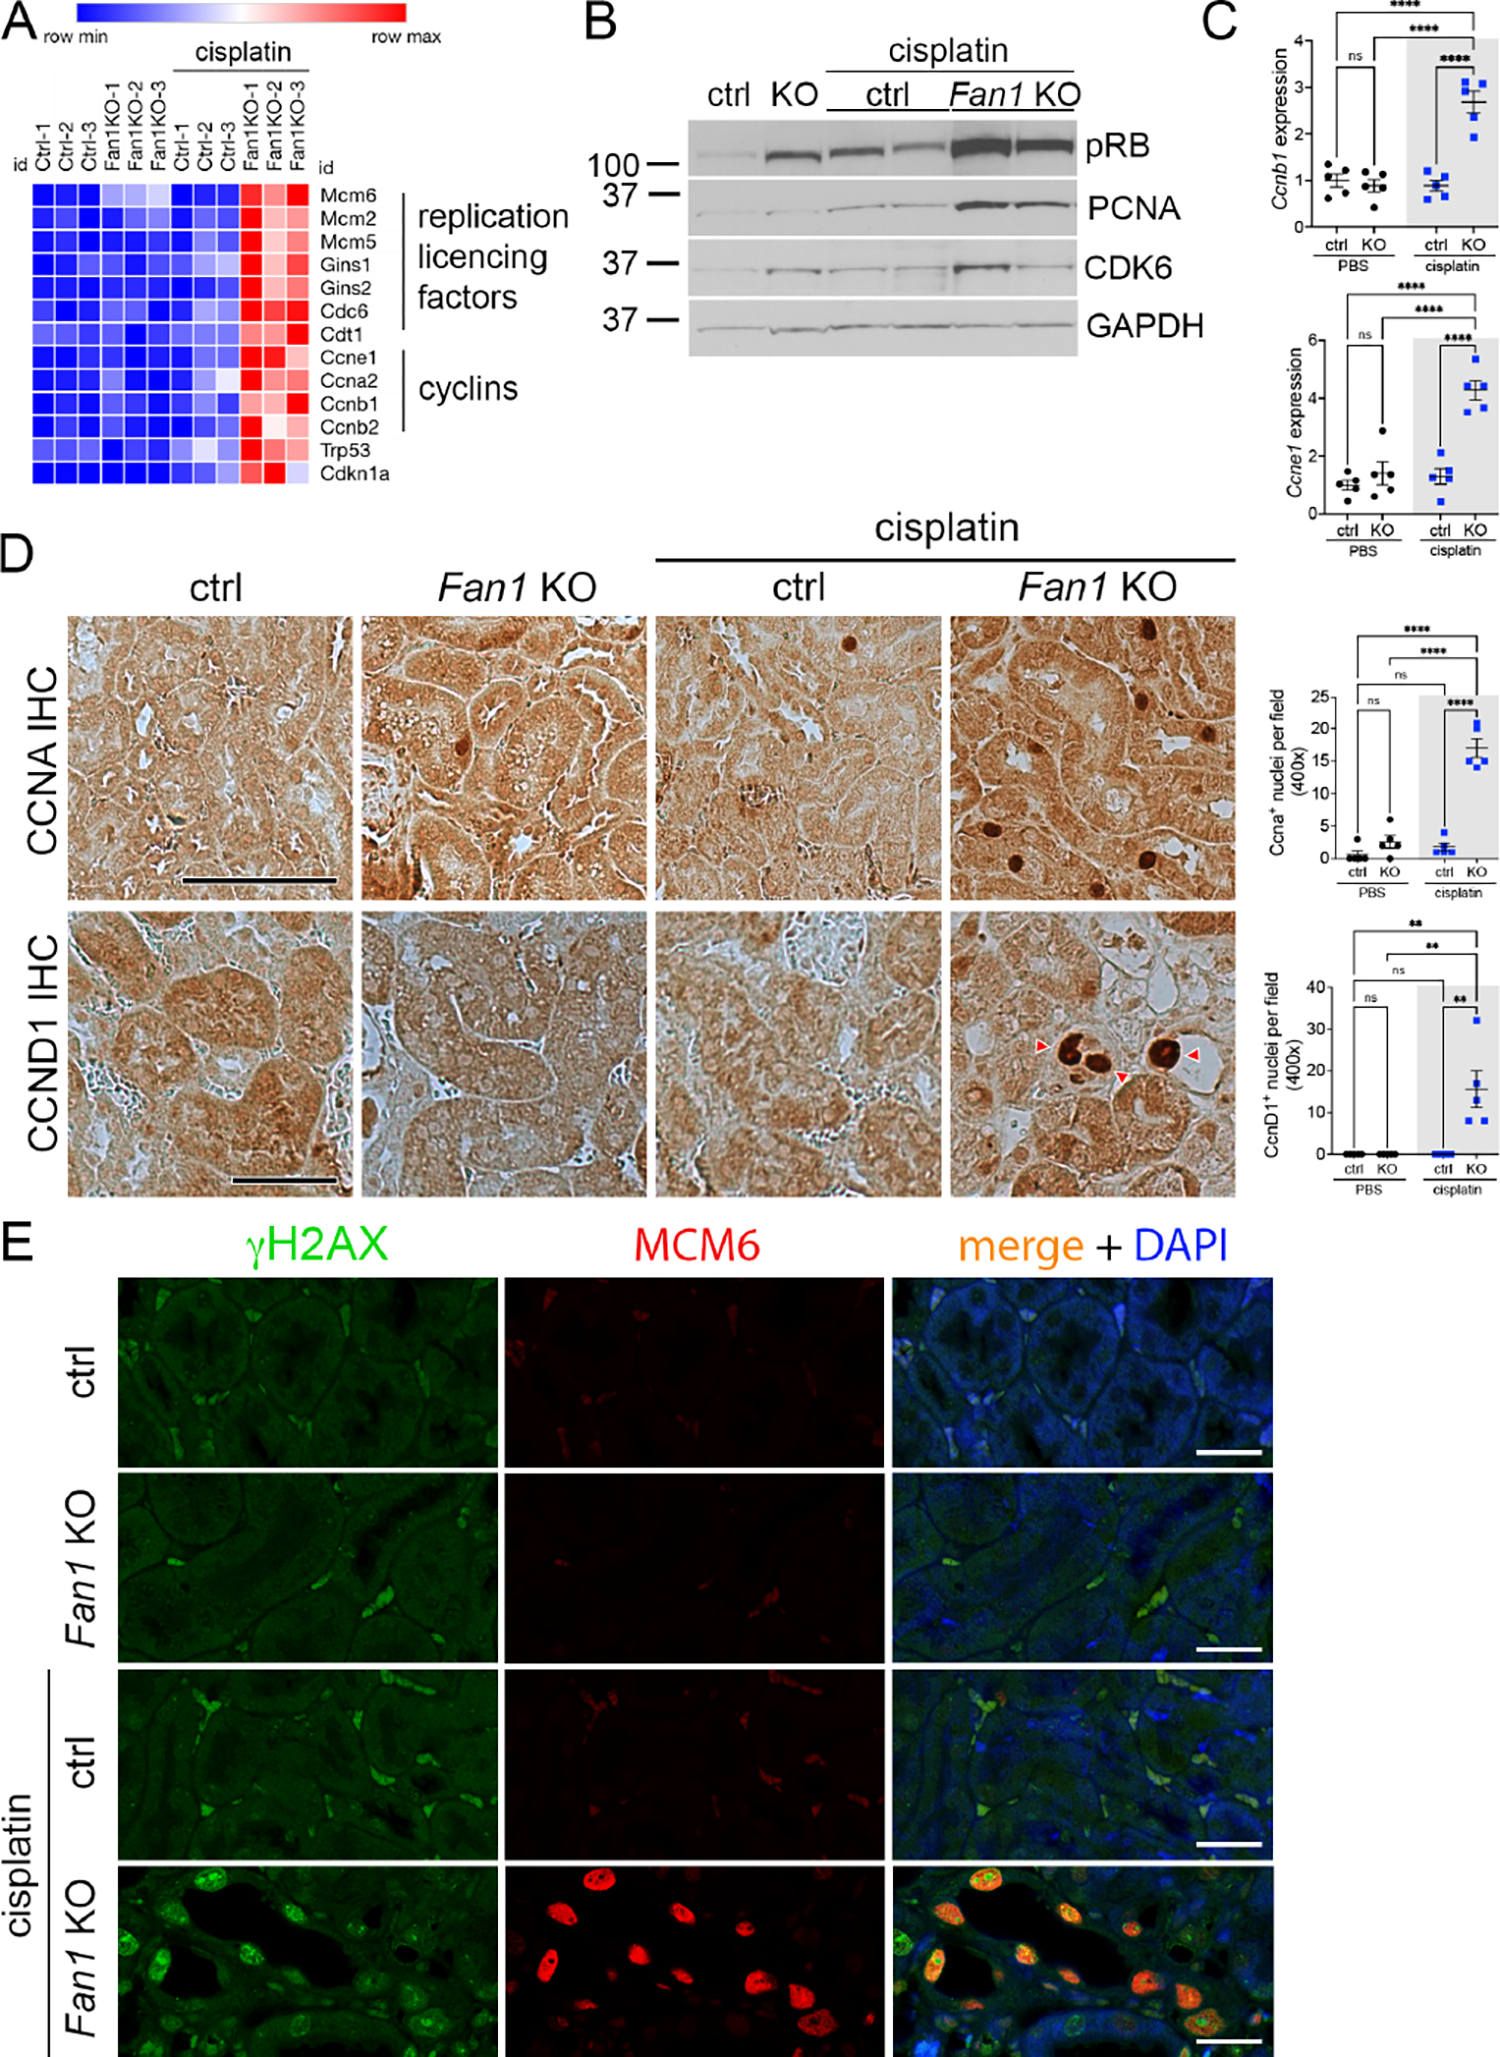
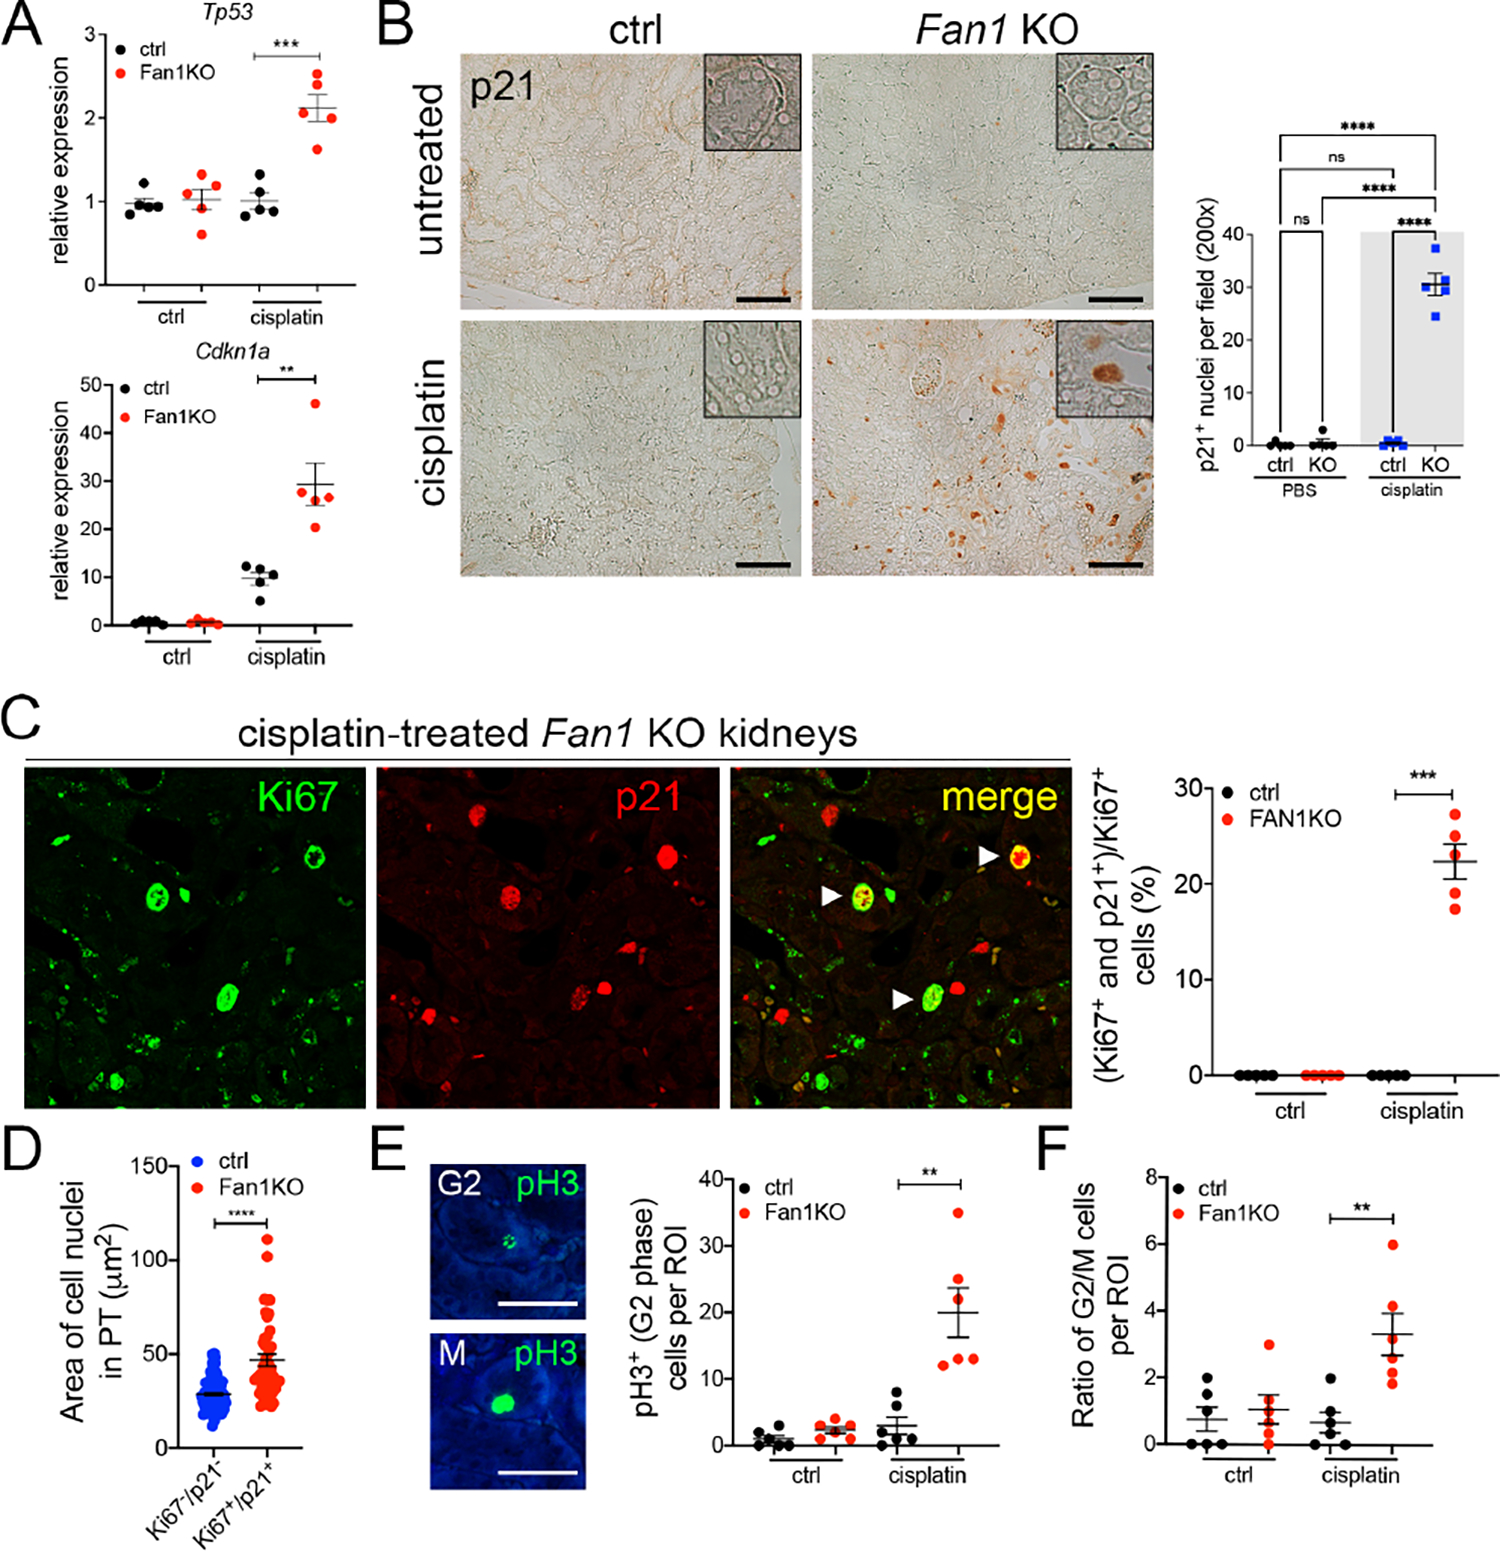
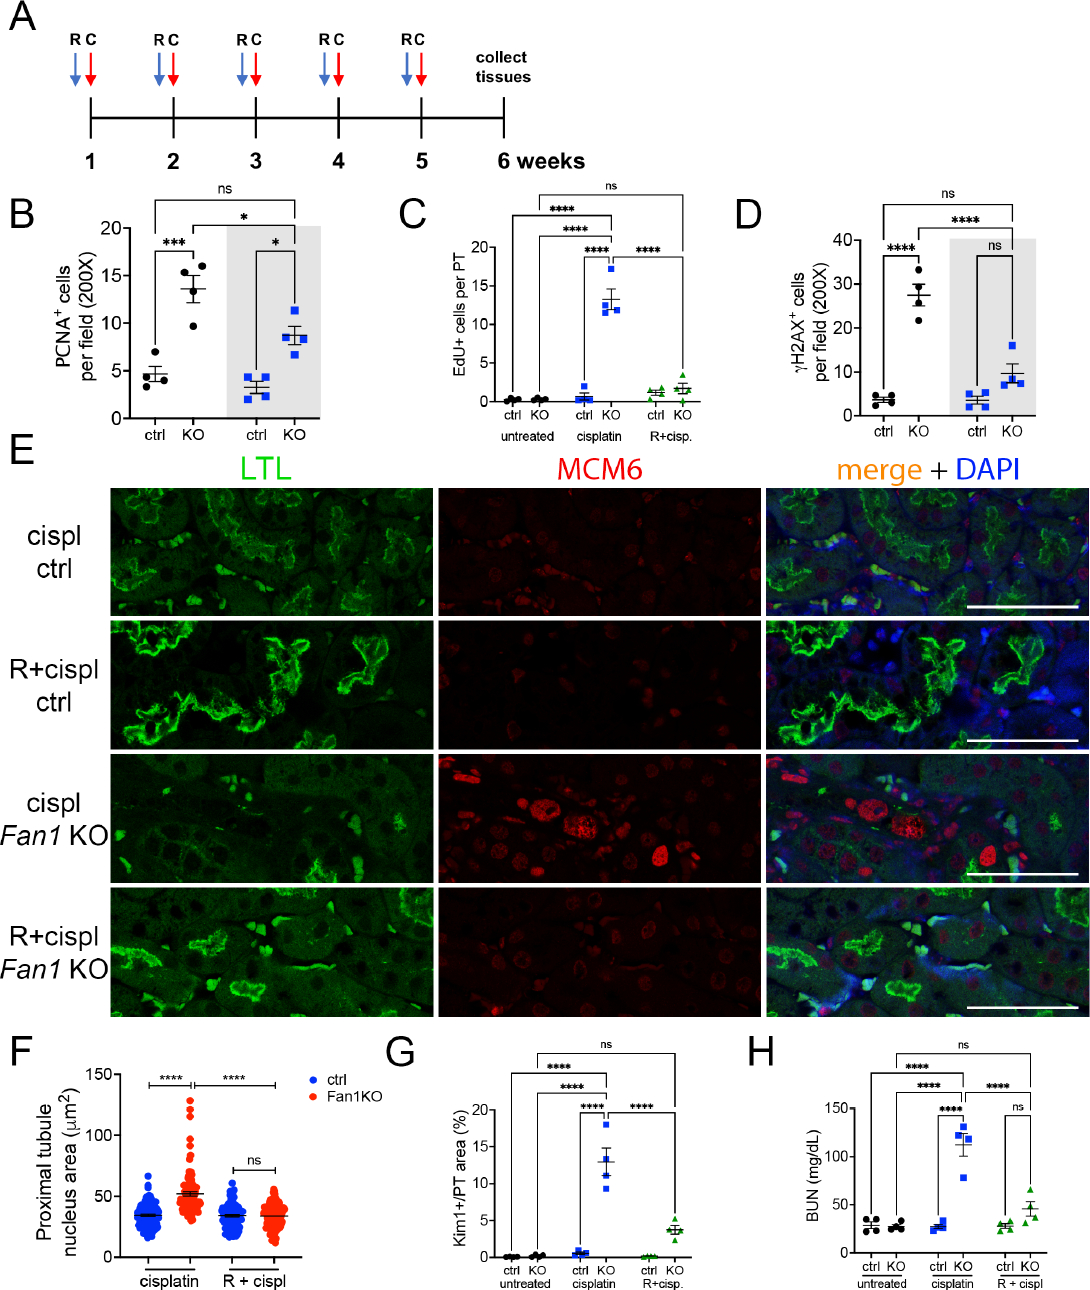
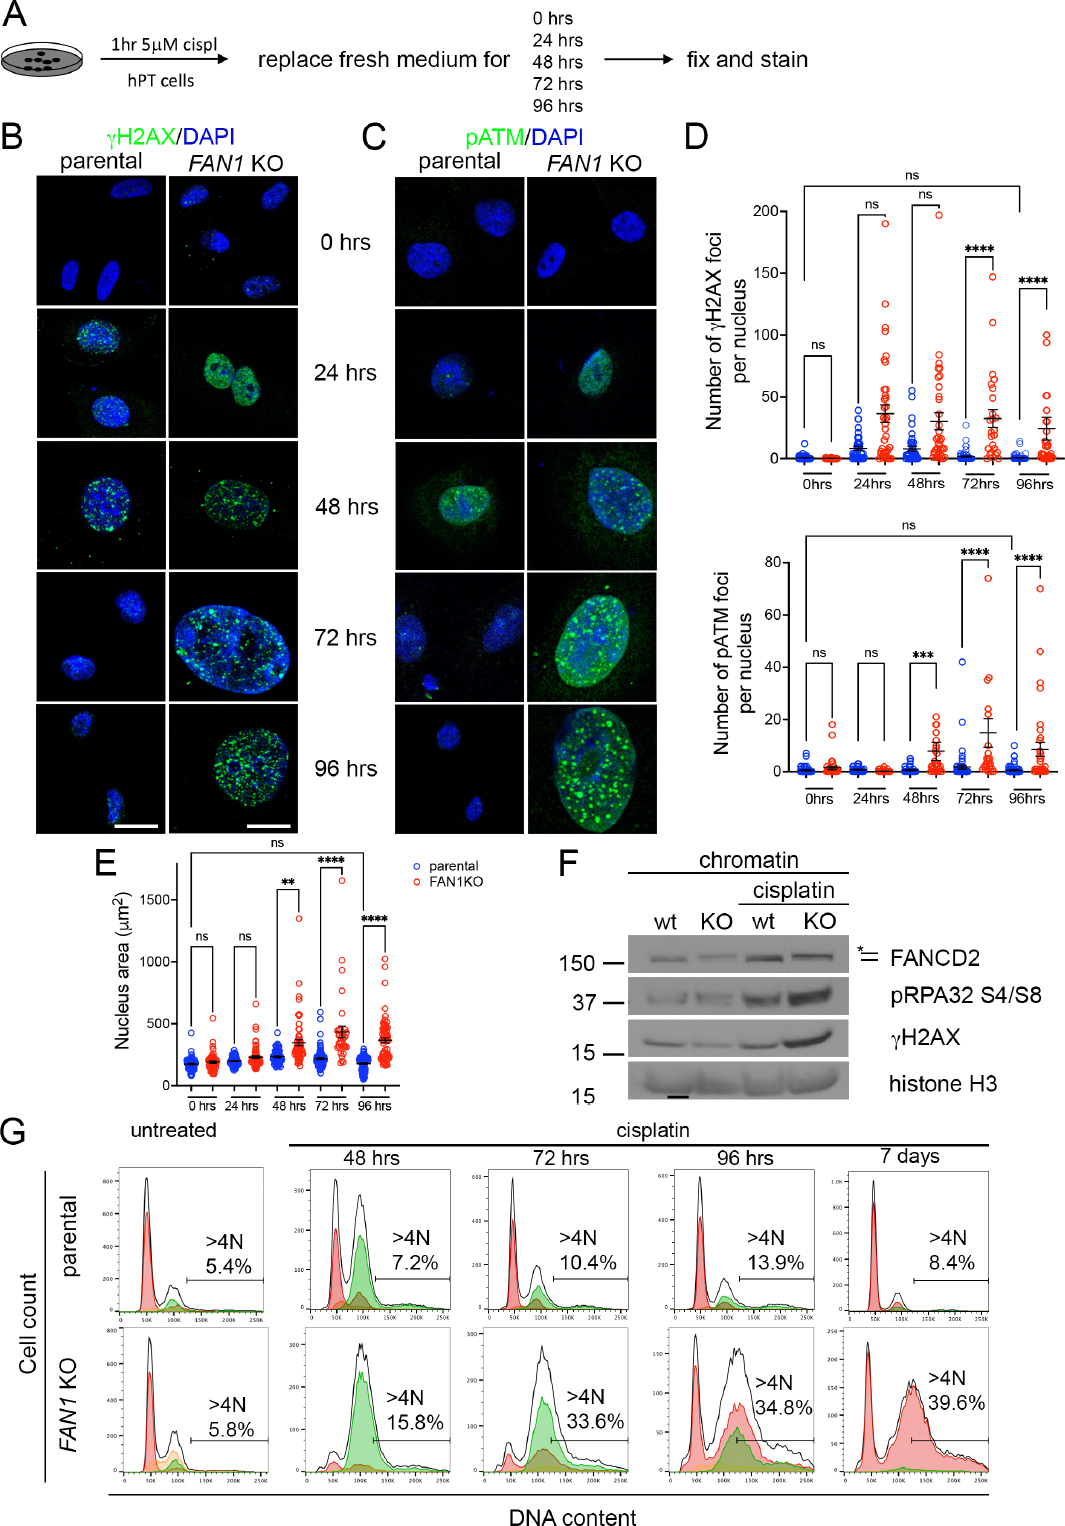
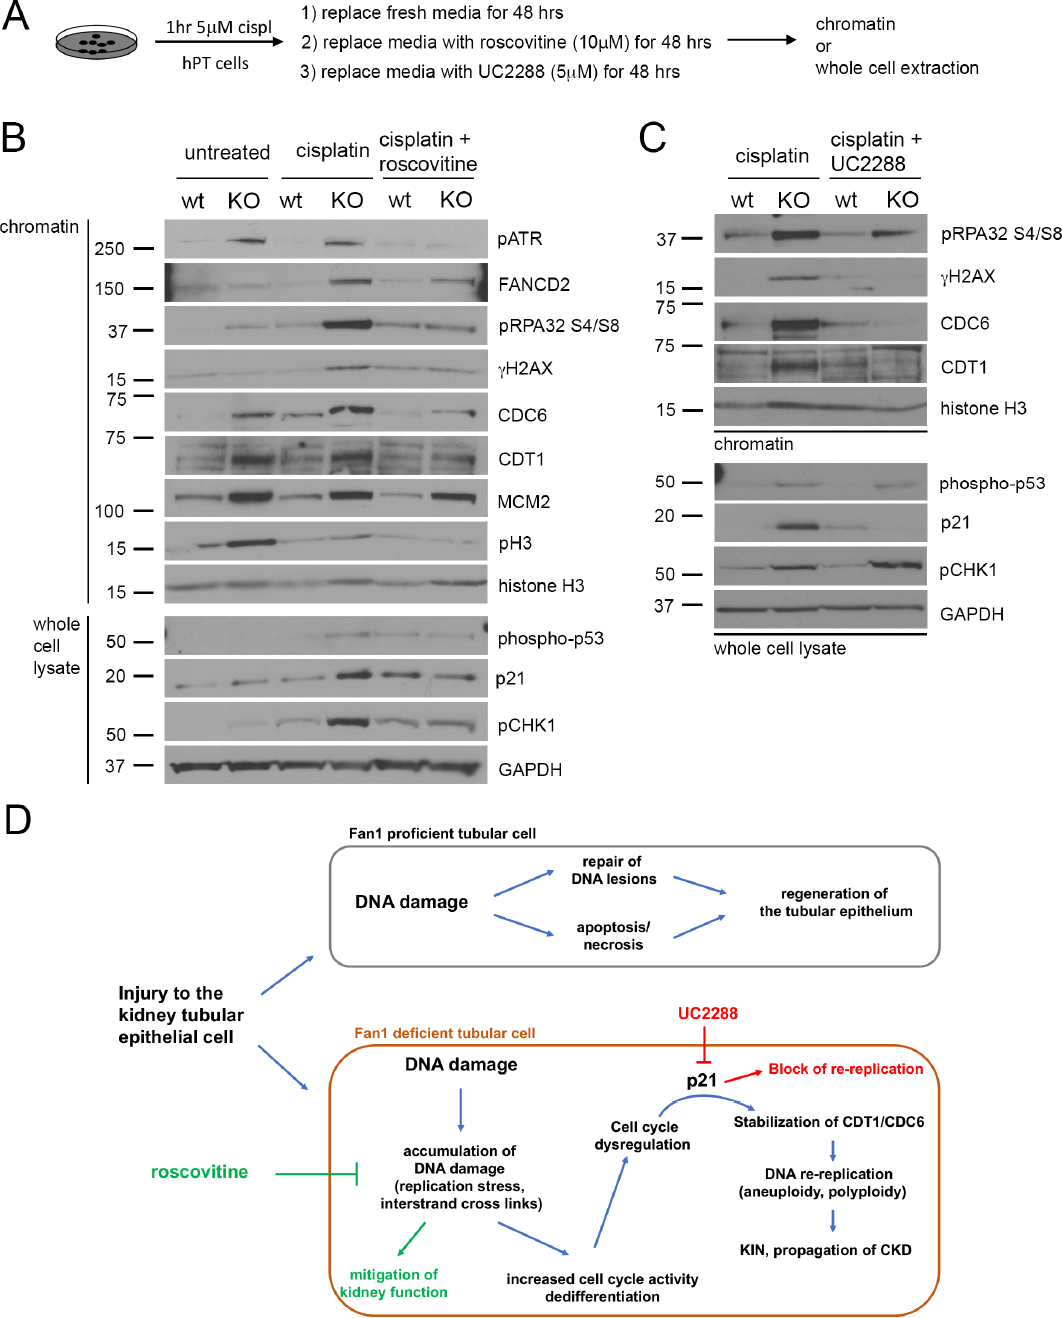
Defective DNA repair pathways contribute to the development of chronic kidney disease (CKD) in humans. However, the molecular mechanisms underlying DNA damage-induced CKD pathogenesis are not well understood. Here, we investigated the role of tubular cell DNA damage in the pathogenesis of CKD using mice in which the DNA repair protein Fan1 was knocked out. The phenotype of these mice is orthologous to the human DNA damage syndrome, karyomegalic interstitial nephritis (KIN). Inactivation of Fan1 in kidney proximal tubule cells sensitized the kidneys to genotoxic and obstructive injury characterized by replication stress and persistent DNA damage response activity. Accumulation of DNA damage in Fan1 tubular cells induced epithelial dedifferentiation and tubular injury. Characteristic to KIN, cells with chronic DNA damage failed to complete mitosis and underwent polyploidization. In vitro and in vivo studies showed that polyploidization was caused by the overexpression of DNA replication factors CDT1 and CDC6 in FAN1 deficient cells. Mechanistically, inhibiting DNA replication with Roscovitine reduced tubular injury, blocked the development of KIN and mitigated kidney function in these Fan1 knockout mice. Thus, our data delineate a mechanistic pathway by which persistent DNA damage in the kidney tubular cells leads to kidney injury and development of CKD. Furthermore, therapeutic modulation of cell cycle activity may provide an opportunity to mitigate the DNA damage response induced CKD progression.

Keywords: DNA damage; DNA re-replication; FAN1; chronic kidney disease; karyomegalic interstitial nephritis.


Figures

Figure 1.
Figure 1.. Loss of Fan1 sensitizes kidneys to genotoxic and obstructive tubular injury.
(A) Schematics of the generation of proximal tubule-specific Fan1 knockout (Fan1 KO) mice, by crossing Ggt1Cre;Fan1+/loxP mice with Fan1loxP/loxP mice. (B) Ggt1-Cre activity is restricted to the proximal segment of the nephron, demonstrated by the co-staining of Lotus tetranogolobus agglutinin (LTL) and anti-GFP antibody in double transgenic mice but not in Ggt1Cre- mice. Scale bar 25 μm. (C) Schematic diagram of the repeated low dose cisplatin injury protocol. Mice were administered cisplatin weekly at 2mg/kg for 5 weeks, and tissues were collected for analysis 1 week after the last treatment dose. (D) Histological analysis of kidney sections by Periodic acid–Schiff (PAS) staining demonstrated the formation of KIN in Fan1 KO mice, characterized by tubular atrophy, formation of karyomegalic nuclei (green arrowheads) and segmental basement membrane thickening (black arrowheads) in the proximal tubules. Scale bars 50 μm. (E) Tubular injury scores in control mice compared with Fan1 KO kidneys after low dose cisplatin administration, cisplatin ctrl 0.1±0.1 vs cisplatin Fan1 KO 4.7±0.1, ****p<0.0001, n=5 each. (F) Blood urea nitrogen (BUN) measurements in ctrl and Fan1 KO mice show loss of kidney function in Fan1 KO mice after induction of KIN; cisplatin ctrl 31.2±2.9 vs cisplatin Fan1 KO 188.6±7.2, ****p<0.0001, n=5 each. (G) Schematics of the unilateral ureteral obstruction (UUO) kidney injury model. (H) PAS staining of sham and UUO kidneys at day 4 reveals more extensive tubular dilations in Fan1 KO kidneys compared with control kidneys. Scale bar 100 μm. (I) Tubular injury scores in control mice compared to Fan1 KO kidneys after 4 days of UUO, ctrl 1.6±0.2 vs Fan1 KO 4.2±0.1, ****p<0.0001, n=5 each. (E,F,I) Data are presented as the mean ± SEM. A 2-way ANOVA with Tukeys’ post hoc analysis.
Figure 2.
Figure 2.. Persistent DNA damage induces the expression of tubular injury biomarkers in Fan1 KO kidneys.
(A) KIM1 expression analysis by immunofluorescence staining in control and Fan1 KO kidneys after cisplatin injury. Scale bar 75 μm. Quantification of the KIM1-positive area in LTL-positive proximal tubules shows a significant upregulation of KIM1 in Fan1 KO kidneys (ctrl 2.5±0.4% vs Fan1 KO 17.8±1.6%, ****p<0.0001), n=5 each. (B) Increased Havcr1/KIM1 expression in cisplatin treated Fan1 KO kidneys was confirmed by qPCR analysis (ctrl 1.6±0.3 vs Fan1KO 6.9±0.6, ****p<0.0001), n=5 each. (C) qPCR analysis revealed increased Lcn2/NGAL expression in cisplatin treated Fan1 KO kidneys (ctrl 6.1±1.8 vs Fan1 KO 110.7±8.4, ****p<0.0001), n=5 each. (D) KIM1 expression analysis by immunofluorescence staining in control and Fan1 KO kidneys 4 days after unilateral ureteral obstruction (UUO). Scale bar 100 μm. Quantification of the KIM1-positive area in LTL-positive proximal tubules shows higher KIM1 expression in Fan1 KO UUO kidneys (ctrl 23.5% ± 4.7% vs Fan1 KO 47.4% ± 8.4% %, *p<0.05, ****p<0.0001), n=5 each. (E) Increased Havcr1/KIM1 expression in Fan1 KO UUO kidneys compared to control UUO kidneys was confirmed by qPCR (ctrl 44.3±2.7 vs Fan1 KO 80.3±7.5, ****p<0.0001), n=5 each. (F) qPCR analysis did not reveal significant alterations in Lcn2/Ngal expression between Fan1 KO and control kidneys after 4 days of UUO (ctrl 32.9±4.3 vs Fan1 KO 32.6±2.1, ns), n=5 each. (A-F) Data are presented as the mean ± SEM. A 2-way ANOVA with Tukeys’ post hoc analysis.
Figure 3.
Figure 3.. Transcriptional profiling of Fan1 KO kidneys after induction of KIN.
(A) Heatmap of the DEG list for all conditions. n=3 mice for each experimental group. (B, C) Volcano plots of the DEG list for untreated control and Fan1 KO kidneys (B), and cisplatin treated control and Fan1 KO kidneys (C). The thresholds were set at the values of fold change > 2 and FDR < 0.05. (D) Top-ranked functional clusters that were differentially expressed in control vs. Fan1 KO kidneys in response to cisplatin treatment. (E) Gene-set enrichment signature of DNA repair genes in cisplatin-treated Fan1 KO vs control kidneys. (F) qPCR analysis of the interstrand cross-link repair genes Exo1 (ctrl 2.6±0.4 vs Fan1 KO 15.8±1.0, ****p<0.0001) and Ercc1 (ctrl 1.1±0.1 vs Fan1 KO 1.8±0.1, ****p<0.0001) in cisplatin Fan1 KO kidneys. n=5 each. (G) qPCR analysis of the homologous recombination genes Brca1 (ctrl 1.0±0.2 vs Fan1 KO 2.9±0.3, ***p<0.001) and Rad51 (ctrl 0.9±0.2 vs Fan1 KO 4.3±0.6, ****p<0.0001) in cisplatin Fan1 KO kidneys. n=5 each. (H) Gene-set enrichment signature of G2/M checkpoint genes in cisplatin-treated Fan1 KO vs control kidneys. (I) qPCR analysis of the cell cycle position genes AurkB (ctrl 1.5±0.3 vs Fan1 KO 6.9±0.6, ****p<0.0001), Pkmyt1 (ctrl 1.0±0.2 vs Fan1 KO 2.5±0.2, ***p<0.001) and Birc5 (ctrl 1.7±0.2 vs Fan1 KO 8.6±1.0, ****p<0.0001) in cisplatin Fan1 KO kidneys, n=5 each. (F,G,I) Data are presented as the mean ± SEM. A 2-way ANOVA with Tukeys’ post hoc analysis.
Figure 4.
Figure 4.. DNA damage causes aberrant cell cycle activity in Fan1 KO kidneys.
(A) Heatmap of a selection of key cell cycle regulating genes that were upregulated in the RNAseq analysis of Fan1 KO kidneys after cisplatin injury. (B) Western blot of cell proliferation markers - pRB (S807/811), PCNA and CDK6, in untreated and cisplatin treated kidneys. Gapdh was used as a loading control. (C) qPCR validation of the increased expression of Ccne1 and Ccnb1 in cisplatin Fan1 KO kidneys. Ccne1 (ctrl 1.3±0.4 vs Fan1 KO 5.2±0.8, ****p<0.0001), Ccnb1 (ctrl 0.7±0.1 vs Fan1 KO 2.6±0.4, ****p<0.0001), n=5 each. (D) Immunohistochemistry against CCNA and CCND1. The number of CCNA+ cells is increased in cisplatin Fan1 KO kidneys compared with controls. Quantification of CCNA+ nuclei in in 6 random cortical fields (cisplatin ctrl 2.2±0.9 vs cisplatin Fan1 KO 16.0±0.9, ****p<0.0001, n=5 each cohort). Nuclear accumulation of Cyclin D1 (red arrowheads) was observed only in cisplatin treated Fan1 KO kidneys. Quantification of CCND1+ nuclei in 6 random cortical fields (cisplatin treated ctrl 0.0±0.0 vs cisplatin Fan1 KO 14.0±2.6, n=5 each cohort, **p<0.01). Scale bar 50 μm. (E) Immunofluorescent (IF) analysis of the DNA damage marker γH2AX (green) and minichromosome maintenance protein 6, MCM6 (red) revealed their co-expression in the giant nuclei in cisplatin treated Fan1 KO kidneys, but not in control kidneys. Scale bar 25 μm. (C,D) Data are presented as the mean ± SEM. A 2-way ANOVA with Tukeys’ post hoc analysis.
Figure 5.
Figure 5.. Karyomegalic cells fail to complete mitosis.
(A) qPCR analysis shows that Tp53 and Cdkn1a/p21 expression is upregulated in Fan1 KO kidneys after cisplatin injury, Tp53 (ctrl 1.0±0.1 vs Fan1 KO 2.1±0.2, ****p<0.001) and Cdkn1a (ctrl 9.7±1.3 vs Fan1 KO 29.4±4.4, ****p<0.01), n=5 each. (B) Immunohistochemistry against p21 reveals that p21 is expressed in the karyomegalic nuclei Fan1 KO kidneys. The number of p21-positive nuclei were counted in 5 cortical 200x fields per sample (n=5 samples per each cohort, ****p<0.0001). Insets show a magnified view of a proximal tubule. Scale bar 100 μm. (C) Immunofluorescence staining of Fan1 KO kidneys with Ki67 (green) and p21 (red) shows that a subset of Ki67-positive cells which co-stain with p21. Quantification of the double positive cells shows that ~22% of Ki67+ cells are positive for p21 (0.00 vs 22.36±1.83, ****p<0.0001). (D) Nuclear area measurement of Ki67/p21 double positive cells in cisplatin treated Fan1 KO kidney proximal tubules (PT) compared to randomly selected nuclei in the PT of control kidneys demonstrates increased nuclear area of the double positive cells (28.7±0.8 n=100 vs 46.8±3.2 n=44, ****p<0.0001). (E) Detection of G2 and M cell cycle positions with anti-phospho-histone 3 (pH3) antibody in untreated and cisplatin-treated control and Fan1 KO kidneys sections. Quantification of cells in G2 cell cycle position (untreated ctrl 1.0±0.5, untreated Fan1 KO 2.3±0.5, cisplatin ctrl 3.0±1.3, cisplatin Fan1 KO 20.0±3.7, **p<0.01, n=5, each dot = 1ROI). Scale bar 50 μm. (F) Quantification of the ratio of cells in G2 vs M cell cycle phases demonstrates that ~5 fold more cells are in G2 phase vs M phase in cisplatin treated Fan1 KO kidneys compared to other conditions (untreated ctrl 0.8±0.4, untreated Fan1 KO 1.1±0.4, cisplatin ctrl 0.7±0.3, cisplatin Fan1 KO 3.3±0.6, **p<0.01, n=5, each dot = 1ROI). (A,B,C,E,F) Data are presented as the mean ± SEM. A 2-way ANOVA with Tukeys’ post hoc analysis.
Figure 6.
Figure 6.. Roscovitine administration mitigates cisplatin injury in Fan1 KO mice.
(A) Overview of roscovitine and low dose cisplatin administration protocol. Roscovitine (150 mg/kg) was administered via ip 1 hour before cisplatin (2 mg/kg), and tissues collected on week 6 after the start of the procedure. R – roscovitine, C – cisplatin. (B) Quantification of PCNA-positive cells in cisplatin and roscovitine/cisplatin treated kidneys reveals that roscovitine treatment blocks S phase cell cycle activity in cisplatin-treated Fan1 KO mice (n=4 mice; *p<0.01, ***p<0.001). (C) Quantification of EdU-positive cells in cisplatin and roscovitine/cisplatin treated kidneys reveals that roscovitine treatment effectively blocks DNA replication in cisplatin-treated Fan1 KO mice (n=4 mice; ****p<0.0001). (D) Quantification of γH2AX-positive cells in cisplatin and roscovitine/cisplatin treated kidneys reveals that roscovitine treatment reduces DNA damage in cisplatin-treated Fan1 KO mice (n=4 mice; ****p<0.0001). (E) IF staining of LTL (green) and MCM6 (red) in cisplatin and roscovitine/cisplatin treated Fan1 KO kidneys. Roscovitine treatment blocks the expression of MCM6 and the formation of karyomegalic nuclei in Fan1 KO proximal tubule cells. Scale bar 50 μm. (F) Quantification of the nuclear area in proximal tubules of cisplatin and roscovitine/cisplatin treated kidneys demonstrates that roscovitine treatment prevents karyomegaly in Fan1 KO kidneys (cisplatin ctrl 34.4±0.9; cisplatin Fan1 KO 51.9±1.7; R+cispl ctrl 34.1±0.9; R+cispl Fan1 KO 33.7±0.9; ****p<0.0001, n=100 nuclei each). (G) Quantification of KIM1-positive area in proximal tubules demonstrates that roscovitine administration leads to significant reduction in KIM1 expression in cisplatin treated Fan1 KO kidneys (cisplatin Fan1 KO 12.9±1.9% vs R+cisplatin Fan1 KO 3.7±0.6%, ****p<0.0001), n=4 each. (H) Blood urea nitrogen measurements in control, cisplatin treated, and roscovitine/cisplatin treated mice. Roscovitine improves kidney function in cisplatin treated Fan1 KO mice, (n=3–4 each; ****p<0.0001). (B,C,D,G,H) Data are presented as the mean ± SEM. A 2-way ANOVA with Tukeys’ post hoc analysis.
Figure 7.
Figure 7.. Human FAN1 knockout proximal tubular epithelial cells undergo DNA re-replication in response to genotoxic damage.
(A) Overview of cisplatin treatment in FAN1 KO hPTEC cells. (B) γH2AX staining on parental and FAN1 KO hPTEC cells. Scale bar 20 μm. (C) pATM staining on parental and FAN1 KO hPTEC cells. Scale bar 20 μm. (D) Quantification of γH2AX and pATM foci numbers per nucleus in the parental and FAN1 KO hPTEC cells, based on the experiments in B and C. n=100 nuclei each condition. ***p<0.001, ****p<0.0001. Data are presented as the mean ± SEM, non-parametric Kruskal-Wallis test. (E) Increased nuclear area of FAN1 KO hPTEC cells vs the parental cell line after cisplatin treatment. DAPI staining was used to measure the nuclear area, based on the experiments in B and C. **p<0.01, ****p<0.0001. Data are presented as the mean ± SEM, non-parametric Kruskal-Wallis test. (F) Western blotting of DNA repair pathway markers in hPTECs chromatin preparation reveal the activation of Fanconi anemia repair pathway (ubiquitination of FANCD2, marked by a star), increased levels of replication stress (pRPA32 S4/S8) and DNA double-strand breaks (γH2AX) in cisplatin treated FAN1 KO cells. Histone H3 is used as a chromatin loading control. (G) Parental and FAN1 KO tFucci(SA)5 hPTECs were treated with cisplatin at 5 μM for 1 hour, as in (A) and cell cycle distribution analyzed by flow cytometry. Cells showing red fluorescence (AzaleaB5(+) and h2–3(−)) are in G1, yellow (AzaleaB5(+) and h2–3(+)) in G1/S, and green (AzaleaB5(−) and h2–3(+)) in late-S/G2/M cell cycle phases. Black contour lines indicate DNA content based on DAPI staining. N values denote DNA content as a multiple of the normal haploid genome. The percentage of cells with a DNA content >4N (polyploid cells) is shown. Untreated parental and FAN1 KO hPTECs have similar cell cycle profiles. Exposure to cisplatin results in FAN1 KO hPTEC accumulation in late-S/G2/M cell cycle phases during which aberrant endoreplication or re-replication occurs, giving rise to polyploidy. Subsequently (by day 7 after cisplatin), polyploid hPTECs exit the cell cycle and express only the G1-specific Fucci reporter gene. These data demonstrate that polyploidization in injured FAN1 KO hPTECs does not result in a simple duplication of the genome that would be detectable by the presence of distinct peaks corresponding to 4N, 8N, 16N etc in the DNA content profile. Instead, the cells show a DNA content profile that is skewed to the right, indicative of unequal chromosome amplification (aneuploidy). It is possible, however, that a subset of the polyploid cells are in a tetraploid G1 state (4N). These data represent three independent experiments.
Figure 8.
Figure 8.. Inhibiting cell cycle activity or p21 expression blocks DNA re-replication in FAN1 KO hPTECs.
(A) Schematics of roscovitine and UC2288 treatment in FAN1 KO hPTEC cells. (B) Representative Western blot images of DNA replication licensing proteins and DNA damage markers in control, cisplatin treated and cisplatin + roscovitine treated parental and FAN1 KO hPTECs. Proteins were detected either in chromatin extractions or total cell lysates, as indicated. Histone H3 was used as a loading control for chromatin and GAPDH for whole cell lysate. (C) Representative Western blot images of DNA replication licensing proteins and DNA damage markers in cisplatin treated and cisplatin + UC2288 treated parental and FAN1 KO hPTECs. Proteins were detected either in chromatin extractions or total cell lysates, as indicated. Histone H3 was used as a loading control for chromatin and GAPDH for whole cell lysate. (D) Model of DNA damage induced cell cycle abnormalities in a DNA repair deficient proximal tubular cell. Kidney proximal tubule cells with proficient DNA repair will resolve non-lethal DNA damage and regenerate the injured tubule. In contrast, DNA repair deficient cells will accumulate DNA damage through replication stress, which leads to abnormal cell cycle activity and p21-dependent stabilization of CDT1 and CDC6. p21 expressing tubular cells undergo DNA re-replication, which propagates further genomic instability and progression to CKD.

Comment in

References

    1. Lv JC, Zhang LX. Prevalence and Disease Burden of Chronic Kidney Disease. Adv Exp Med Biol 2019; 1165: 3–15. - PubMed
    1. Sarnak MJ, Levey AS, Schoolwerth AC, Coresh J, et al. Kidney disease as a risk factor for development of cardiovascular disease: a statement from the American Heart Association Councils on Kidney in Cardiovascular Disease, High Blood Pressure Research, Clinical Cardiology, and Epidemiology and Prevention. Hypertension 2003; 42: 1050–1065. - PubMed
    1. Canaud G, Bonventre JV. Cell cycle arrest and the evolution of chronic kidney disease from acute kidney injury. Nephrol Dial Transplant 2015; 30: 575–583. - PMC - PubMed
    1. Chang-Panesso M, Kadyrov FF, Lalli M, Wu H, et al. FOXM1 drives proximal tubule proliferation during repair from acute ischemic kidney injury. J Clin Invest 2019; 129: 5501–5517. - PMC - PubMed
    1. Kirita Y, Wu H, Uchimura K, Wilson PC, et al. Cell profiling of mouse acute kidney injury reveals conserved cellular responses to injury. Proc Natl Acad Sci U S A 2020; 117: 15874–15883. - PMC - PubMed

Publication types