. 2022 Nov 1:261:119532.
doi: 10.1016/j.neuroimage.2022.119532. Epub 2022 Aug 2.

Decoding the temporal dynamics of affective scene processing

Affiliations

Decoding the temporal dynamics of affective scene processing

Ke Bo et al. Neuroimage. .

Abstract

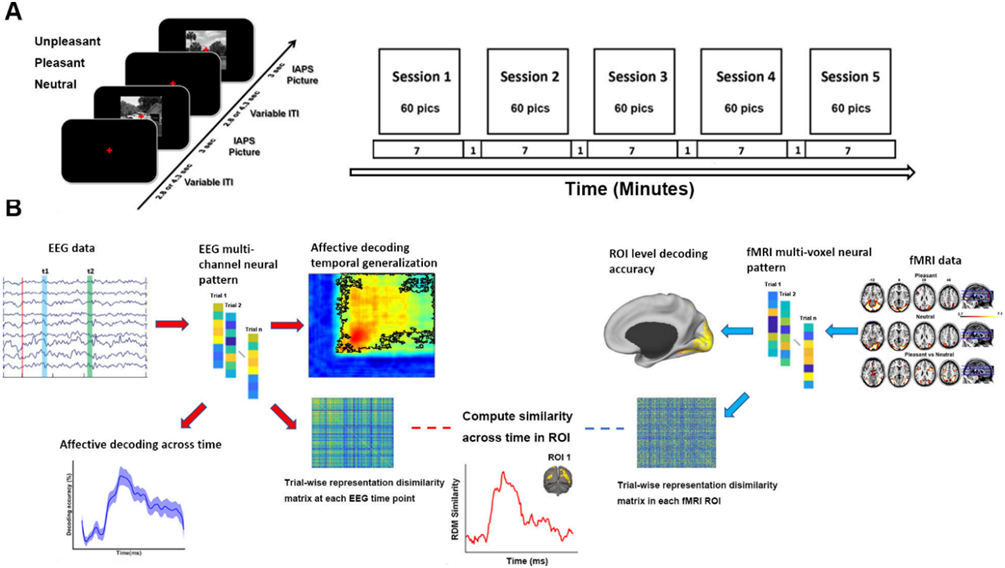
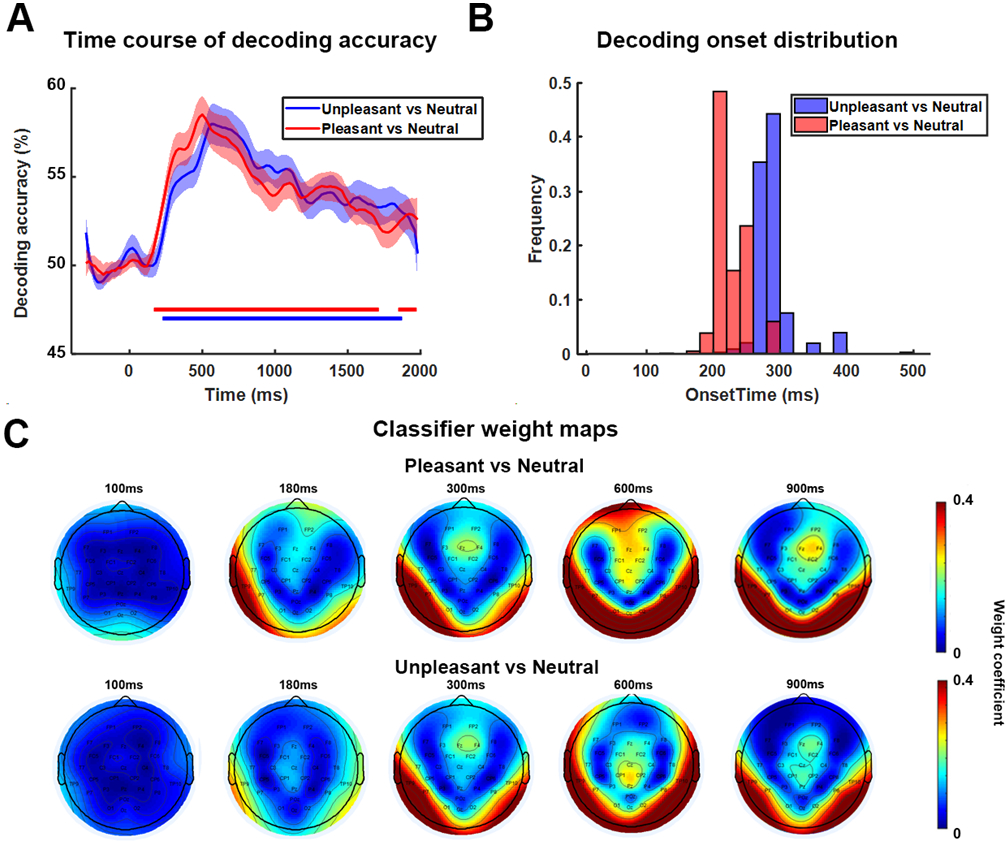
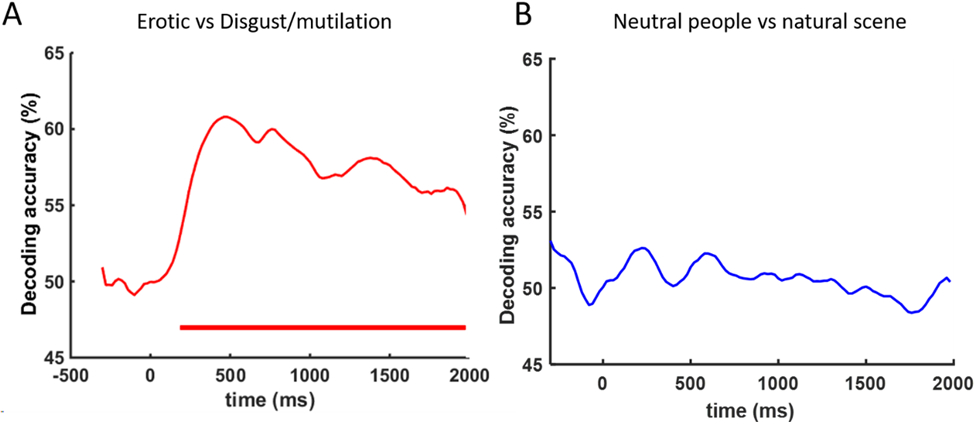
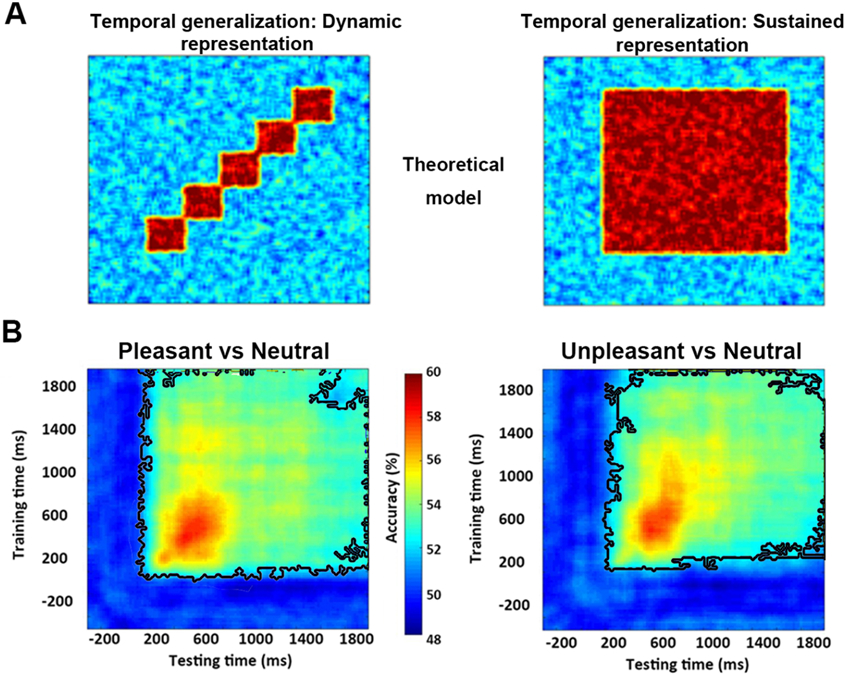
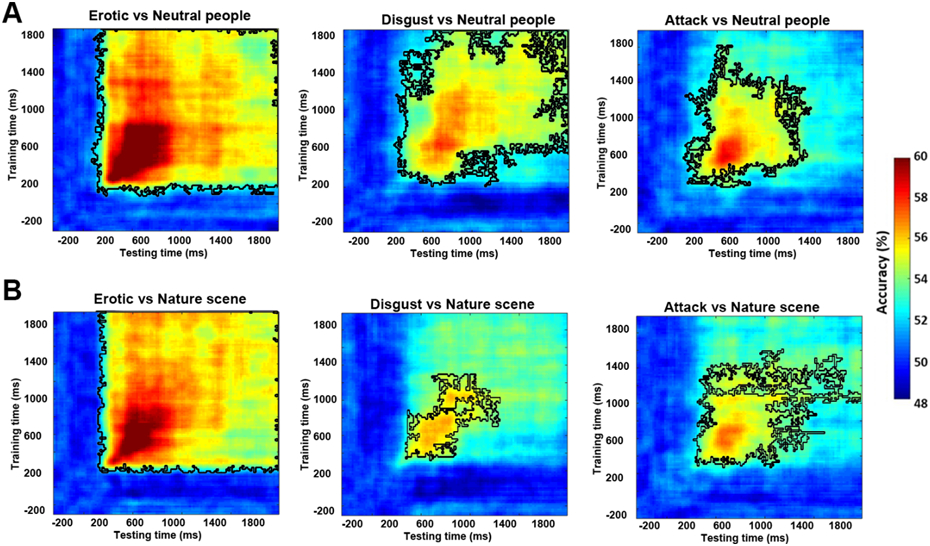
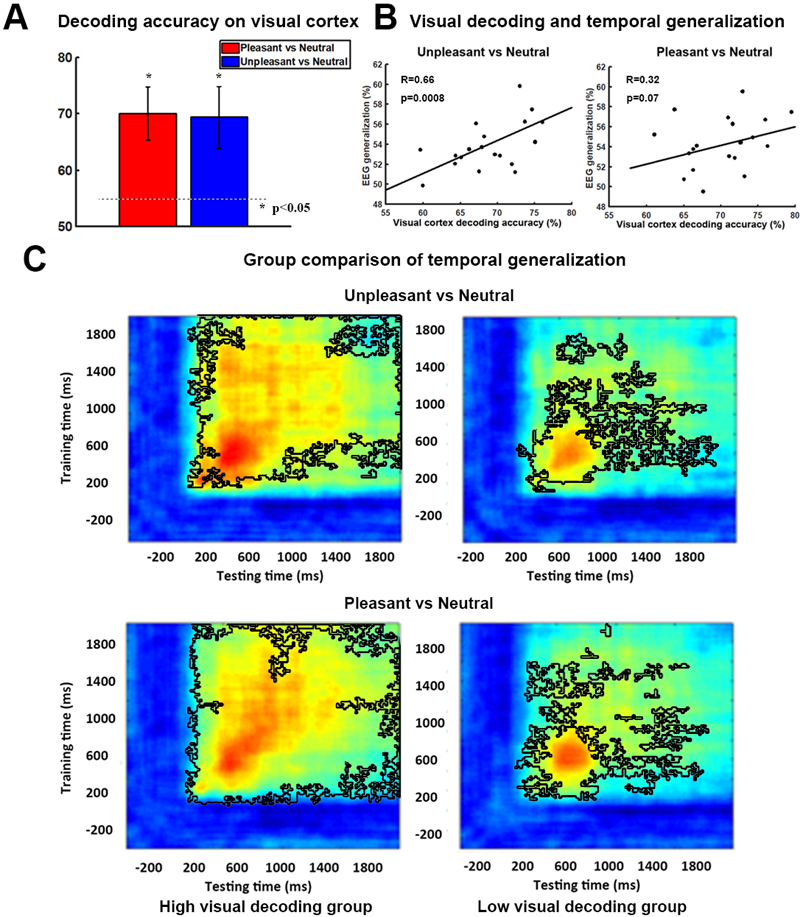
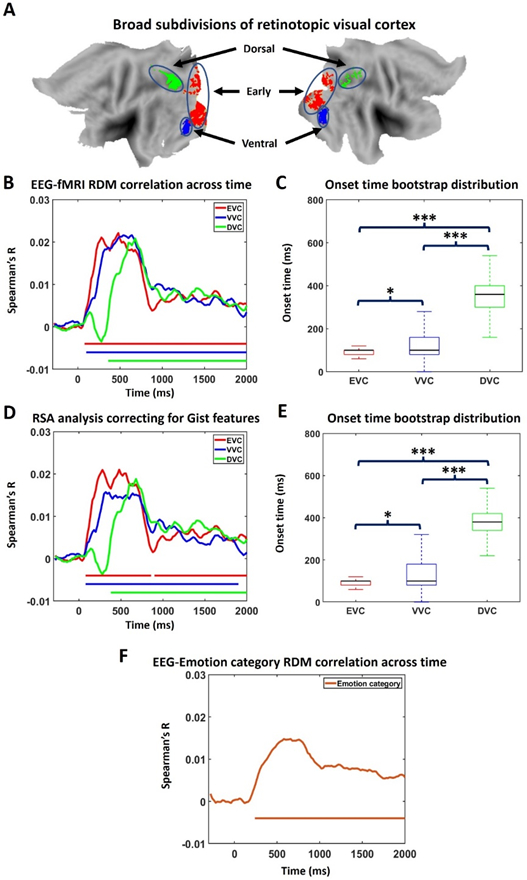
Natural images containing affective scenes are used extensively to investigate the neural mechanisms of visual emotion processing. Functional fMRI studies have shown that these images activate a large-scale distributed brain network that encompasses areas in visual, temporal, and frontal cortices. The underlying spatial and temporal dynamics, however, remain to be better characterized. We recorded simultaneous EEG-fMRI data while participants passively viewed affective images from the International Affective Picture System (IAPS). Applying multivariate pattern analysis to decode EEG data, and representational similarity analysis to fuse EEG data with simultaneously recorded fMRI data, we found that: (1) ∼80 ms after picture onset, perceptual processing of complex visual scenes began in early visual cortex, proceeding to ventral visual cortex at ∼100 ms, (2) between ∼200 and ∼300 ms (pleasant pictures: ∼200 ms; unpleasant pictures: ∼260 ms), affect-specific neural representations began to form, supported mainly by areas in occipital and temporal cortices, and (3) affect-specific neural representations were stable, lasting up to ∼2 s, and exhibited temporally generalizable activity patterns. These results suggest that affective scene representations in the brain are formed temporally in a valence-dependent manner and may be sustained by recurrent neural interactions among distributed brain areas.

Keywords: EEG; Emotion, affective scenes; IAPS; Multivariate pattern analysis; Representation similarity analysis; Visual cortex; fMRI.


Figures

Figure 1.
Figure 1.
Experimental paradigm and data analysis pipeline. A) Affective picture viewing paradigm. Each recording session lasts seven minutes. 60 IAPS pictures including 20 pleasant, 20 unpleasant and 20 neutral pictures were presented in each session in random order. Each picture was presented at the center of screen for 3 seconds and followed by a fixation period (2.8 or 4.3 seconds). Participants were required to fixate the red cross at the center of the screen throughout the session while simultaneous EEG-fMRI was recorded. B) Analysis pipeline illustrating the methods used at different stages of the analysis (see text for more details).
Figure 2.
Figure 2.
Decoding EEG data between affective and neutral scenes across time. A) Decoding accuracy time courses. B) Bootstrap distributions of above-chance decoding onset times. Subjects are randomly selected with replacement and onset time was computed for each bootstrap resample (a total of 1000 resamples were considered). C) Weight maps showing the contribution of different channels to decoding performance at different times.
Figure 3.
Figure 3.
Further decoding analysis testing the influence of valence vs arousal. A) EEG decoding between Erotic (normative valence: 6.87, arousal: 6.30) vs Disgust/Mutilation pictures (normative valence: 2.81, arousal: 6.00). Red horizontal bar indicates period of above chance decoding (FDR p<0.05). B) EEG decoding between Neutral people (normative valence: 5.5, arousal: 3.5) vs Natural scenes/adventure (normative valence: 7.0, arousal: 5.4). Above chance level decoding is not found.
Figure 4.
Figure 4.
Temporal generalization analysis. Classifier trained at each time point was tested on all other time points in the time series. The decoding accuracy at a point on this plane reflects the performance at time tx of the classifier trained at time ty. A) Schematic temporal generalizations of dynamic or transient (Left) vs sustained or stable (Right) neural representations. B) Temporal generalization for decoding between pleasant vs neutral (Left) and between unpleasant vs neutral (Right). Wilcox sign-rank test applied at each pixel in the temporal generalization map to test the significance of decoding accuracy against 50% (chance level). The corresponding p value is corrected for multiple comparisons according to FDR p<0.05. Cluster size is further controlled (>10 points). Back contours enclose pixels with above chance decoding accuracy.
Figure 5.
Figure 5.
Temporal generalization analysis for subcategories of affective scenes. A) Decoding emotion subcategories against neutral people. B) Decoding emotion subcategories against natural scenes. See Figure 4 for explanation of notations.
Figure 6.
Figure 6.
Visual cortical contribution to stable representations of affect. A) fMRI decoding accuracy in visual cortex. P<0.05 threshold indicated by the dashed line. B) Correlation between strength of EEG temporal generalization and fMRI decoding accuracy in visual cortex. C) Subjects are divided into two groups according to their fMRI decoding accuracy in visual cortex. Temporal generalization for unpleasant vs neutral (Upper) and pleasant vs neutral (Lower) was shown for each group (high accuracy group on the Left vs low accuracy group on the Right). Black contours outline the statistically significant pixels (p<0.05, FDR).
Figure 7.
Figure 7.
Representational similarity analysis (RSA). A) Regions of interest (ROIs): early visual cortex (EVC), ventral visual cortex (VVC), and dorsal visual cortex (DVC). B) Similarity between EEG RDM and fMRI RDM across time for the three ROIs. Similarity larger than five baseline standard deviations for more than 5 consecutive time points are marked as statistically significant. C) Onset time of significant similarity for each ROI in B. * Small effect size. *** Large effect size. D) Partial correlation between EEG RDM and fMRI RDM with GIST RDM being set as control variable. E) Onset time of significant similarity for each ROI in D. F) Time course of similarity between EEG RDM and emotion category RDM.

References

    1. Allen PJ, Josephs O, & Turner R (2000). A method for removing imaging artifact from continuous EEG recorded during functional MRI. Neuroimage, 12(2), 230–239. - PubMed
    1. Allen PJ, Polizzi G, Krakow K, Fish DR, & Lemieux L (1998). Identification of EEG events in the MR scanner: the problem of pulse artifact and a method for its subtraction. Neuroimage, 8(3), 229–239. - PubMed
    1. Alho J, Salminen N, Sams M, Hietanen JK, & Nummenmaa L (2015). Facilitated early cortical processing of nude human bodies. Biological Psychology, 109, 103–110. - PubMed
    1. Bae GY, & Luck SJ (2019). Decoding motion direction using the topography of sustained ERPs and alpha oscillations. NeuroImage, 184, 242–255. - PMC - PubMed
    1. Belouchrani A, Abed-Meraim K, Cardoso JF, & Moulines E (1993, May). Second-order blind separation of temporally correlated sources. In Proc. Int. Conf. Digital Signal Processing (pp. 346–351). Citeseer.

Publication types