. 2022 Aug 5;12(1):13490.
doi: 10.1038/s41598-022-17543-y.

Statistical framework to support the epidemiological interpretation of SARS-CoV-2 concentration in municipal wastewater

Affiliations

Statistical framework to support the epidemiological interpretation of SARS-CoV-2 concentration in municipal wastewater

Xiaotian Dai et al. Sci Rep. .

Abstract

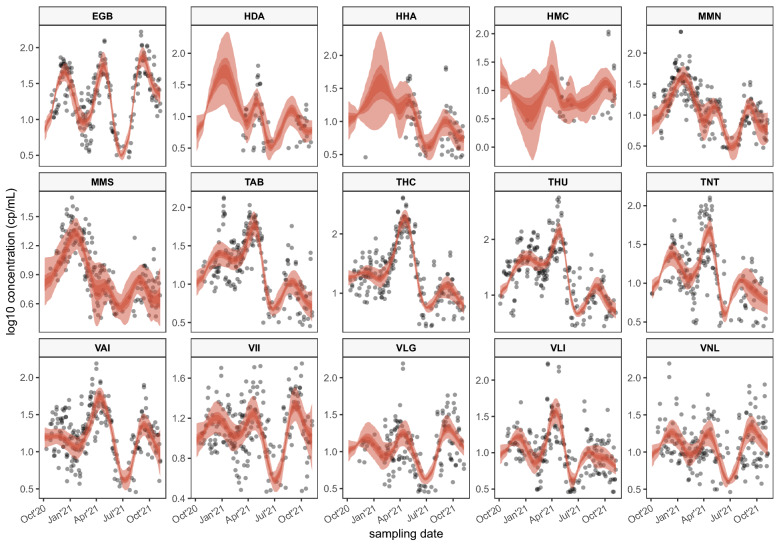
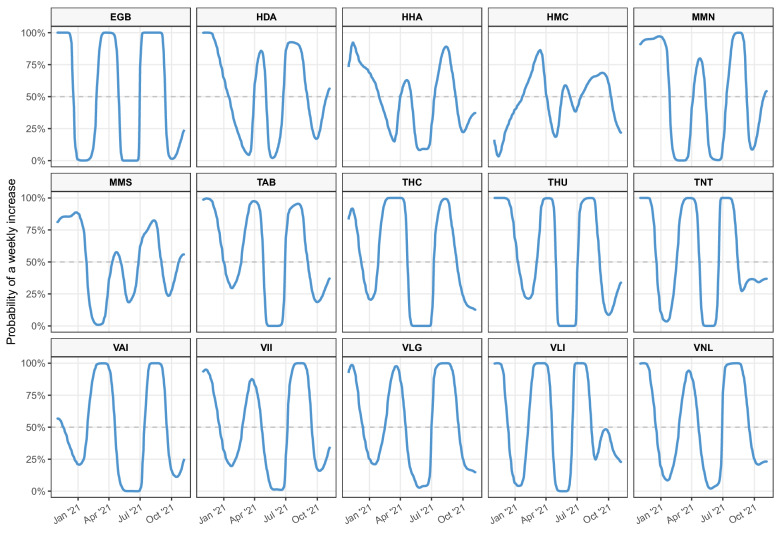
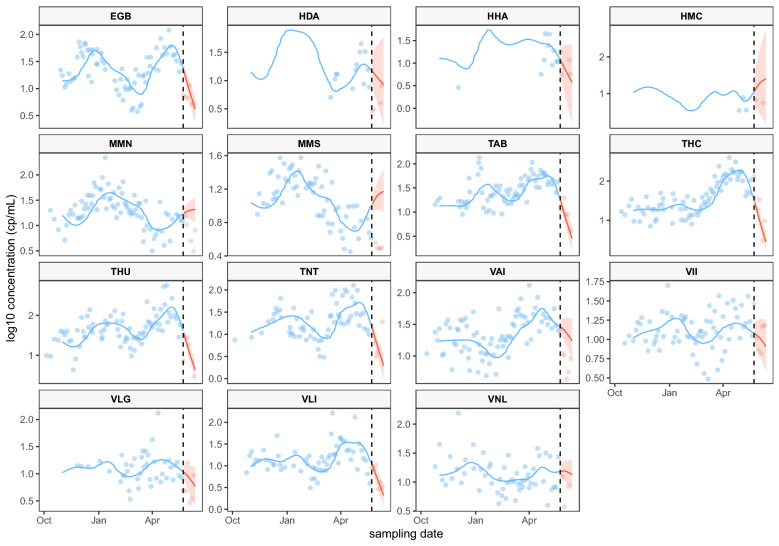
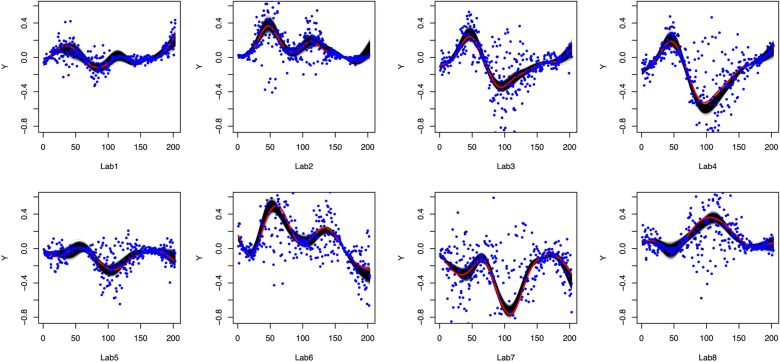
The ribonucleic acid (RNA) of the severe acute respiratory syndrome coronavirus 2 (SARS-Cov-2) is detectable in municipal wastewater as infected individuals can shed the virus in their feces. Viral concentration in wastewater can inform the severity of the COVID-19 pandemic but observations can be noisy and sparse and hence hamper the epidemiological interpretation. Motivated by a Canadian nationwide wastewater surveillance data set, unlike previous studies, we propose a novel Bayesian statistical framework based on the theories of functional data analysis to tackle the challenges embedded in the longitudinal wastewater monitoring data. By employing this framework to analyze the large-scale data set from the nationwide wastewater surveillance program covering 15 sampling sites across Canada, we successfully detect the true trends of viral concentration out of noisy and sparsely observed viral concentrations, and accurately forecast the future trajectory of viral concentrations in wastewater. Along with the excellent performance assessment using simulated data, this study shows that the proposed novel framework is a useful statistical tool and has a significant potential in supporting the epidemiological interpretation of noisy viral concentration measurements from wastewater samples in a real-life setting.


Conflict of interest statement

The authors declare no competing interests.

Figures

Figure 1
Figure 1
Black open circles represent the Log10 transformation of SARS-CoV-2 concentration observations for the N1 assay. Red shaded areas represent the range (lightest area), 50% (darkest area) and 80% credible intervals (slightly lighter area) of posterior curves at each date, from the model with covariates. Each panel represents a sampling location.
Figure 2
Figure 2
Time series of the probability of weekly increase, that is Proba(Y^i(Tit)>Y^i(Ti,t-7)) (D=7) calculated with the comprehensive model (including covariates) for all sampling locations. The horizontal dashed line indicates the 50% probability.
Figure 3
Figure 3
The historic data observed before May 23rd, 2021 (blue points) are used as training data and used to fit the full model (blue line represents the mean posterior curve). The mean posterior curve beyond the last observation date used for fitting is shown in red (red area for the 95% CrI). The red points represent the data forecasted. The forecasting horizon is one calendar month.
Figure 4
Figure 4
The simulation results of the statistical design with σit/|μit|=1. The posterior curves are in black, the truth line is a red line, and simulated observations are blue dots.
Figure 5
Figure 5
Comparing the RMSEs of the three different noise ratio settings with σit/|μit|=0.1, 0.5, and 1, respectively. The SEs of the RMSEs are very small compared to the RMSEs.

References

    1. Ling Y, et al. Persistence and clearance of viral RNA in 2019 novel coronavirus disease rehabilitation patients. Chin. Med. J. 2020;133:1039–1043. doi: 10.1097/CM9.0000000000000774. - DOI - PMC - PubMed
    1. Medema G, Heijnen L, Elsinga G, Italiaander R, Brouwer A. Presence of SARS-Coronavirus-2 RNA in sewage and correlation with reported COVID-19 prevalence in the early stage of the epidemic in the Netherlands. Environ. Sci. Technol. Lett. 2020;7:511–516. doi: 10.1021/acs.estlett.0c00357. - DOI - PubMed
    1. Zhou L, Singh A, Jiang J, Xiao L. Molecular surveillance of Cryptosporidium spp. in raw wastewater in Milwaukee: Implications for understanding outbreak occurrence and transmission dynamics. J. Clin. Microbiol. 2003;41:5254–5257. doi: 10.1128/JCM.41.11.5254-5257.2003. - DOI - PMC - PubMed
    1. Kazama S, et al. Temporal dynamics of norovirus determined through monitoring of municipal wastewater by pyrosequencing and virological surveillance of gastroenteritis cases. Water Res. 2016;92:244–253. doi: 10.1016/j.watres.2015.10.024. - DOI - PubMed
    1. Ahmed W, et al. First confirmed detection of SARS-CoV-2 in untreated wastewater in Australia: A proof of concept for the wastewater surveillance of COVID-19 in the community. Sci. Total Environ. 2020;728:138764. doi: 10.1016/j.scitotenv.2020.138764. - DOI - PMC - PubMed