. 2022 Aug 5;12(1):13474.
doi: 10.1038/s41598-022-16745-8.

Ancient mitochondrial diversity reveals population homogeneity in Neolithic Greece and identifies population dynamics along the Danubian expansion axis

Affiliations

Ancient mitochondrial diversity reveals population homogeneity in Neolithic Greece and identifies population dynamics along the Danubian expansion axis

Nuno M Silva et al. Sci Rep. .

Abstract

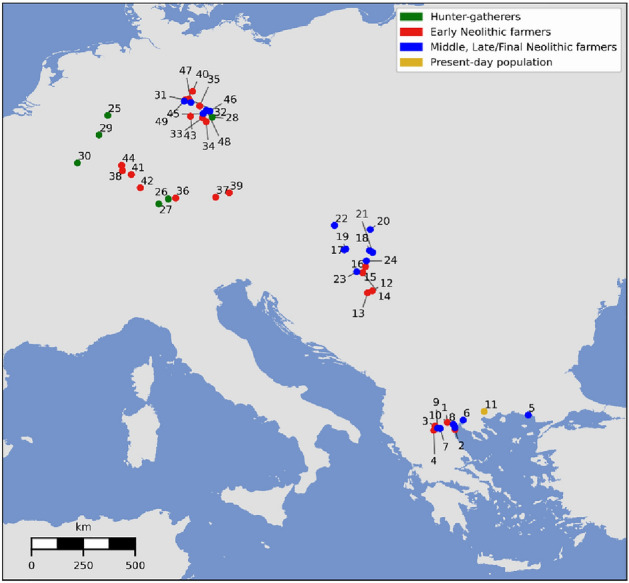
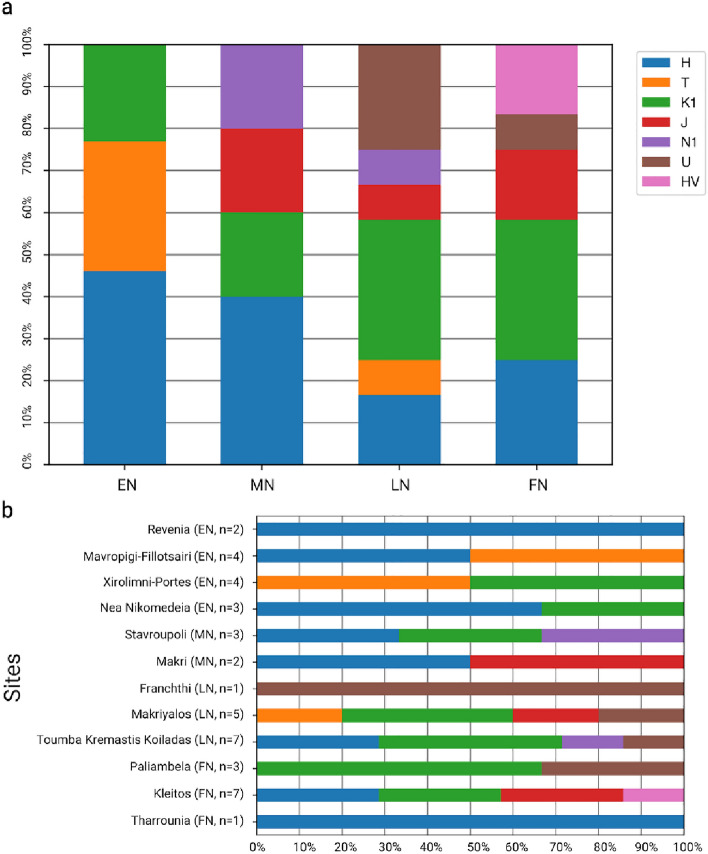
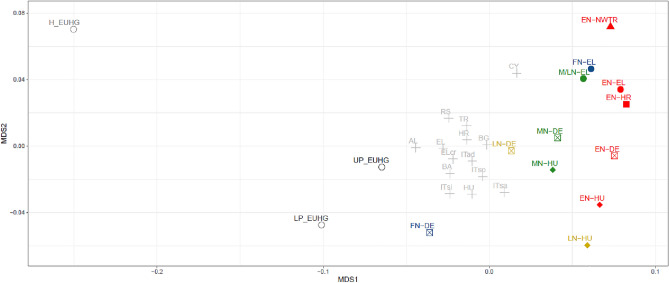
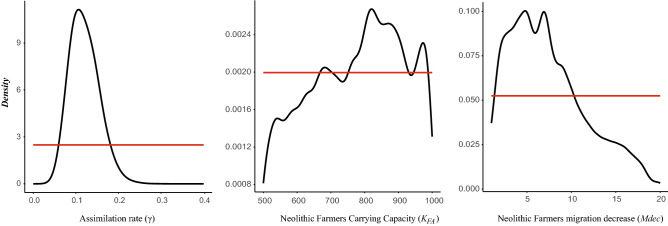
The aim of the study is to investigate mitochondrial diversity in Neolithic Greece and its relation to hunter-gatherers and farmers who populated the Danubian Neolithic expansion axis. We sequenced 42 mitochondrial palaeogenomes from Greece and analysed them together with European set of 328 mtDNA sequences dating from the Early to the Final Neolithic and 319 modern sequences. To test for population continuity through time in Greece, we use an original structured population continuity test that simulates DNA from different periods by explicitly considering the spatial and temporal dynamics of populations. We explore specific scenarios of the mode and tempo of the European Neolithic expansion along the Danubian axis applying spatially explicit simulations coupled with Approximate Bayesian Computation. We observe a striking genetic homogeneity for the maternal line throughout the Neolithic in Greece whereas population continuity is rejected between the Neolithic and present-day Greeks. Along the Danubian expansion axis, our best-fitting scenario supports a substantial decrease in mobility and an increasing local hunter-gatherer contribution to the gene-pool of farmers following the initial rapid Neolithic expansion. Οur original simulation approach models key demographic parameters rather than inferring them from fragmentary data leading to a better understanding of this important process in European prehistory.


Conflict of interest statement

The authors declare no competing interests.

Figures

Figure 1
Figure 1
Geographical distribution of the mtDNA sequences (individual samples) used in the spatially explicit simulation framework. The coloured dots represent the geographical location of the mtDNA lineages from northern Greece (n = 45), central Europe (n = 200) and northern Balkans (n = 83). Hunter-gatherers (n = 19) are represented in green, Early Neolithic farmers (n = 177) in red, Middle and Late/Final Neolithic farmers (n = 132) in blue and present-day Greeks (n = 319) in yellow. Name (indicated in numbers) and precise chronology of the archaeological sites (locations) can be found in Table S4.
Figure 2
Figure 2
(a) Haplogroup frequency at different Neolithic periods in Greece. (b) Haplogroup frequency at different Neolithic sites in Greece (EN: Early Neolithic n = 13, MN: Middle Neolithic, n = 5, LN: Late Neolithic n = 13, FN: Final Neolithic n = 11).
Figure 3
Figure 3
MDS with the 47 Greek Neolithic samples (42 newly sequenced and 5 published, EL, plain circles) and a reference panel of 26 ancient and present-day populations (2470 individuals in total), stress = 0.099 (EN: Early Neolithic, MN: Middle Neolithic, LN: Late Neolithic, FN: Final Neolithic, EUHG: hunter-gatherers, H_EUHG: Holocene EUHG, UP_EUHG: Upper Palaeolithic EUHG, LP_EUHG: Lower Palaeolithic EUHG, NWTR: north western Turkey, EL: Greece, DE: Germany, HR: Croatia, HU: Hungary, grey stars = modern populations abbreviations can be found on Table S3).
Figure 4
Figure 4
Prior (red line) and posterior (black line) distributions of the parameters estimated for the Neolithic expansion along the Danubian route under Scenario SN2. Τhe assimilation rate (γ) corresponding to the maximum gene flow from hunter-gatherer to the Neolithic farmer population, the carrying capacity of Neolithic farmers (KFA), the ratio of decrease of migration rate in Neolithic farmers after the colonization phase (Mdec).

References

    1. Bollongino R, et al. 2000 years of parallel societies in stone age central Europe. Science. 2013;342:479–481. doi: 10.1126/science.1245049. - DOI - PubMed
    1. Bramanti B, et al. Genetic discontinuity between local hunter-gatherers and central Europe’s first farmers. Science. 2009;326:137–140. doi: 10.1126/science.1176869. - DOI - PubMed
    1. Hofmanová Z, et al. Early farmers from across Europe directly descended from Neolithic Aegeans. Proc. Natl. Acad. Sci. 2016;113:6886–6891. doi: 10.1073/pnas.1523951113. - DOI - PMC - PubMed
    1. Kilinç GM, et al. The demographic development of the first farmers in Anatolia. Curr. Biol. 2016;26:2659–2666. doi: 10.1016/j.cub.2016.07.057. - DOI - PMC - PubMed
    1. Kilinç GM, et al. Archaeogenomic analysis of the first steps of Neolithization in Anatolia and the Aegean. Proc. R. Soc. B Biol. Sci. 2017;284:20172064. doi: 10.1098/rspb.2017.2064. - DOI - PMC - PubMed

Publication types