. 2022 Aug 5;12(1):13463.
doi: 10.1038/s41598-022-16509-4.

A systems immunology approach to investigate cytokine responses to viruses and bacteria and their association with disease

Affiliations

A systems immunology approach to investigate cytokine responses to viruses and bacteria and their association with disease

Lijing Lin et al. Sci Rep. .

Abstract

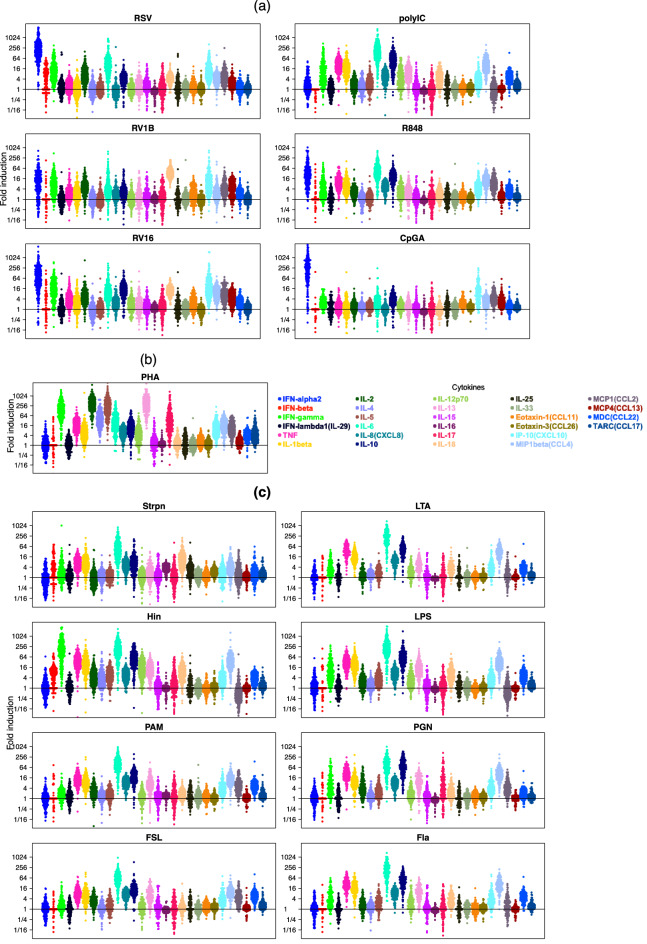
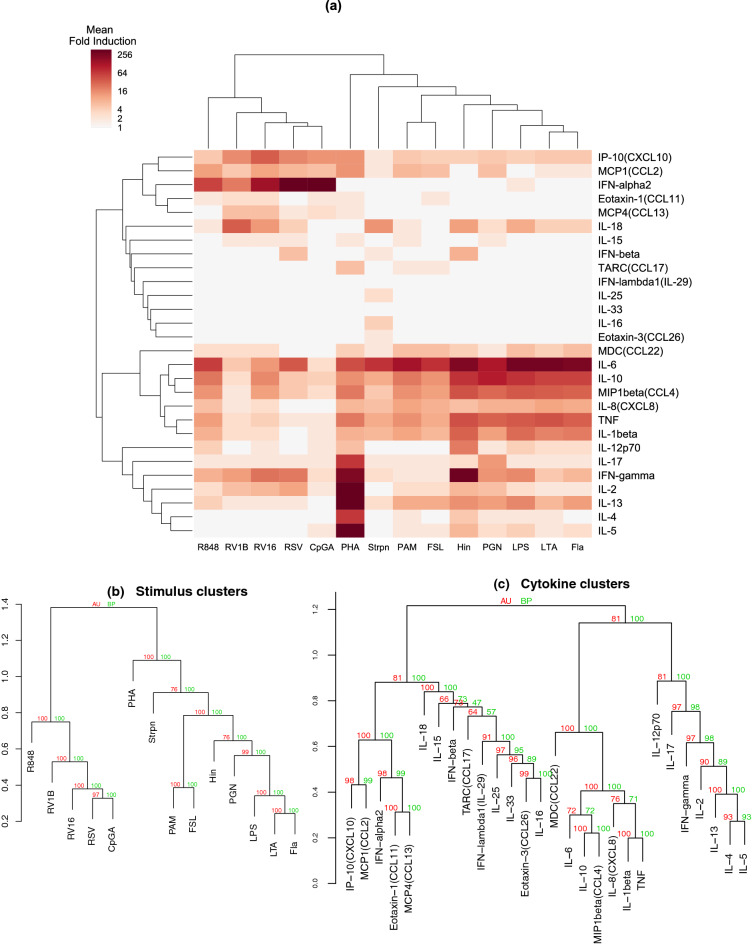
Patterns of human immune responses to viruses and bacteria and how this impacts risk of infections or onset/exacerbation of chronic respiratory diseases are poorly understood. In a population-based birth cohort, we measured peripheral blood mononuclear cell responses (28 cytokines) to respiratory viruses and bacteria, Toll-like receptor ligands and phytohemagglutinin, in 307 children. Cytokine responses were highly variable with > 1000-fold differences between children. Machine learning revealed clear distinction between virus-associated and bacteria-associated stimuli. Cytokines clustered into three functional groups (anti-viral, pro-inflammatory and T-cell derived). To investigate mechanisms potentially explaining such variable responses, we investigated cytokine Quantitative Trait Loci (cQTLs) of IL-6 responses to bacteria and identified nine (eight novel) loci. Our integrative approach describing stimuli, cytokines and children as variables revealed robust immunologically and microbiologically plausible clustering, providing a framework for a greater understanding of host-responses to infection, including novel genetic associations with respiratory disease.


Conflict of interest statement

The authors declare no competing interests.

Figures

Figure 1
Figure 1
Cytokine response patterns according to stimulus. Fold induction (response/media) of a panel of 28 innate, inflammatory and immune cytokines from PBMCs; each dot represents a child. (a) Viral stimuli: RSV, RV1B, RV16, polyIC, R848 and CpGA; (b) T-cell stimulus: PHA. (c) Bacterial stimuli: Strpn, LTA, Hin, LPS, PAM, PGN, FSL and Fla. This figure was generated using beeswarm package in R (version 3.6.3, https://www.R-project.org/).
Figure 2
Figure 2
Hierarchical clustering (HC) of cytokine responses. (a) Heatmap of the mean level of response for each cytokine-stimulus pair (307 children, media-normalised). (b) Hierarchical tree for stimuli. (c) Hierarchical tree for cytokines. Values on nodes indicate probability values (%) of the found clusters appearing in bootstrap resampling. Green numbers are estimates from ordinary bootstrap probabilities (BP); red numbers are “approximately unbiased” (AU) estimates from multi-scale bootstrap resampling, which are less biased estimates than BP (see “Methods” section). Plot (a) was generated using seaborn package in Python (version 3.8, https://www.python.org/). Plots (b,c) were generated using pvclust package in R (version 3.6.3, https://www.R-project.org/).
Figure 3
Figure 3
Hierarchical clustering for pro-inflammatory cytokine data. (a) HC with heatmap on pro-inflammatory cytokine responses to all stimuli. (b) Pairwise Pearson correlation coefficients of production of pro-inflammatory cytokines in response to bacterial ligands. MCP4 and IL-17 were weakly induced and so are excluded from this panel. (c) Scatter plot with IL-6 responses to LPS versus IL-6 responses to Hin, and Pearson correlation coefficient between LPS and Hin. This figure was generated using seaborn package in Python (version 3.8, https://www.python.org/).
Figure 4
Figure 4
Association of rs8028121 with cytokine-stimulus pairs. The cQTL rs8028121 was associated with IL-6 production in response to bacterial stimuli (x-axis = 1) more strongly than IL-6 production in response to viral stimuli (x-axis = 2), other pro-inflammatory cytokine responses to bacterial stimuli (x-axis = 3), virus-induced cytokine responses to viral stimuli (x-axis = 4), pro-inflammatory cytokine responses to PHA (x-axis = 5), and virus-induced cytokine responses to PHA (x-axis = 6).

References

    1. Jackson DJ, et al. IL-33-dependent type 2 inflammation during rhinovirus-induced asthma exacerbations in vivo. Am. J. Respir. Crit. Care Med. 2014;190:1373–1382. doi: 10.1164/rccm.201406-1039OC. - DOI - PMC - PubMed
    1. Corne JM, et al. Frequency, severity, and duration of rhinovirus infections in asthmatic and non-asthmatic individuals: A longitudinal cohort study. Lancet. 2002;359:831–834. doi: 10.1016/S0140-6736(02)07953-9. - DOI - PubMed
    1. Contoli M, et al. Role of deficient type III interferon-lambda production in asthma exacerbations. Nat. Med. 2006;12:1023–1026. doi: 10.1038/nm1462. - DOI - PubMed
    1. Message SD, et al. Rhinovirus-induced lower respiratory illness is increased in asthma and related to virus load and Th1/2 cytokine and IL-10 production. Proc. Natl. Acad. Sci. U.S.A. 2008;105:13562–13567. doi: 10.1073/pnas.0804181105. - DOI - PMC - PubMed
    1. Talbot TR, et al. Asthma as a risk factor for invasive pneumococcal disease. N. Engl. J. Med. 2005;352:2082–2090. doi: 10.1056/NEJMoa044113. - DOI - PubMed

Publication types