. 2022 Aug 5;12(1):13503.
doi: 10.1038/s41598-022-17755-2.

A multiomics disease progression signature of low-risk ccRCC

Affiliations

A multiomics disease progression signature of low-risk ccRCC

Philipp Strauss et al. Sci Rep. .

Abstract

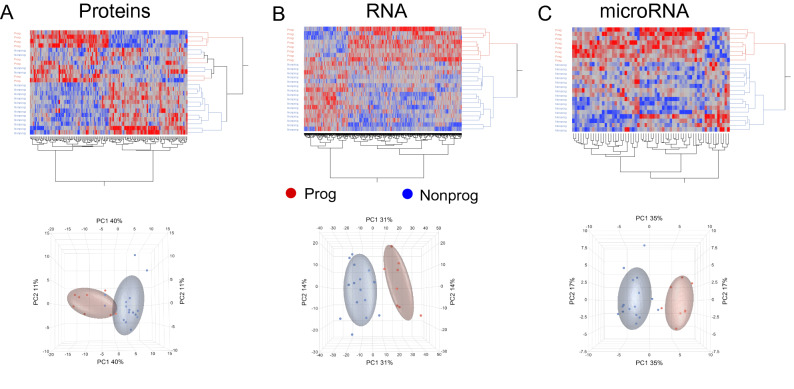
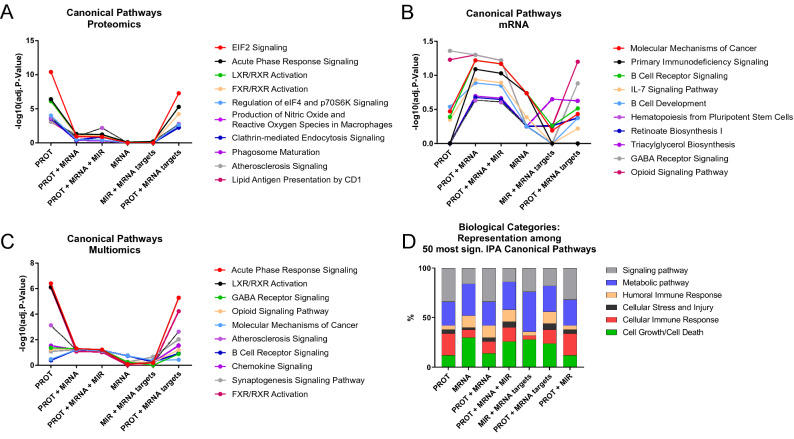
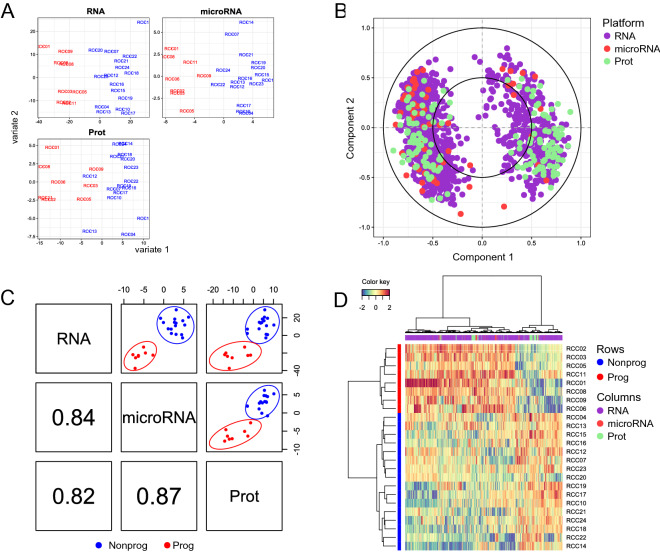
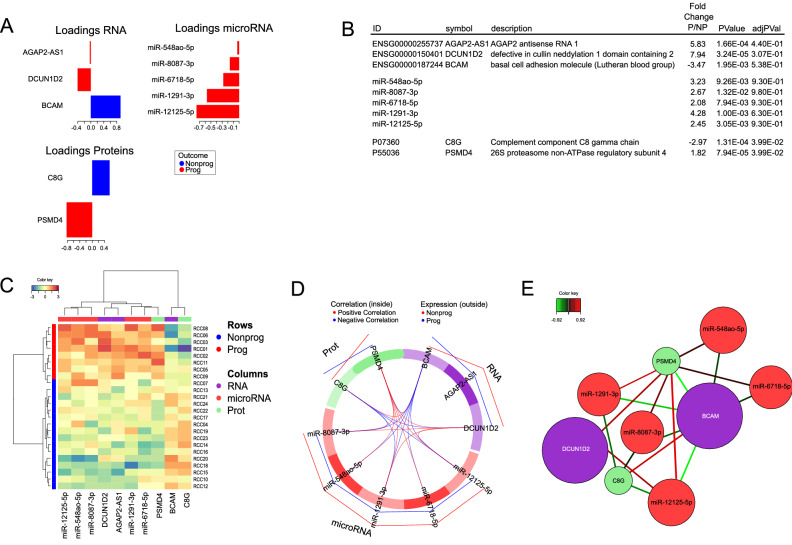
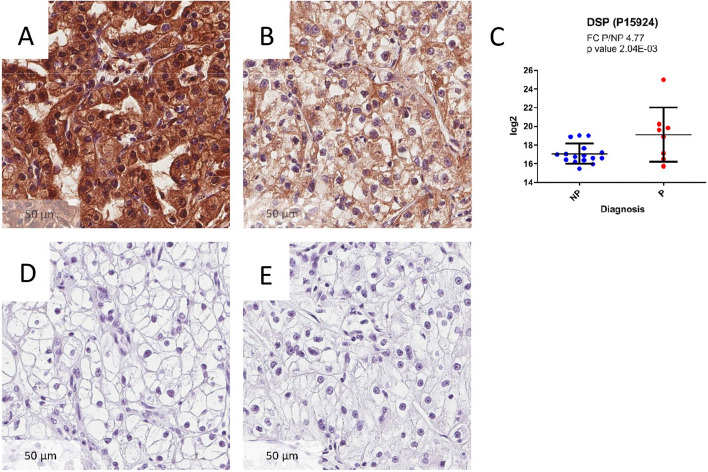
Clear cell renal cell carcinoma (ccRCC) is the most common renal cancer. Identification of ccRCC likely to progress, despite an apparent low risk at the time of surgery, represents a key clinical issue. From a cohort of adult ccRCC patients (n = 443), we selected low-risk tumors progressing within a 5-years average follow-up (progressors: P, n = 8) and non-progressing (NP) tumors (n = 16). Transcriptome sequencing, miRNA sequencing and proteomics were performed on tissues obtained at surgery. We identified 151 proteins, 1167 mRNAs and 63 miRNAs differentially expressed in P compared to NP low-risk tumors. Pathway analysis demonstrated overrepresentation of proteins related to "LXR/RXR and FXR/RXR Activation", "Acute Phase Response Signaling" in NP compared to P samples. Integrating mRNA, miRNA and proteomic data, we developed a 10-component classifier including two proteins, three genes and five miRNAs, effectively differentiating P and NP ccRCC and capturing underlying biological differences, potentially useful to identify "low-risk" patients requiring closer surveillance and treatment adjustments. Key results were validated by immunohistochemistry, qPCR and data from publicly available databases. Our work suggests that LXR, FXR and macrophage activation pathways could be critically involved in the inhibition of the progression of low-risk ccRCC. Furthermore, a 10-component classifier could support an early identification of apparently low-risk ccRCC patients.


Conflict of interest statement

The authors declare no competing interests.

Figures

Figure 1
Figure 1
Hierarchical clustering analyses and principal component analyses (PCA). Hierarchical clustering of emerging data results in effective separation of patients’ groups. However, an overlap is still visible in the PCA of the proteomics data (A), whereas for mRNA (B) and miRNA data (C) PCA allows a complete separation of the two groups.
Figure 2
Figure 2
Different omics analyses result in different pathway signatures. Adjusted p-values of the 10 pathways with highest significance in the respective analyses were comparatively evaluated. Statistical significance is reached at − log10(adj. p-value) > 1.3 (i.e., adj. p-value < 0.05). We compared the pathway analysis results of the ten pathways with the lowest adjusted p-values from: (A) proteomics alone (PROT), (B) mRNA-seq alone (MRNA), and (C) multiomics analysis (PROT + MRNA + MIR). The large differences in adjusted p-value differences between PROT and MRNA in A and B are consistent with very disparate results for their respective pathway signature. (D) Percentages of the biological categories attributed to the 50 most significantly affected pathways captured by proteomics, mRNA, and miRNA or their combinations.
Figure 3
Figure 3
Multiomics integration. Sparse PLS-DA (sPLS-DA) for RNA, miRNA and protein datasets with respective differentially expressed features support the expected separation of sample groups on the first component (A). The correlation circle plot (B) displays the correlation between variables (biological features) and latent components. Each variable coordinate is defined as the Pearson correlation between the original data and a latent component. The contribution to the definition of each component is visualized as closeness to the circle with radius 1, as well as the correlation structure between variables (clusters of variables). The cosine angle between any two points represents the correlation (negative, positive or null) between two variables. A global overview of the correlation structure for component 1 is shown in (C). A strong correlation is detectable for each dataset combination, the strongest being for the combination RNA/microRNA. (D) Clustered Image Map (CIM) showing two clusters of samples (rows) and two main clusters of over- and underrepresented features from all three data sources. CIM is based on a hierarchical clustering simultaneously operating on the rows and columns of the selected variables in the original data, here reported by using Euclidian distance and complete linkage.
Figure 4
Figure 4
Disease progression signature. For the visualization of the molecular signature, the loading plot (A) represents the loading weights of each variable on component 1 of the multivariate model. Most important variables, according to absolute values of their coefficients) are ordered from bottom to top. Colors indicate the class for which the mean expression value is the highest or the lowest for each feature. In (B), the features of the model are shown, listed according to the loading plot in (A). In (C), the Clustered Image Map (CIM) demonstrates that the expression values of the 10 features of the model yield two clusters of samples (rows) and two main clusters of over- and underrepresented features, by employing Euclidian distance and Ward´s linkage. (D) Pearson correlation of the expression values of the features, as visualized by a circosplot, with cutoff 0.07. Positive correlation in red, negative in blue. The outer lines indicate whether the featured marker is expressed to a higher (red line) or lower (blue line) extent in NP, as compared to P. The Relevance network in (E) demonstrates the correlation structure between variables shown in (D) (cutoff 0.7), where positive correlation is depicted in red and negative correlation in blue. The similarity value between a pair of variables is obtained by calculating the sum of the correlations between the original variables and each of the latent components of the model.
Figure 5
Figure 5
Immunohistochemistry (IHC) of Desmoplakin (DSP) and its protein abundance plot. DSP was expressed to a higher extend in P (A), compared to NP (B) tumors based on both proteomics data and IHC results. IHC results (40 ×) are from a matched sample pair. The image was taken from the most markedly stained sections of each slide. (C) depicts the log2 abundance values of DSP in the proteomics dataset. (D) Depicts the staining without the primary antibody. (E) Depicts the staining without the secondary antibody.

References

    1. Ljungberg B, Albiges L, Abu-Ghanem Y, Bensalah K, Dabestani S, Montes SF, et al. European association of urology guidelines on renal cell carcinoma: The 2019 update. Eur. Urol. 2019;1:1. - PubMed
    1. Siegel RL, Miller KD, Jemal A. Cancer statistics, 2019. CA Cancer J. Clin. 2019;69(1):7–34. doi: 10.3322/caac.21551. - DOI - PubMed
    1. Voss J, Drake T, Matthews H, Jenkins J, Tang S, Doherty J, et al. Chest computed tomography for staging renal tumours: Validation and simplification of a risk prediction model from a large contemporary retrospective cohort. BJU Int. 2020;1:1. - PubMed
    1. Padala SA, Barsouk A, Thandra KC, Saginala K, Mohammed A, Vakiti A, et al. Epidemiology of renal cell carcinoma. World J. Oncol. 2020;11(3):79–87. doi: 10.14740/wjon1279. - DOI - PMC - PubMed
    1. Hsieh JJ, Purdue MP, Signoretti S, Swanton C, Albiges L, Schmidinger M, et al. Renal cell carcinoma. Nat. Rev. Dis. Primers. 2017;3:17009. doi: 10.1038/nrdp.2017.9. - DOI - PMC - PubMed

Publication types