. 2022 Aug;54(8):1145-1154.
doi: 10.1038/s41588-022-01149-1. Epub 2022 Aug 5.

Genetics of the human microglia regulome refines Alzheimer's disease risk loci

Affiliations

Genetics of the human microglia regulome refines Alzheimer's disease risk loci

Roman Kosoy et al. Nat Genet. 2022 Aug.

Abstract

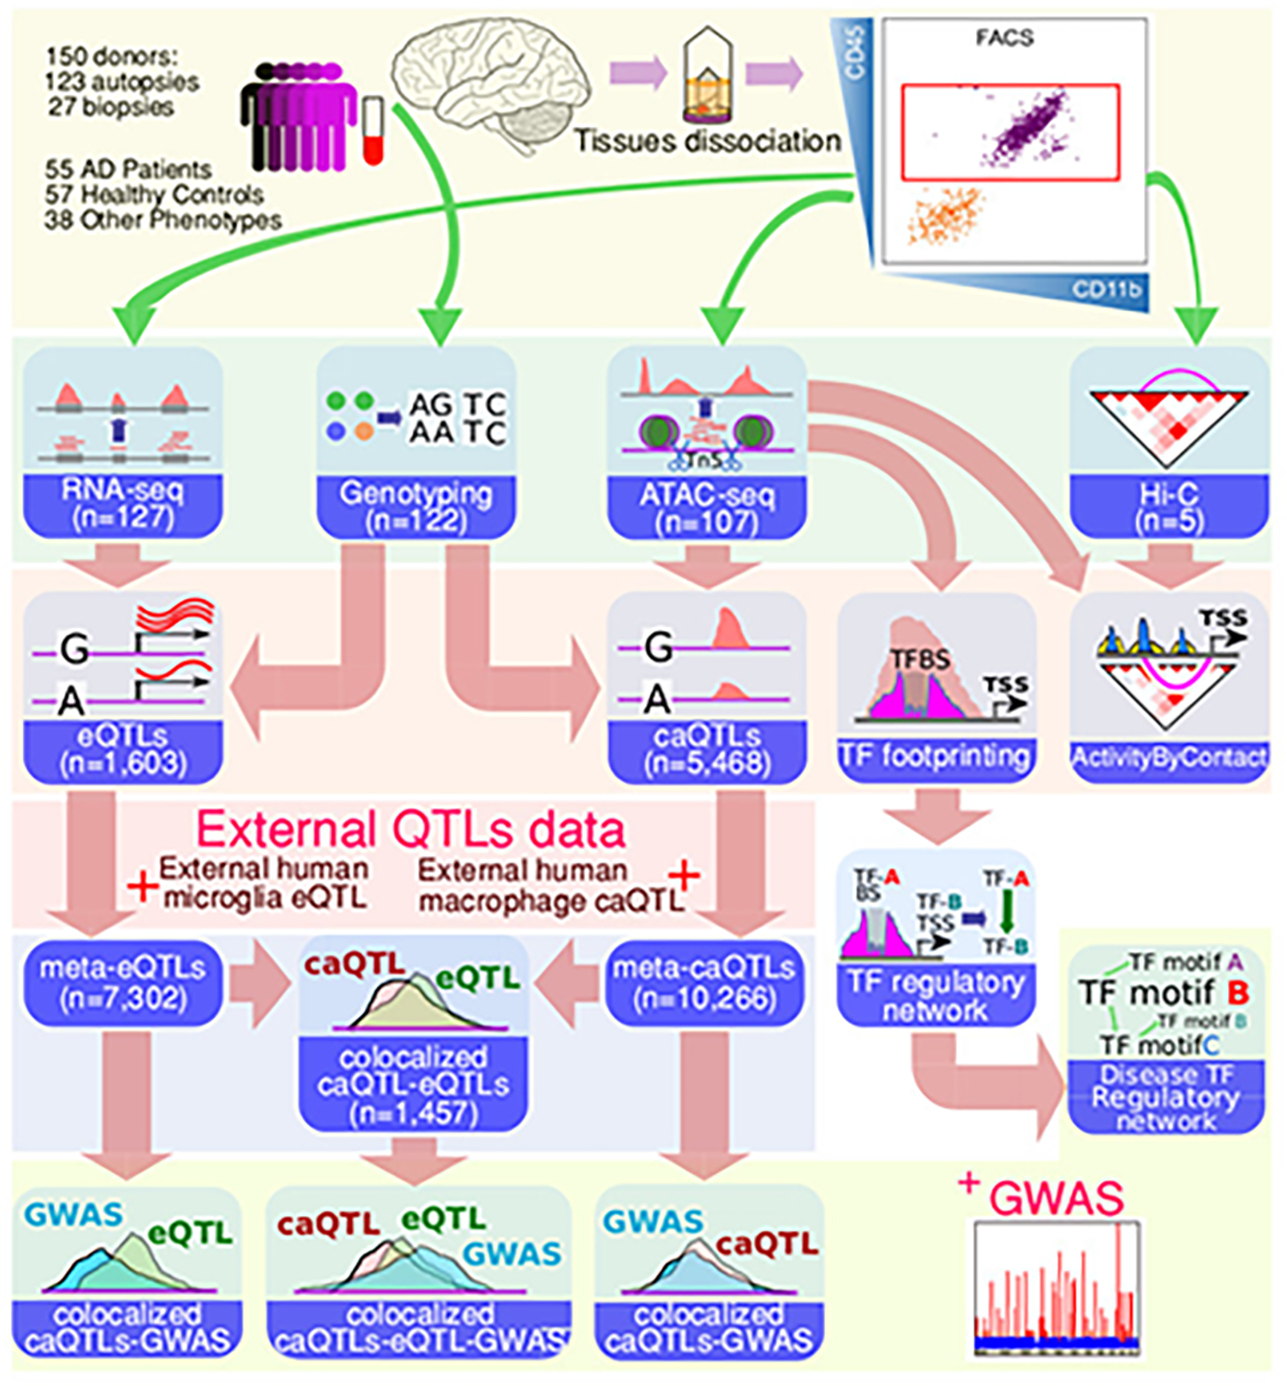
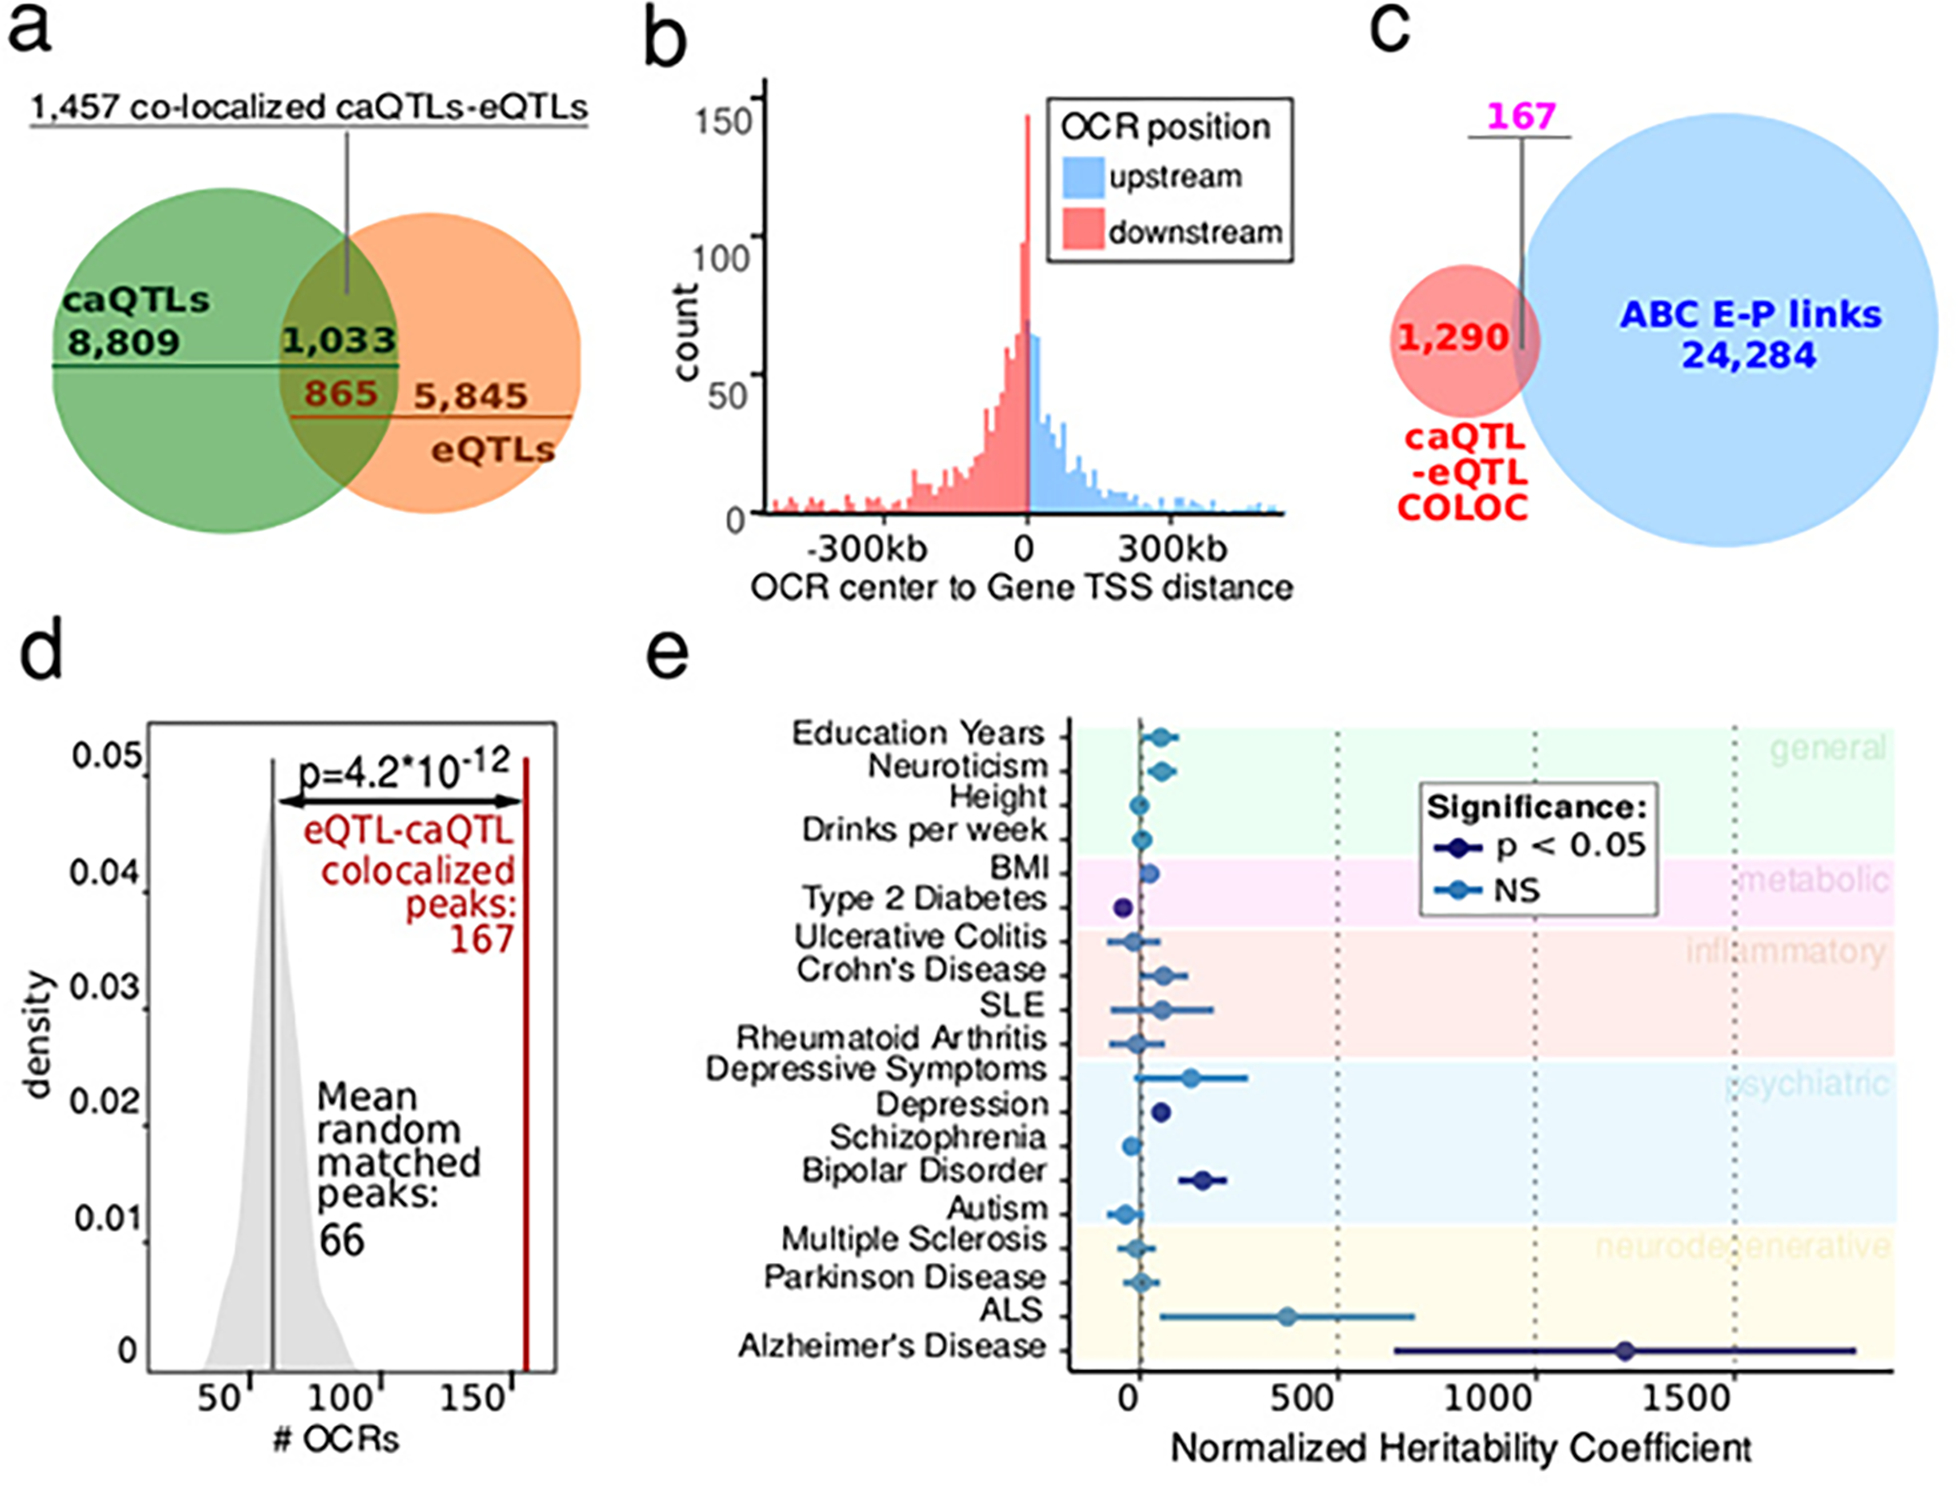
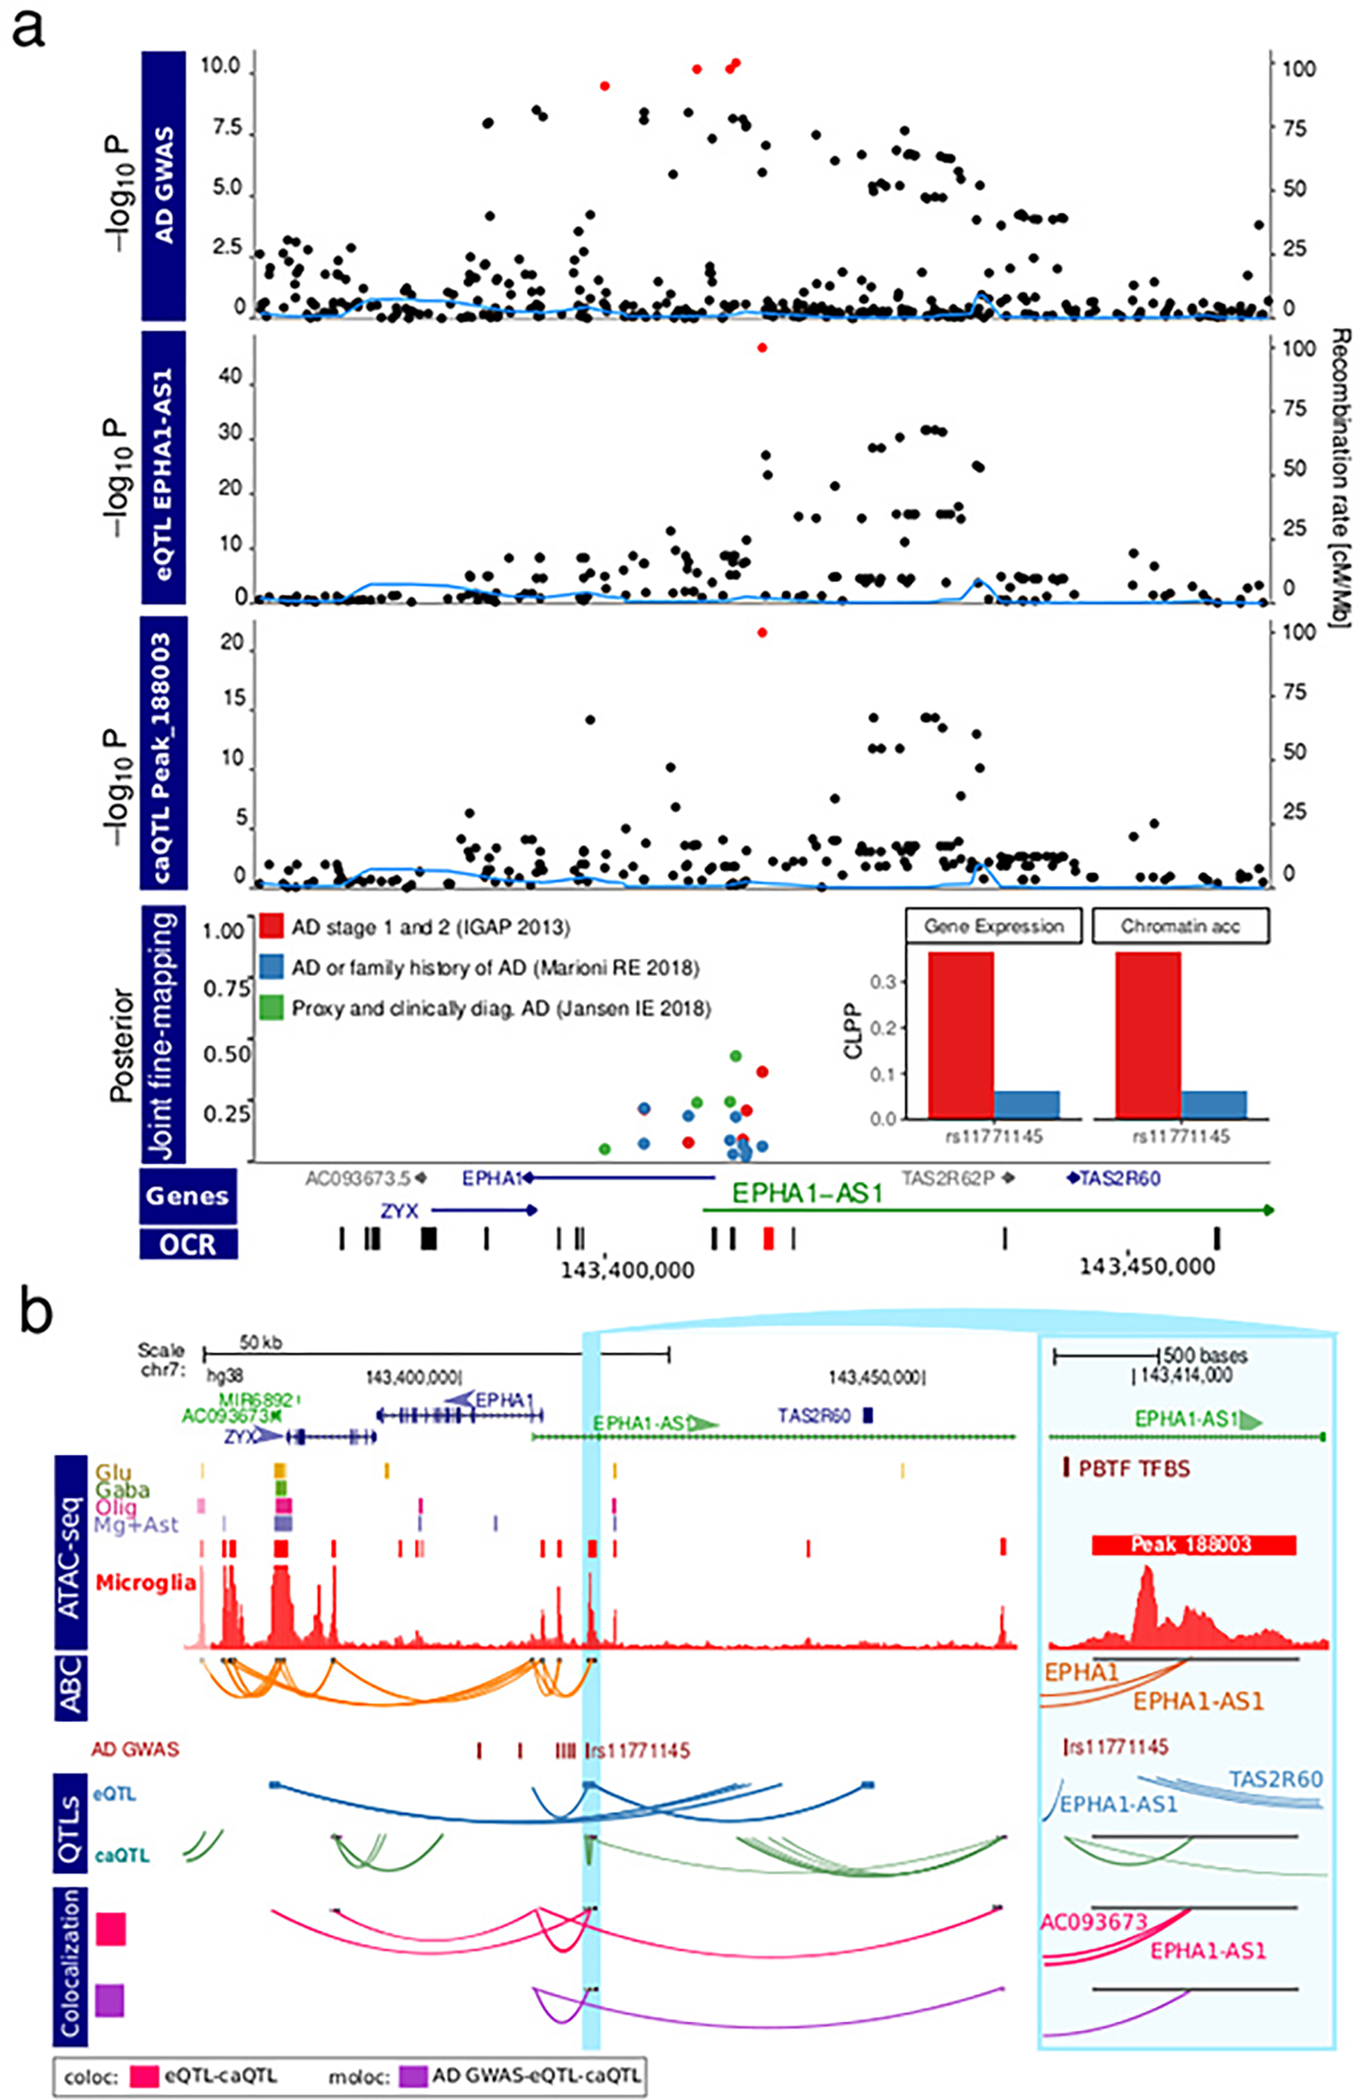
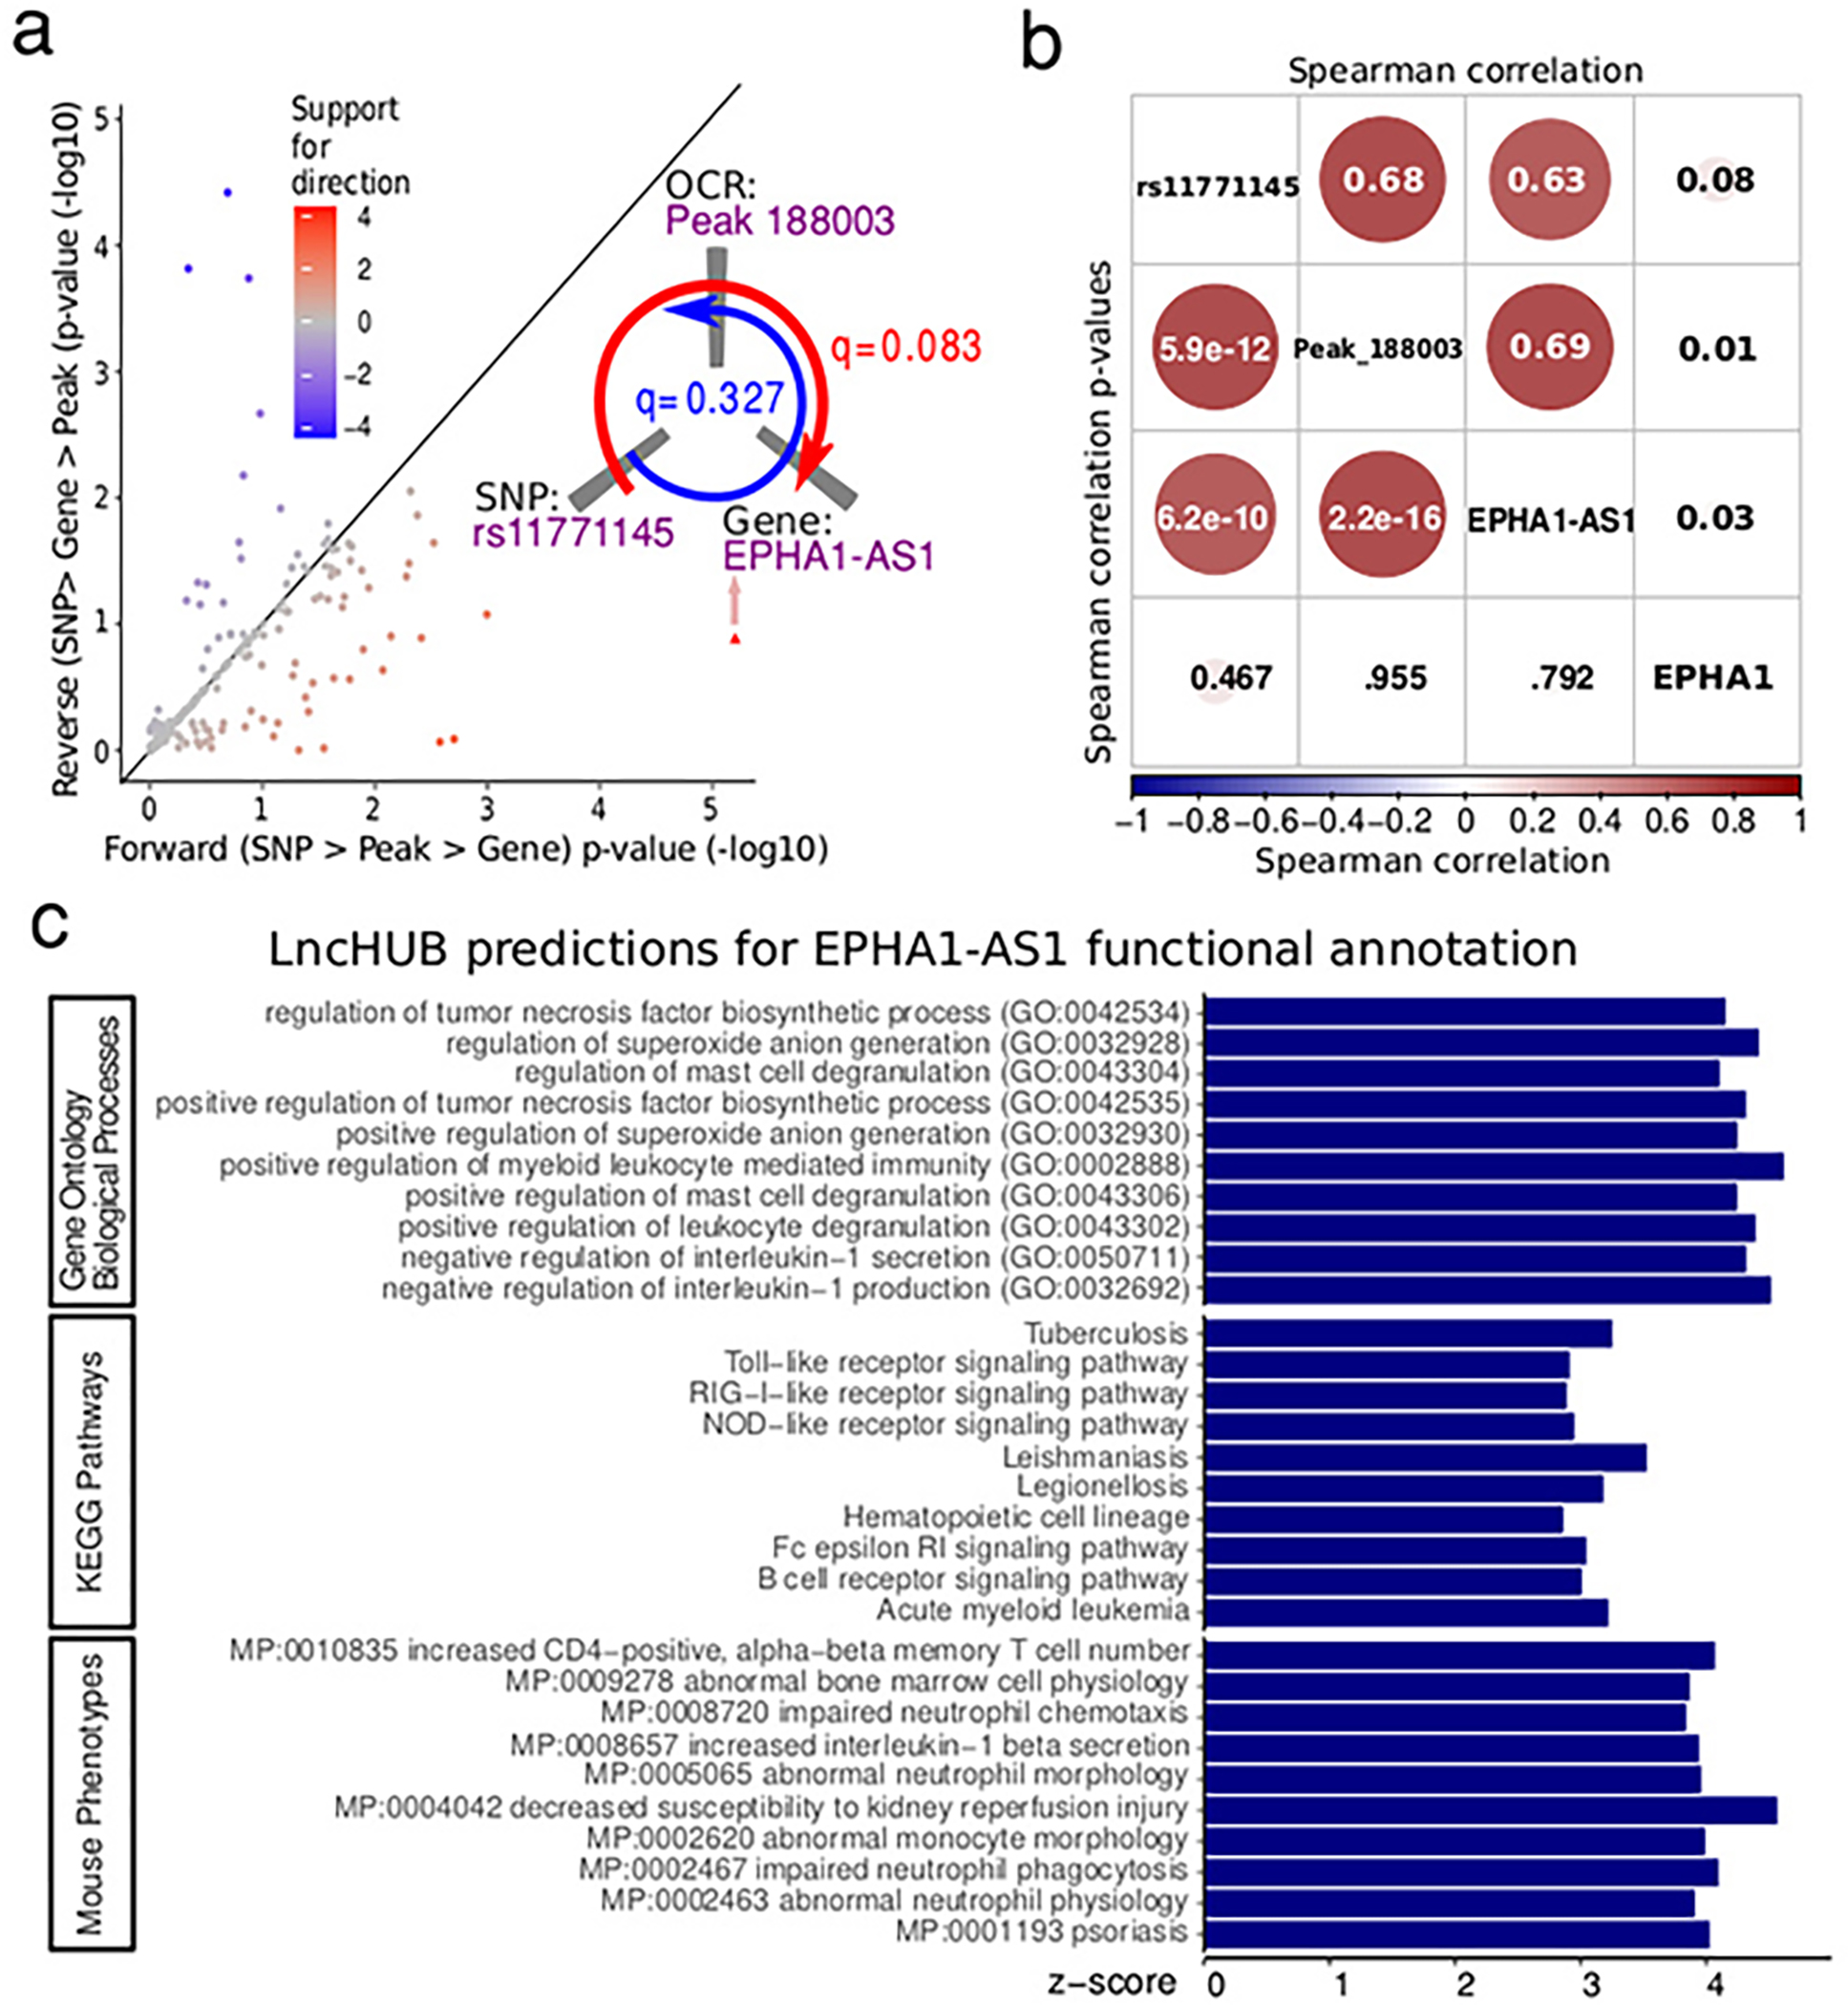
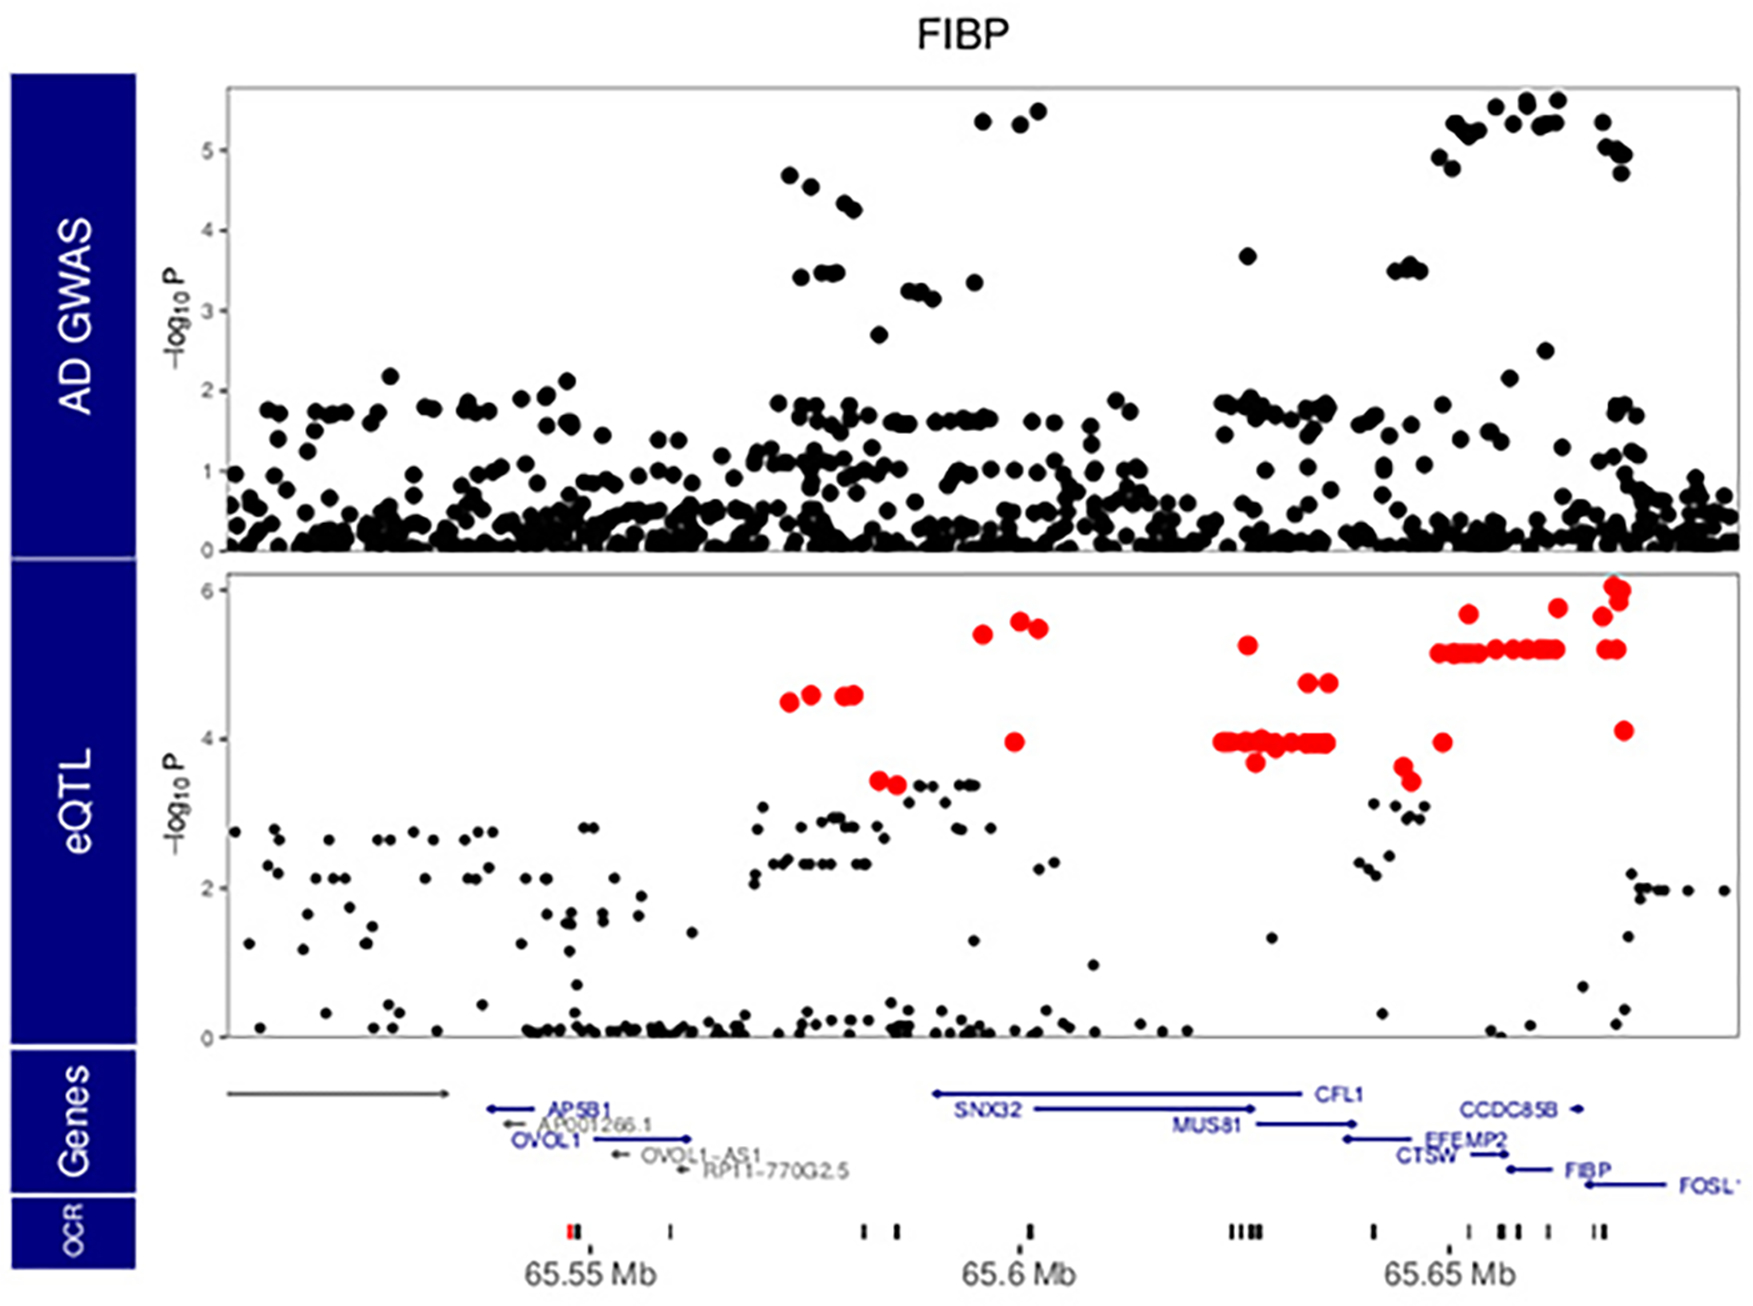
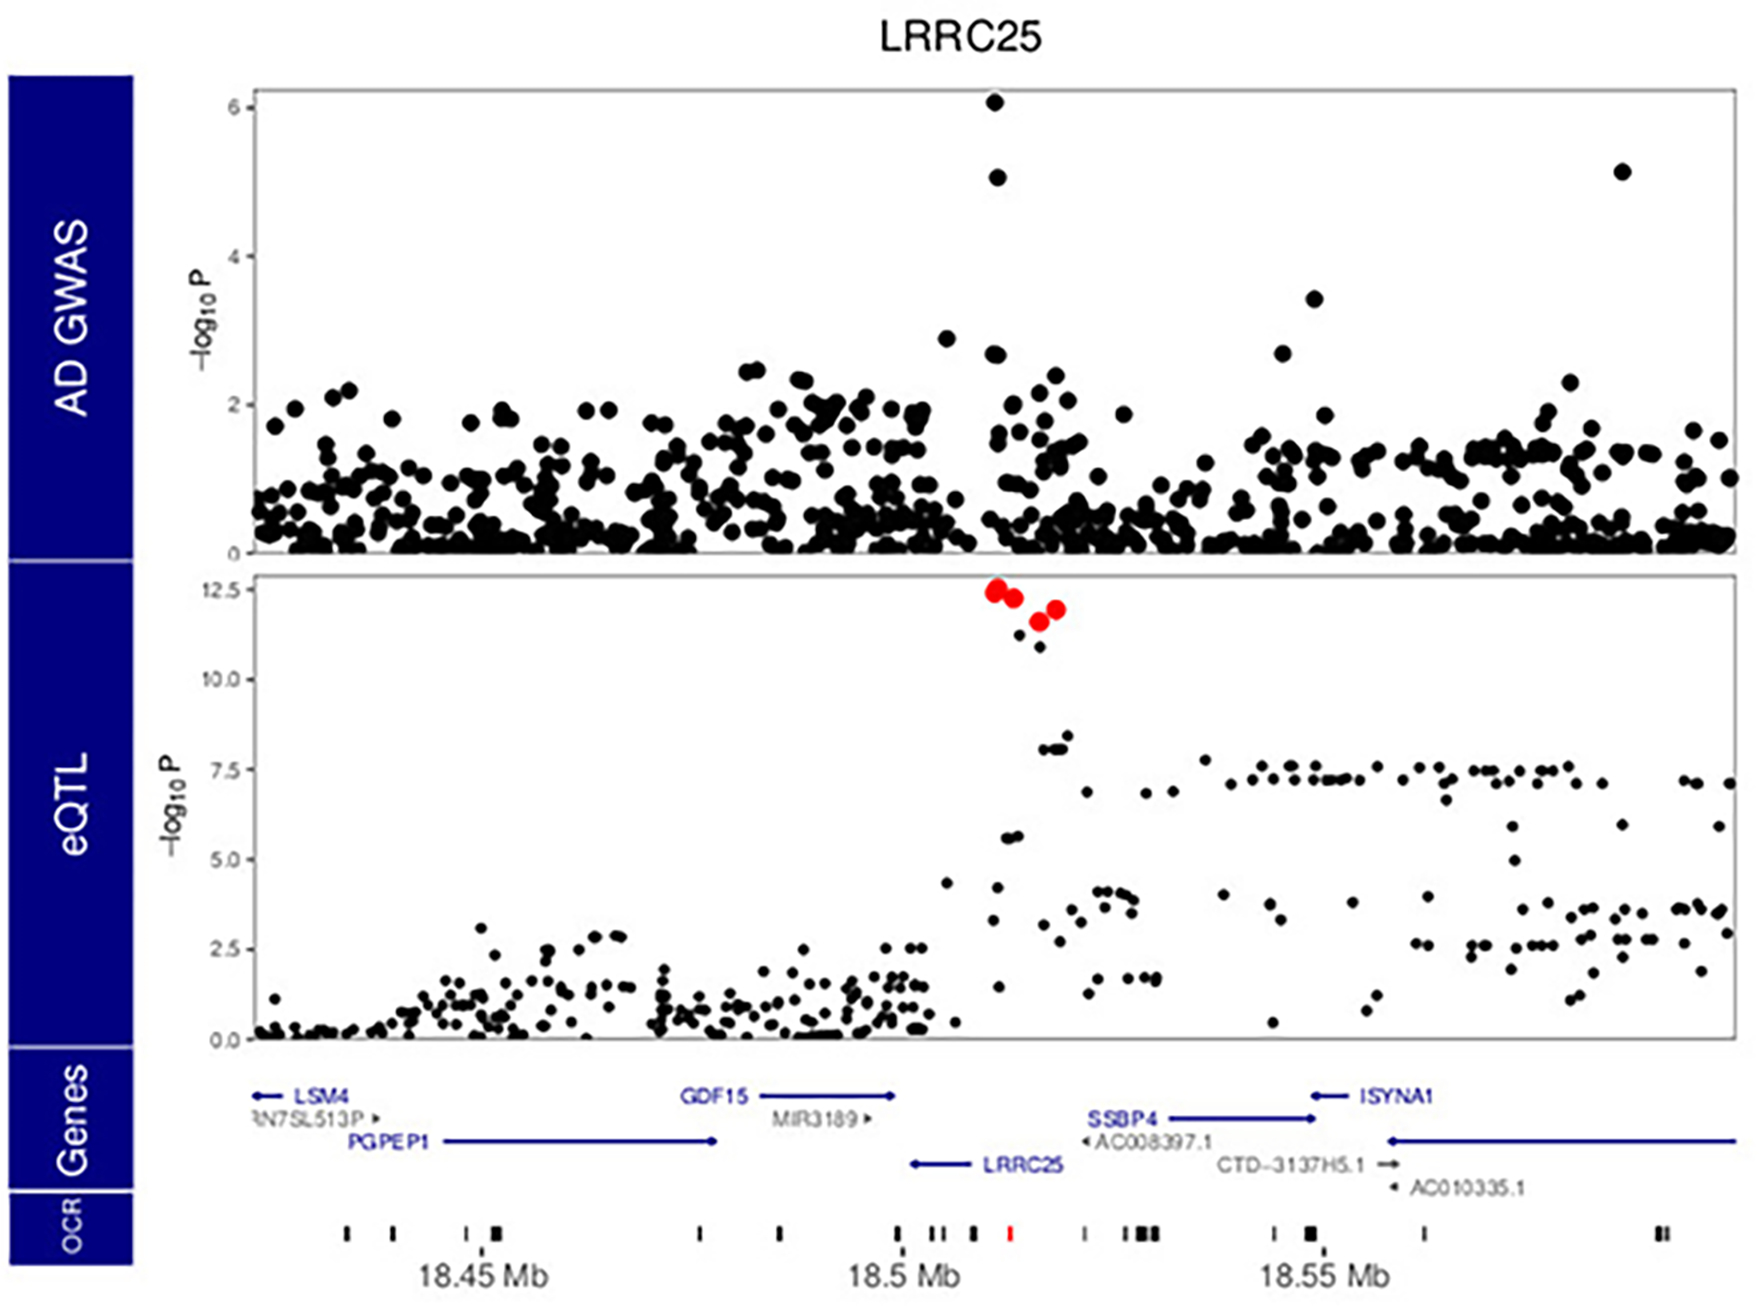
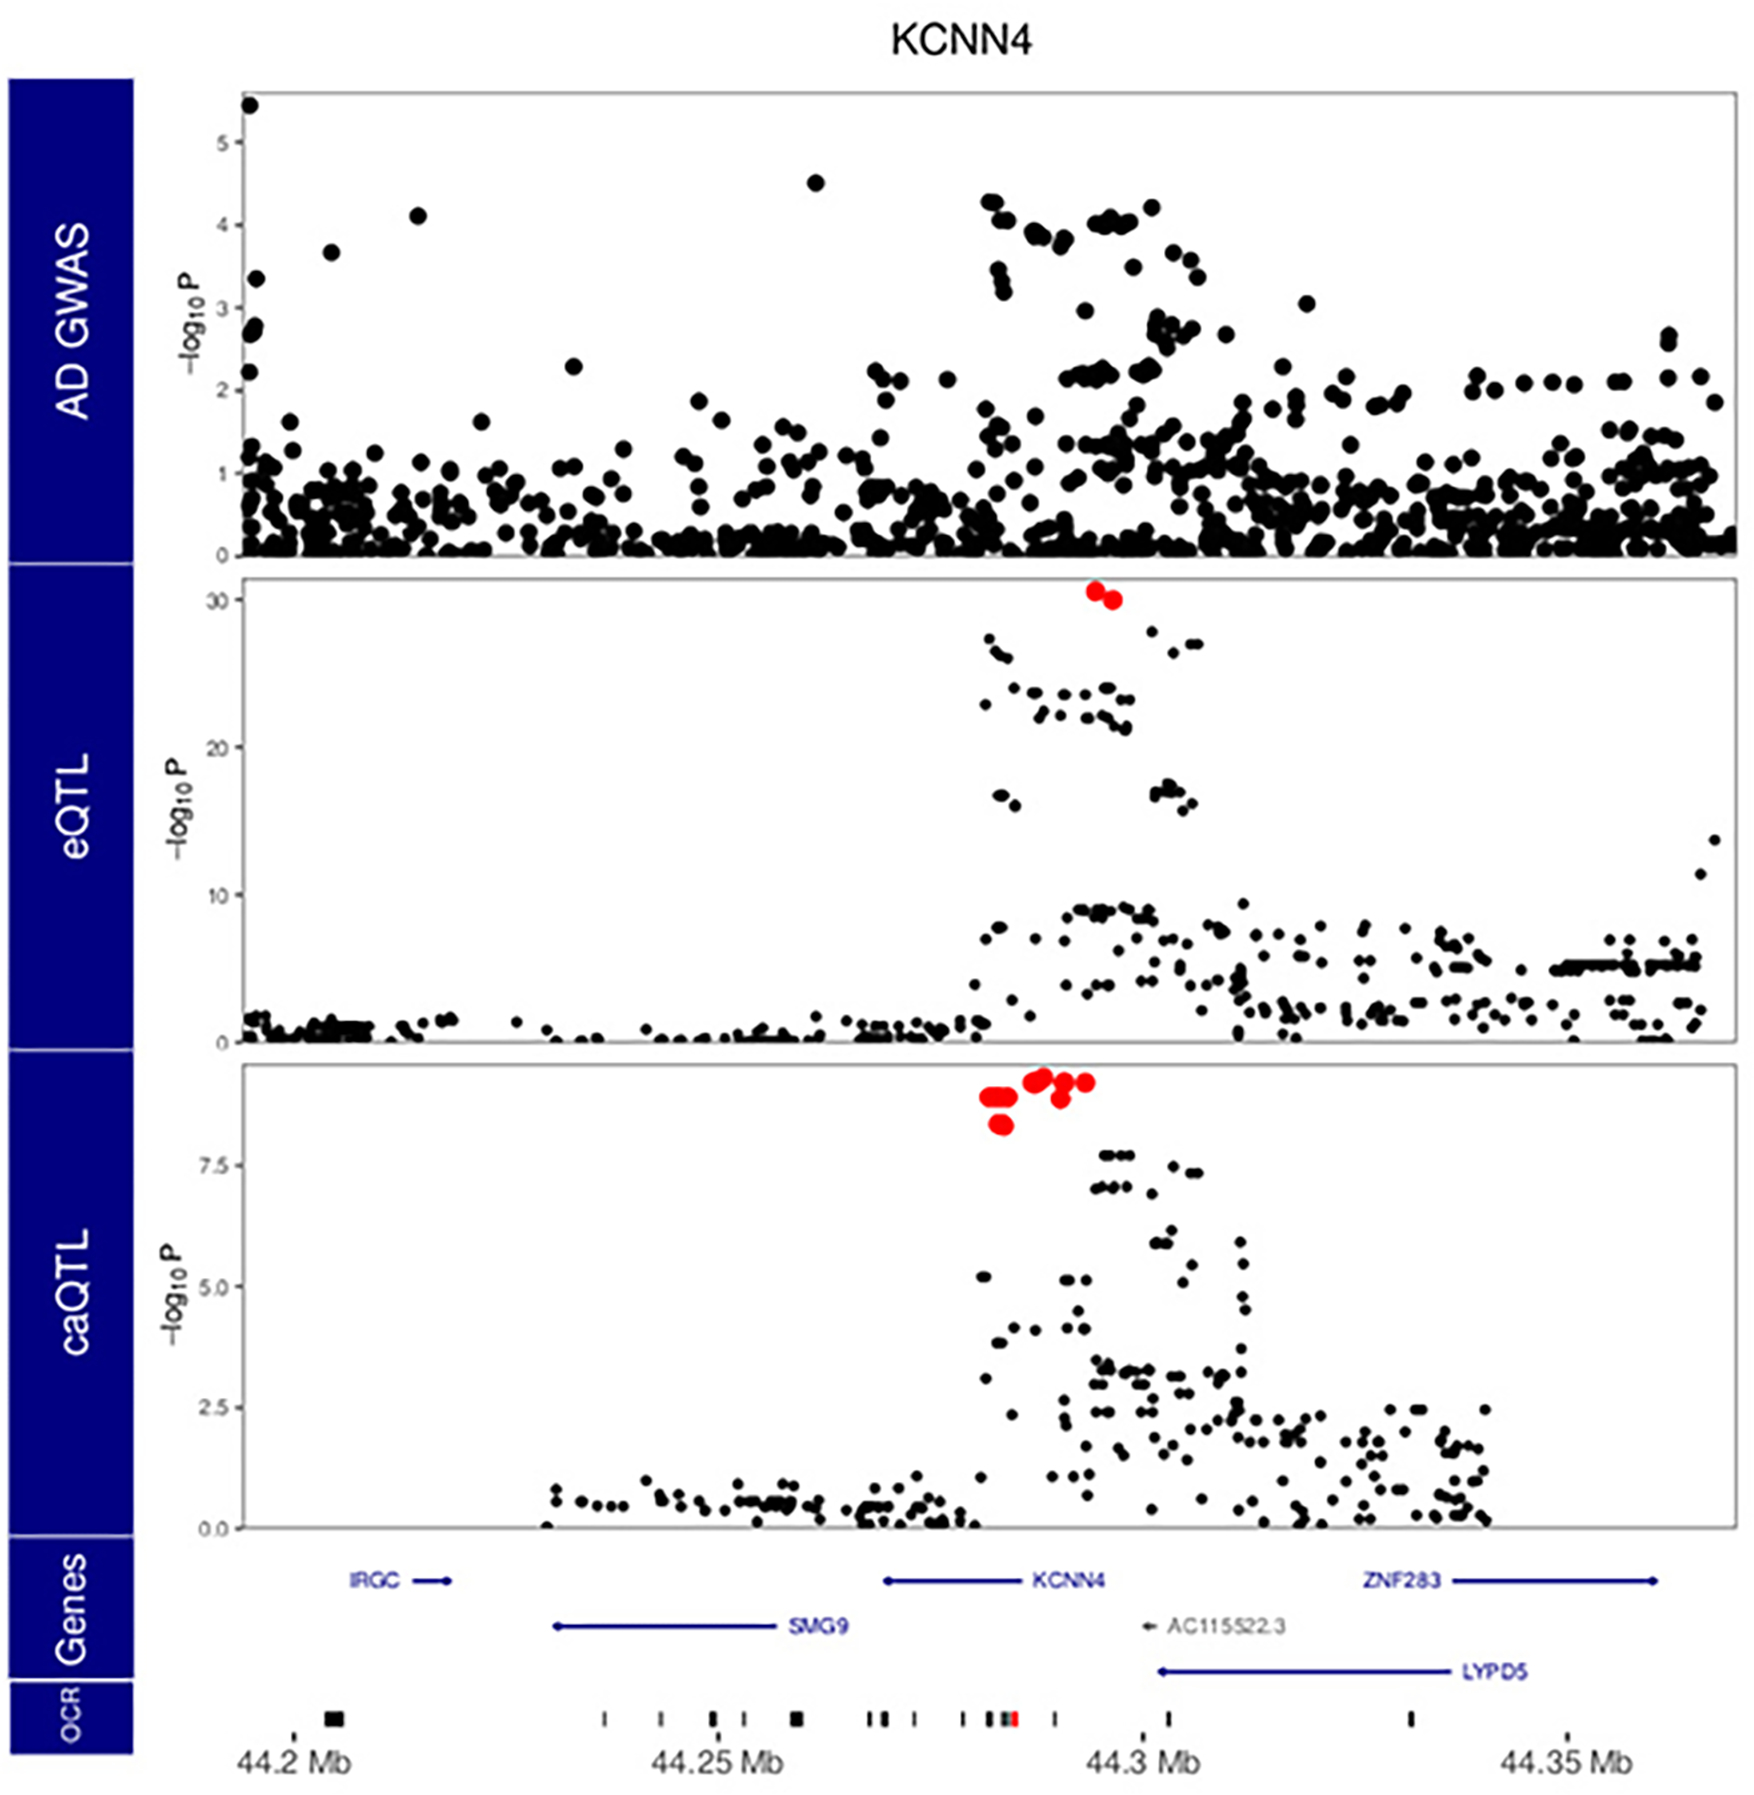
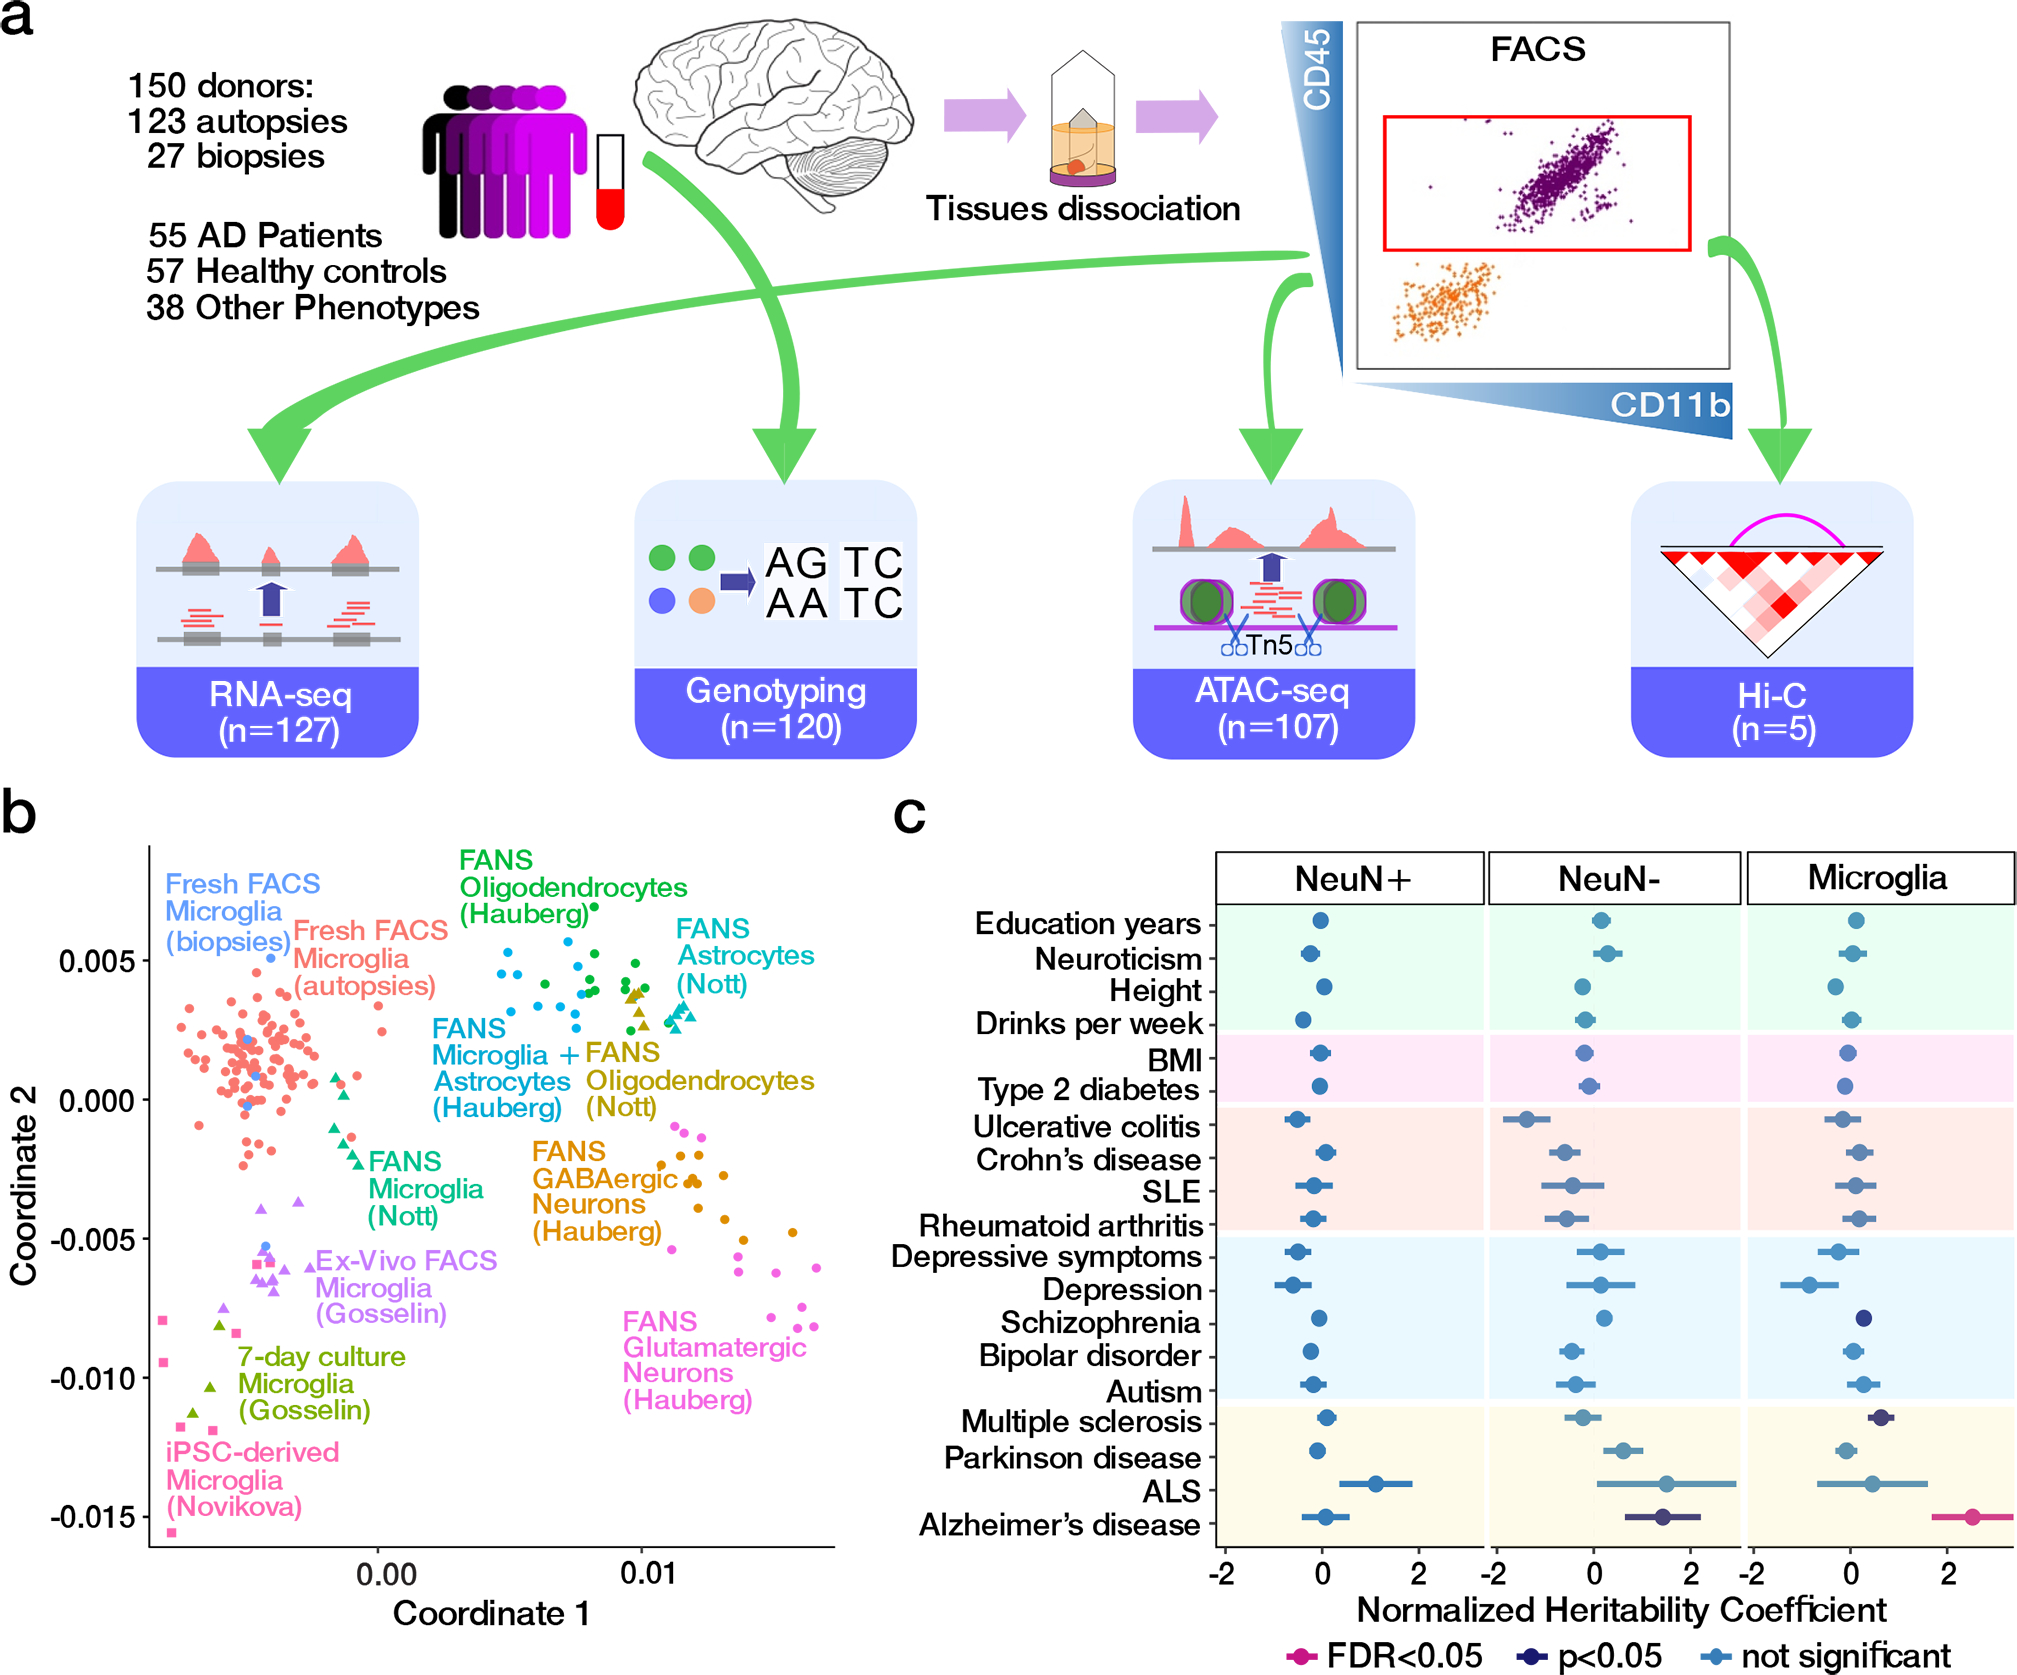
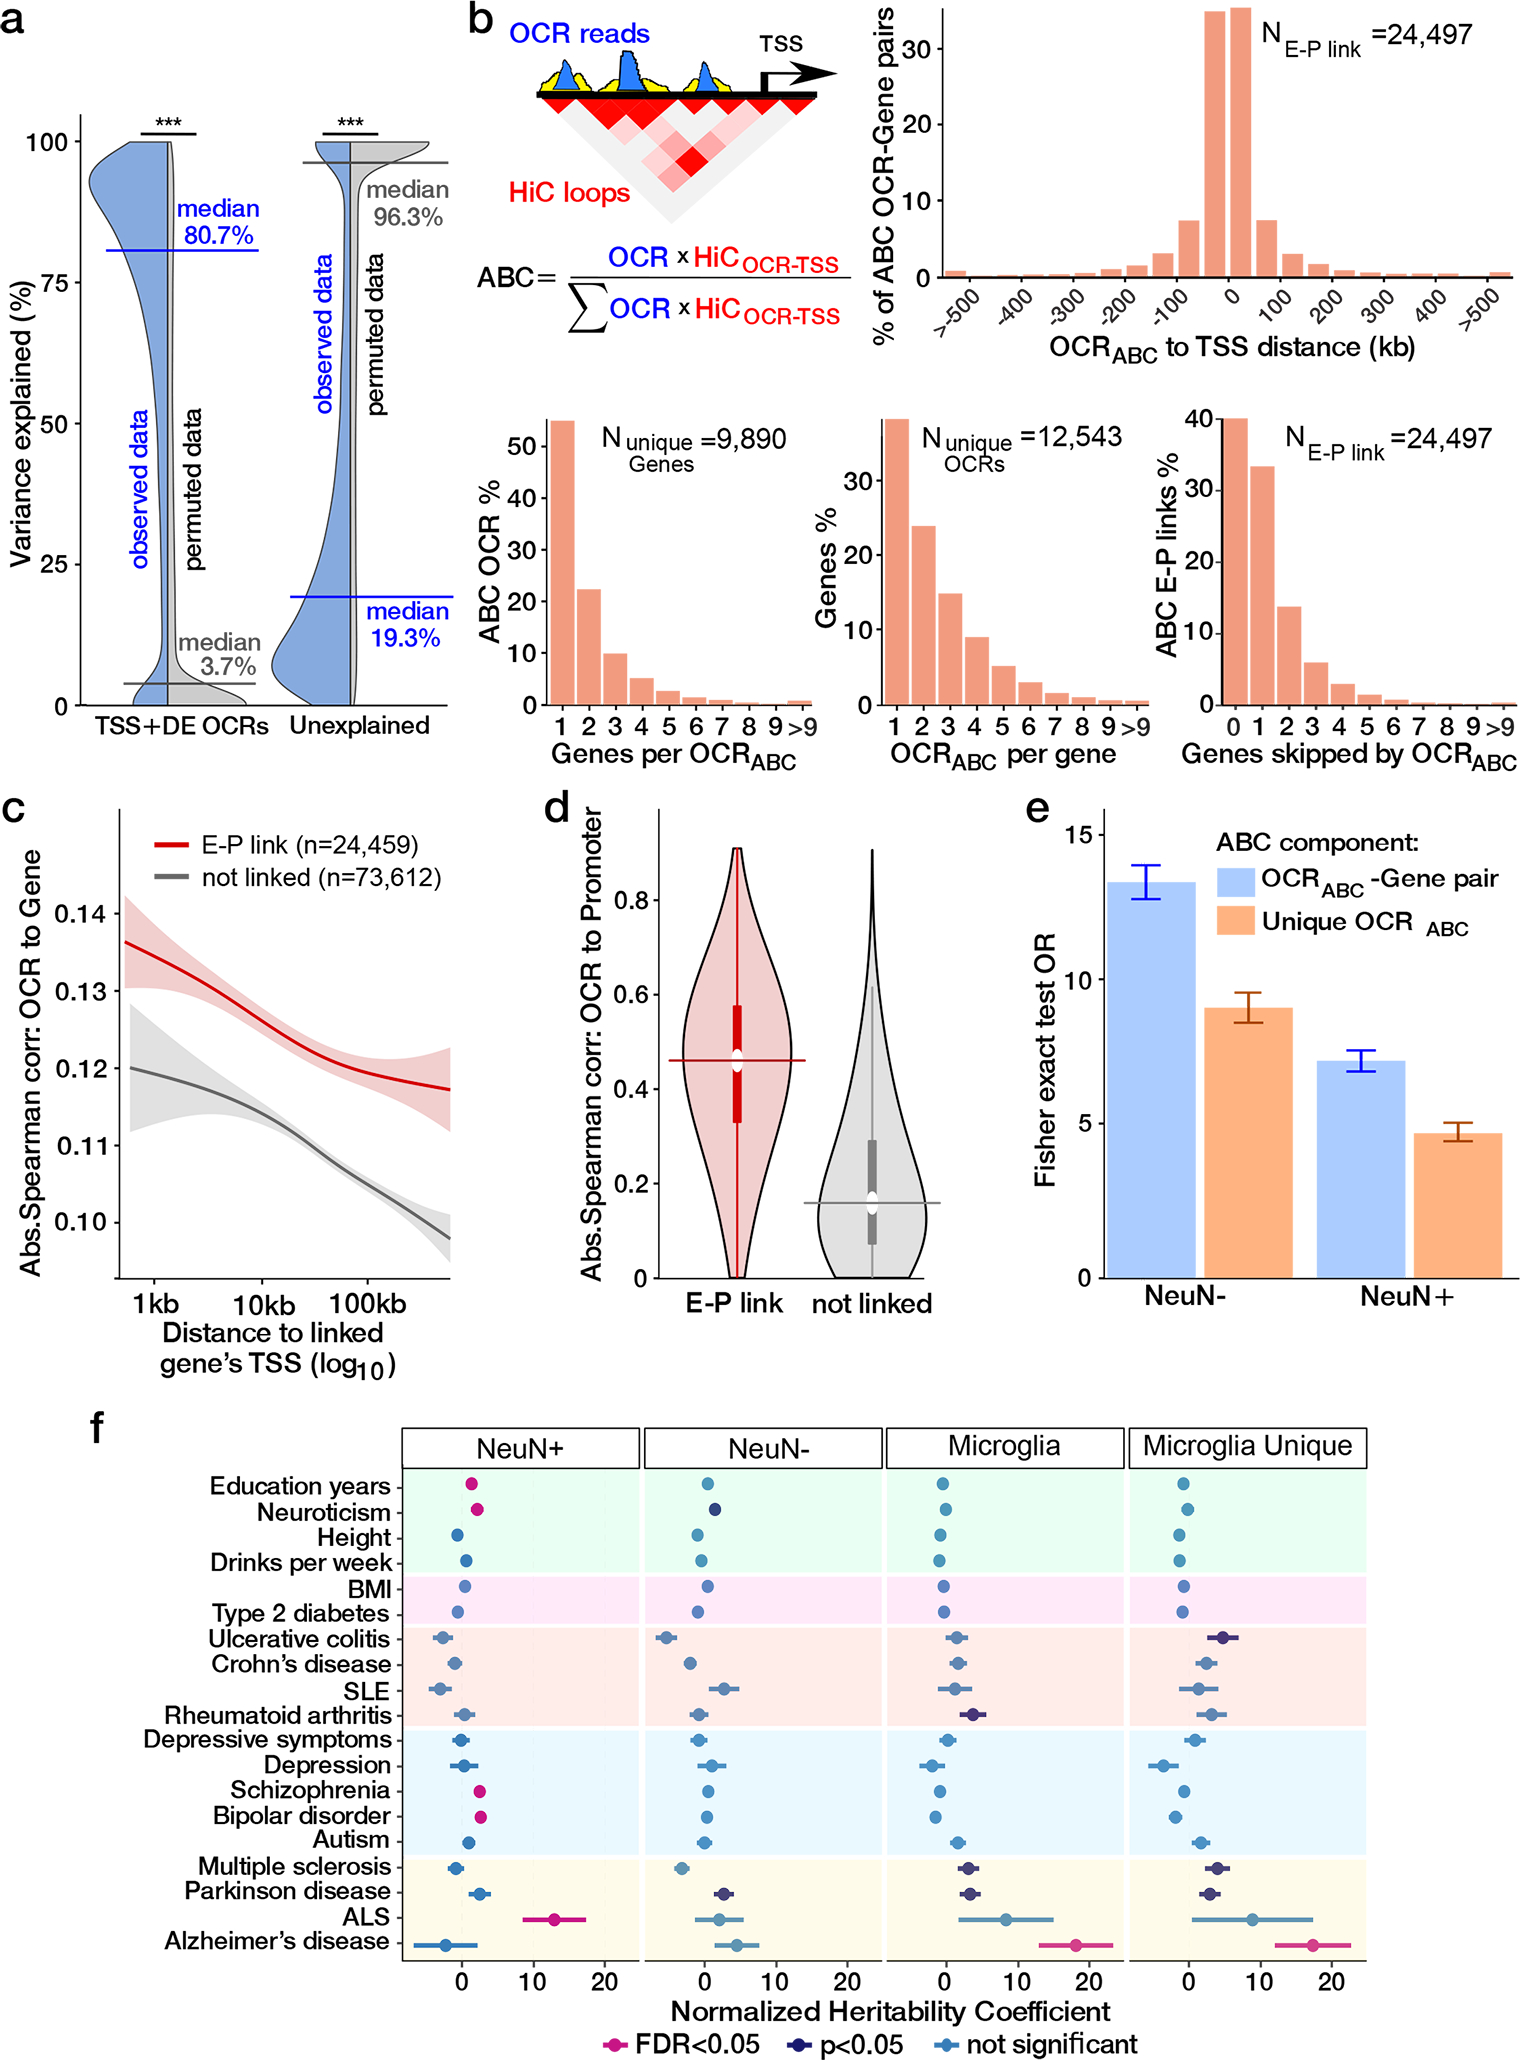
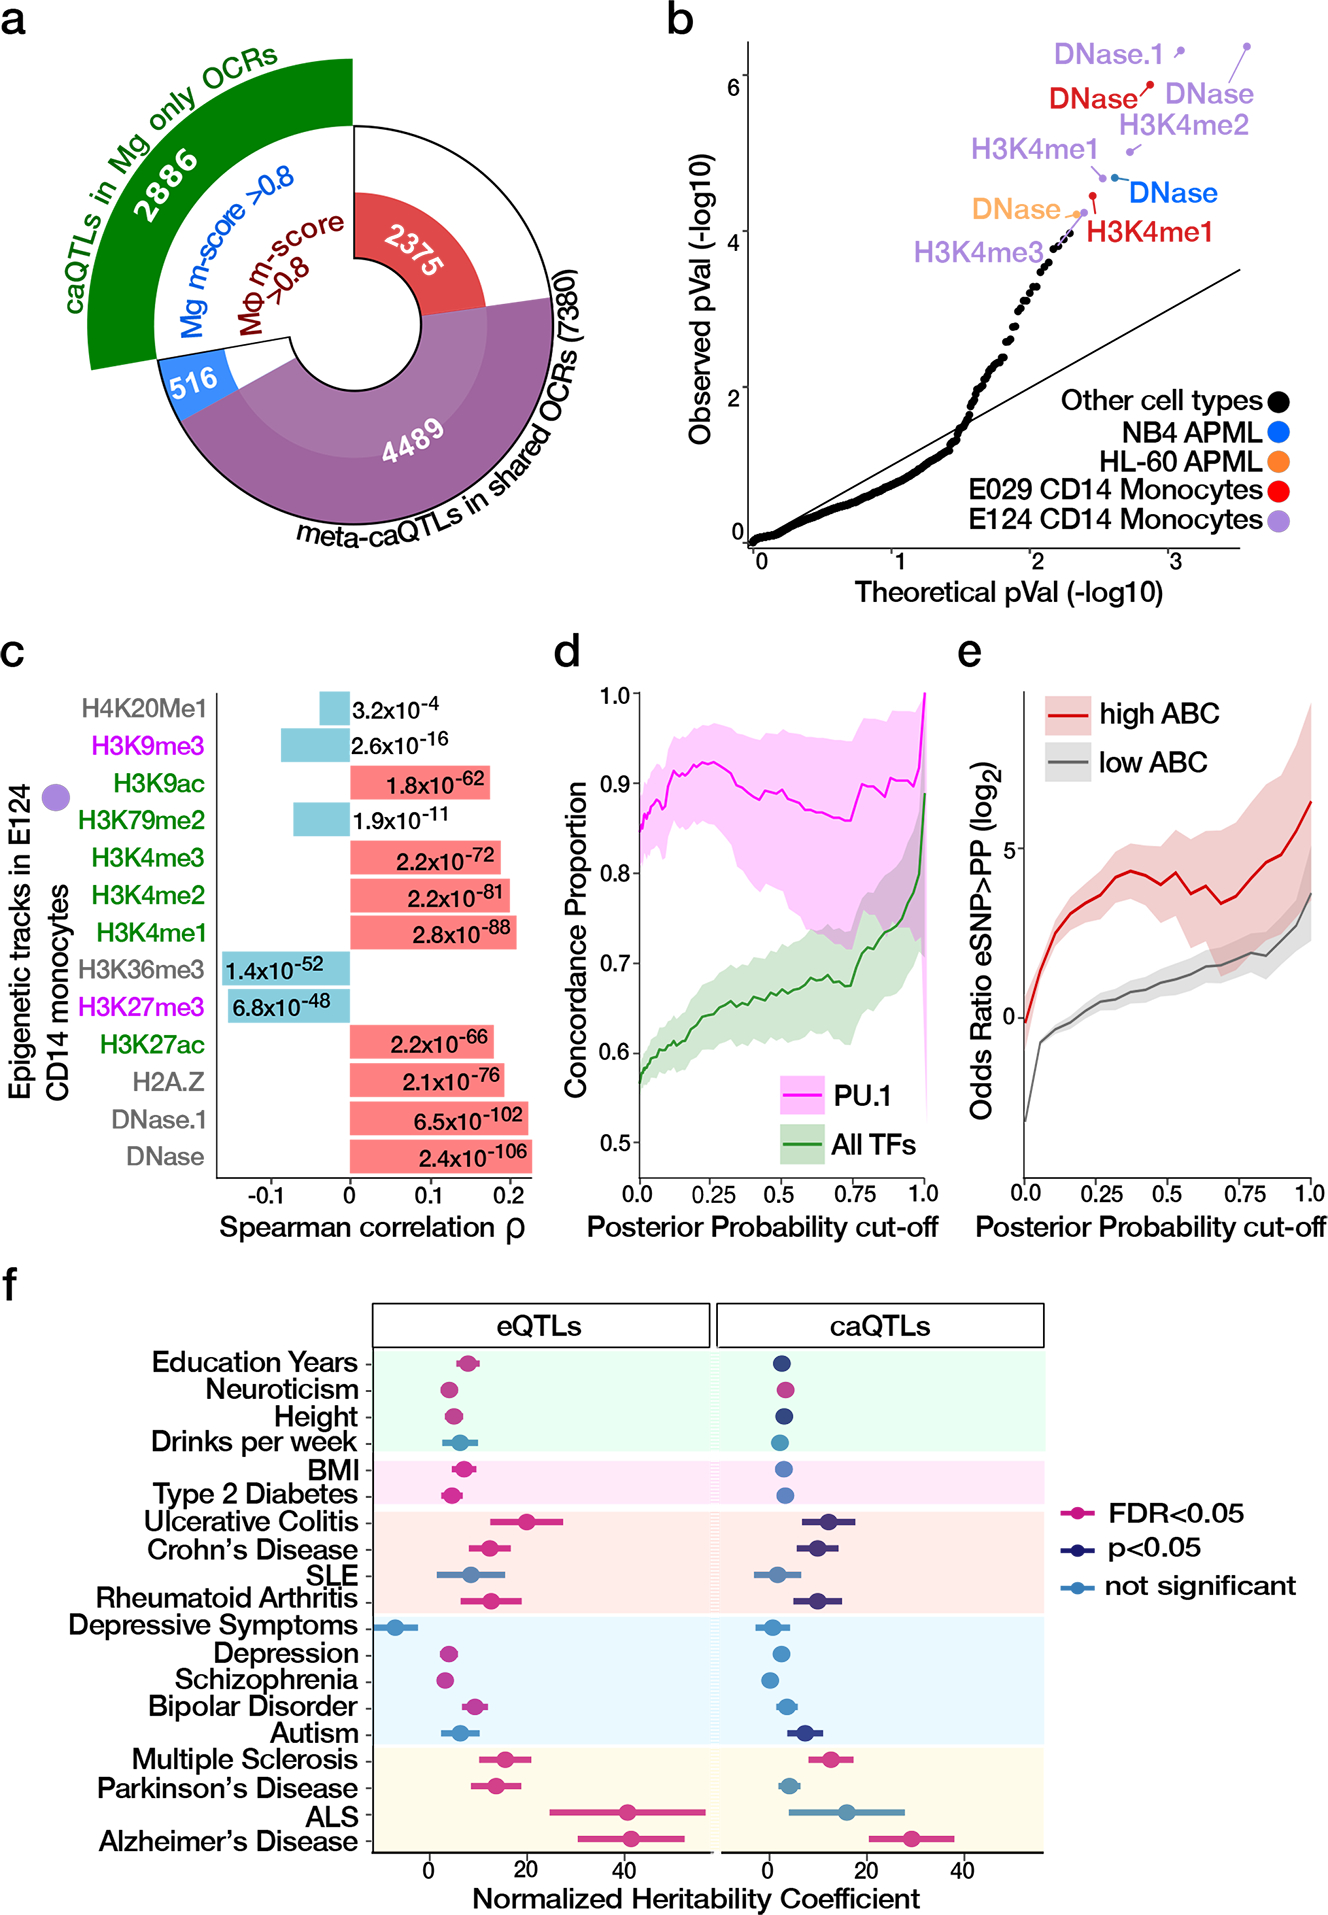
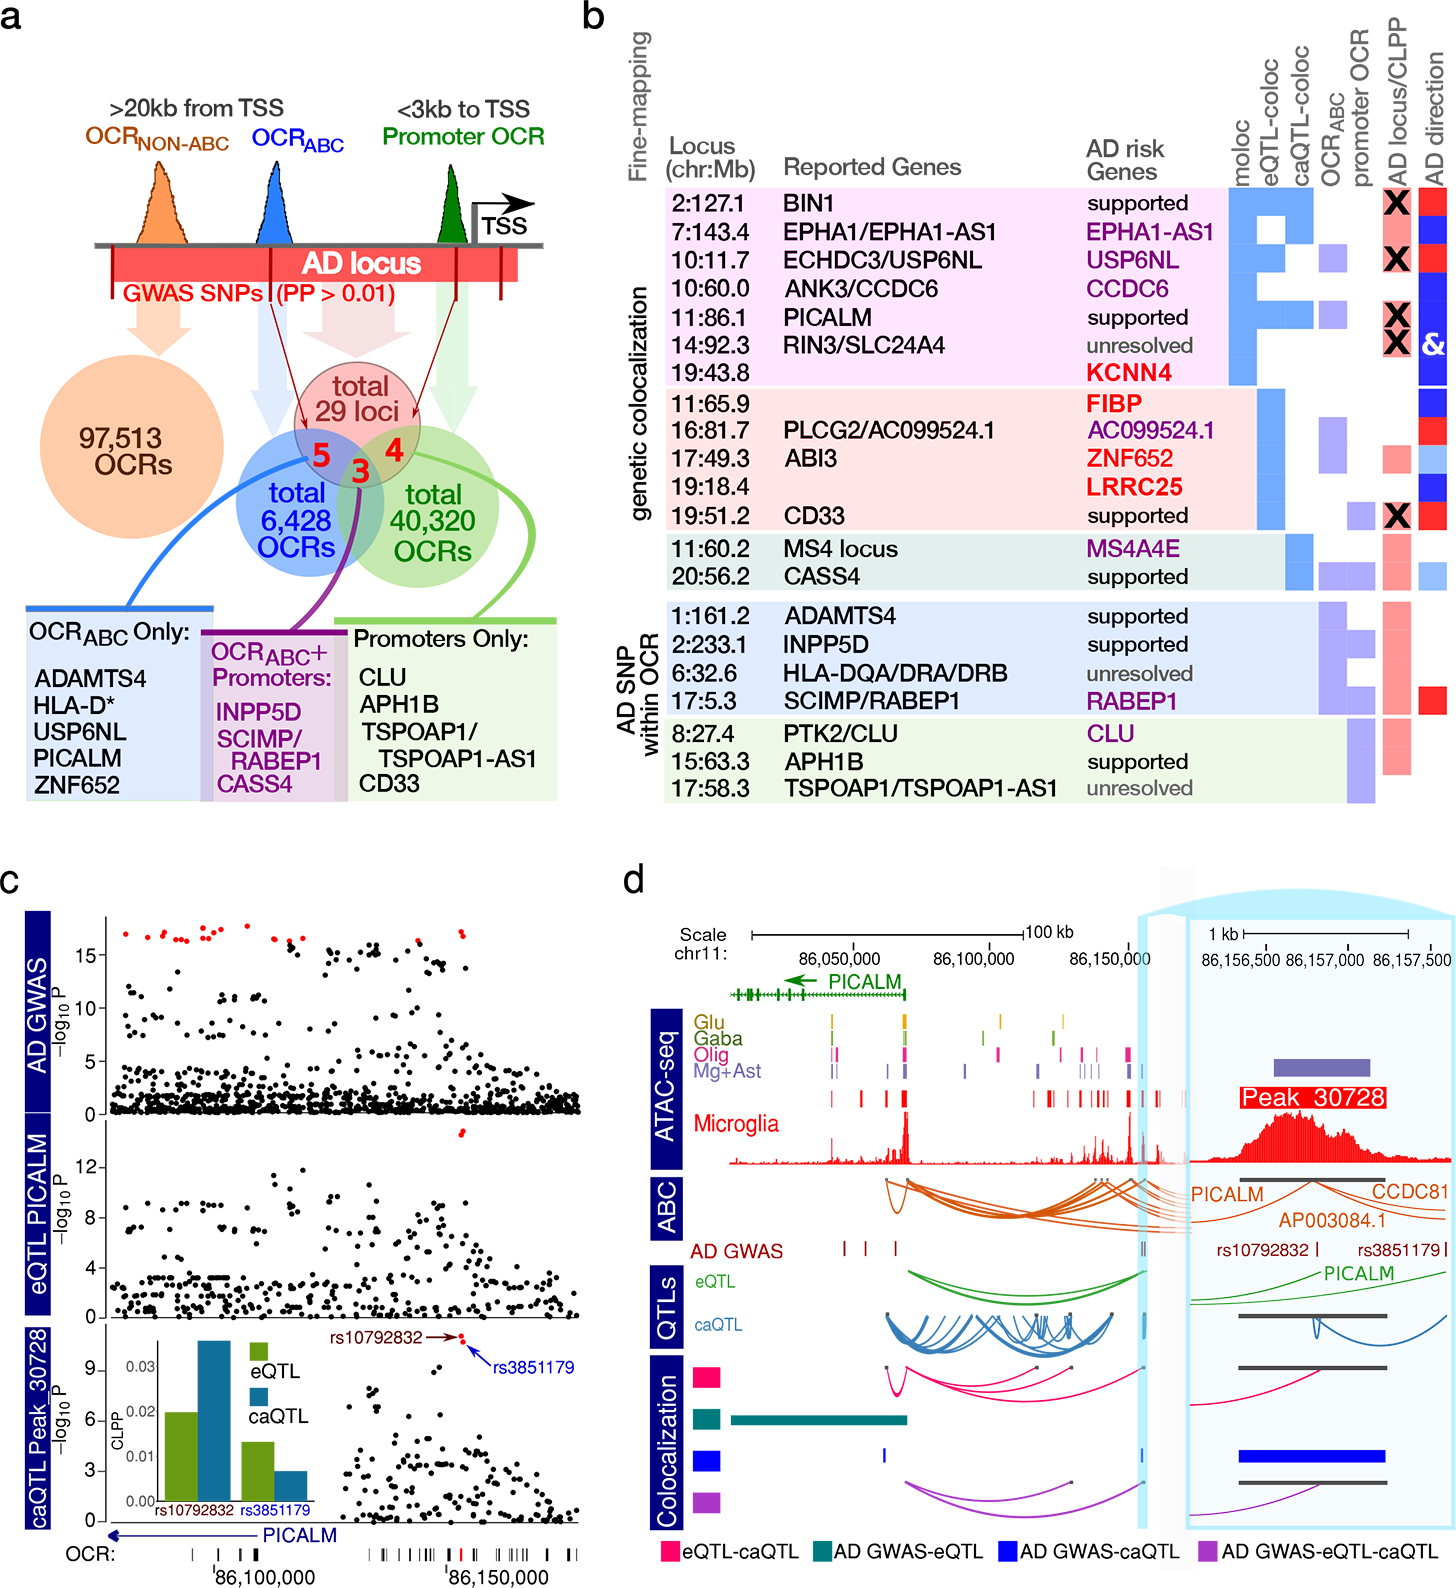
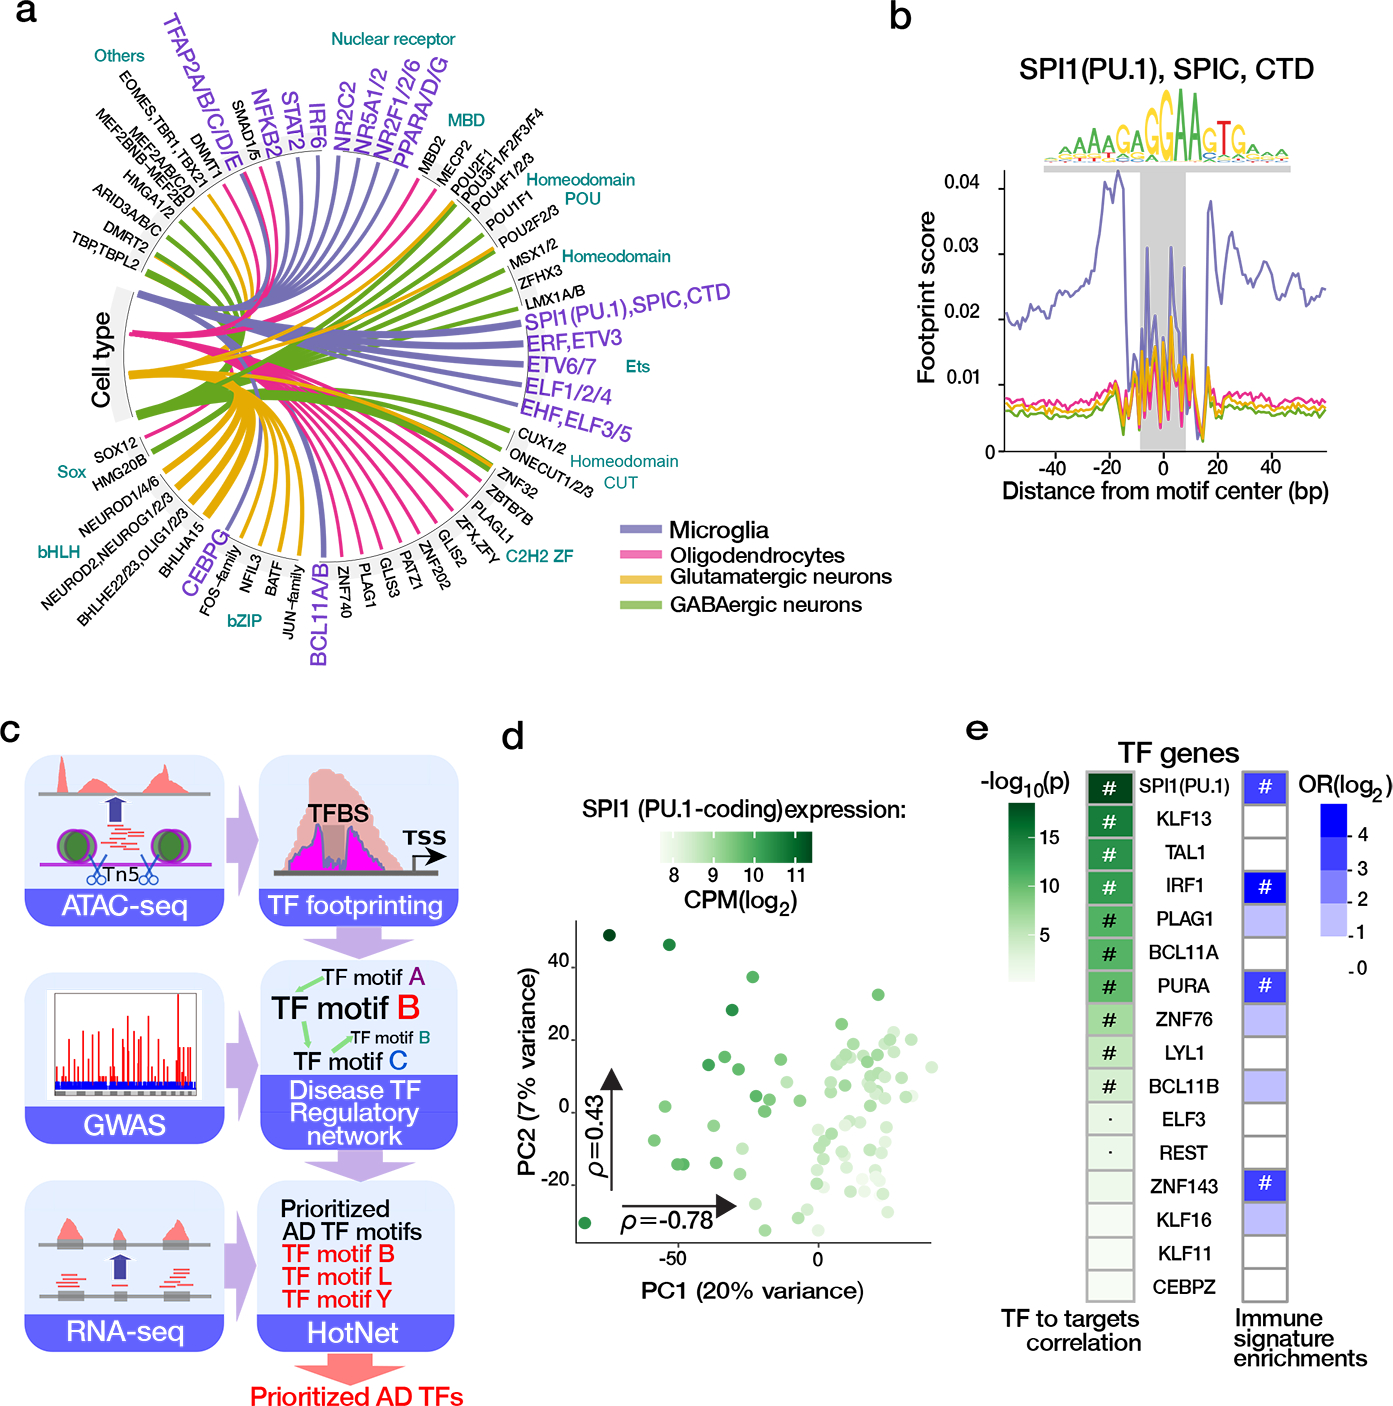
Microglia are brain myeloid cells that play a critical role in neuroimmunity and the etiology of Alzheimer's disease (AD), yet our understanding of how the genetic regulatory landscape controls microglial function and contributes to AD is limited. Here, we performed transcriptome and chromatin accessibility profiling in primary human microglia from 150 donors to identify genetically driven variation and cell-specific enhancer-promoter (E-P) interactions. Integrative fine-mapping analysis identified putative regulatory mechanisms for 21 AD risk loci, of which 18 were refined to a single gene, including 3 new candidate risk genes (KCNN4, FIBP and LRRC25). Transcription factor regulatory networks captured AD risk variation and identified SPI1 as a key putative regulator of microglia expression and AD risk. This comprehensive resource capturing variation in the human microglia regulome provides insights into the etiology of neurodegenerative disease.


Conflict of interest statement

Competing interests: The authors declare no competing interests.

Figures

Extended Data Fig. 1
Extended Data Fig. 1. Schematic outline of data generation and integrative analyses.
The general schema of the data generation, processing and utilization in the analyses described.
Extended Data Fig. 2
Extended Data Fig. 2. FACS gating of fresh microglia
The gating strategy for a representative sample targeting live (DAPI−) CD45+ microglia.
Extended Data Fig. 3
Extended Data Fig. 3. Comparison of human microglia RNA-seq dataset to other available microglia datasets.
Comparison of human microglia RNA-seq dataset to other available microglia datasets. We applied multidimensional scaling (MDS) to expression data processed by the standard RAPiD pipeline (https://github.com/CommonMindConsortium/RAPiD-nf/blob/master/tutorial.md) for the two microglia transcriptomics datasets whose eQTLs were utilized in meta-eQTL analyses, as well as other relevant cell types. a) Comparisons include other brain-derived populations and b) only the three microglia and one monocyte datasets.
Extended Data Fig. 4
Extended Data Fig. 4. Comparison of caQTLs and eQTLs identified in our human microglia to relevant publicly available datasets.
a) π1 replication of caQTLs identified in our microglia data to macrophage caQTLs from Alasoo et al. 18 and brain homogenate from CommonMind 19 ; b) π1 replication of eQTLs identified in our microglia data to microglia eQTLs from Young et al. 7 and Lopes et al. 8, and to macrophage eQTLs from Alasoo et.al 18.
Extended Data Fig. 5
Extended Data Fig. 5. The distribution and LDsc analyses of colocalized eQTLs and caQTLs.
a) Venn diagrams represent the colocalized 1,457 OCR-Gene pairs among meta-caQTLs (green) and meta-eQTLs (red). Colocalized OCR-Gene pairs include 16 OCRs and 14 genes not significant in standalone meta-caQTLs and meta-eQTLs; b) The distribution of the distance between the OCRs and genes for the colocalized caQTLs and eQTL pairs. Mean distance is 101 kb, and median distance is 53 kb. c) Overlap between OCR-gene links identified via caQTL-eQTL colocalization method versus E-P links identified via the ABC approach; d) CaSNPs for the caQTLs colocalized with eQTLs are more likely to be located within OCRABC than in random OCRs. Red line represents the number of OCRABC regulated by colocalized caQTL, versus the distribution of OCRABC from 100 random sets of 1,457 distance-matched eQTL/caQTL pairs (P = 4.2 × 10⁻¹², two-sided t-test). e) Enrichment of SNPs representing 95% confidence intervals for the meta-caQTL and meta-eQTL sets identified in fresh microglia via LDscore analyses using summary statistics from a set of selected GWAS studies. For each genetic variant the value utilized was the highest product between posterior probabilities from eQTL and caQTL analyses (n = 30,028). Values in dark blue represent nominally significant enrichment. The utilized GWAS studies are described in Supplementary Table 6, including the number of snps from each study. Coefficients from LD score regression (two-sided linear regression) are normalized by the per-SNP heritability (h2 /total SNPs per GWAS), with horizontal bars indicating SE (AD P = 0.036, FDR P = 0.17).
Extended Data Fig. 6
Extended Data Fig. 6. Integration of the landscape of AD etiology with genetic regulation of transcriptional and chromatin accessibility in microglia within the EPHA1-AS1 locus.
a) Local plot showing results from AD GWAS 13, eQTL analysis of EPHA1/EPHA1-AS1, and caQTL analysis of peak_188003 (P values are nominal significance estimates from two-sided logistic regression for GWAS, and mixed linear regression for QTL analyses). CLPP is the joint posterior probabilities 47 between the eSNP/caSNP PP and Jansen AD GWAS PP. Red points indicate genetic variants in the 95% credible set from statistical fine-mapping of each trait. Inset shows colocalization posterior probabilities (CLPP) for the top variant in the credible set for gene expression and chromatin accessibility. b) Visualization of EPHA1/EPHA1-AS1 locus showing: open chromatin regions from 4 cell populations 5 and microglia from this study; E-P interactions (ABC); fine-mapped variants from AD (Jansen) 13 ; genetic regulation from eQTLs and caQTL form thus study; and colocalization analysis between pairs of traits (i.e. AD GWAS, gene expression chromatin accessibility) using ‘coloc’ and all three traits using ‘moloc’ methods with Jansen et al. AD GWAS (PP15 >0.5) 29.
Extended Data Fig. 7
Extended Data Fig. 7. Relationship between colocalized components and predicted functional annotation at EPHA1-AS1 locus
Relationship between EPHA1-AS1 expression, OCR peak_188003 and rs11771145. a) Application of Causal Inference Test 48 identifies a genetic variant’s regulation on transcriptional activity of AD-implicated genes mediated by its effect on chromatin accessibility (one-sided Omnibus F-statistics) b) Correlation between the expression of EPHA1 and EPHA1-AS1, ATAC-seq signal at OCR peak_188003 and the genotype of rs11771145 (two-sided Spearman test). c) Predicted function of EPHA1-AS1 based on coexpression structure. lncHUB 31 predicts gene set annotations of every gene based on genome-wide co-expression structure and known annotations. Results are from query https://maayanlab.cloud/lnchub/?lnc=EPHA1-AS1.
Extended Data Fig. 8
Extended Data Fig. 8. Local manhattan plot of AD GWAS 13, and eQTL analysis for FIBP.
Red points indicate variants within the 95% confidence interval from statistical fine-mapping. P values are nominal significance estimates from two-sided logistic regression for GWAS, and mixed linear regression for QTL analyses
Extended Data Fig. 9
Extended Data Fig. 9. Local manhattan plot of AD GWAS 13, and eQTL analysis for LRRC25.
Red points indicate variants within the 95% confidence interval from statistical fine-mapping. P values are nominal significance estimates from two-sided logistic regression for GWAS, and mixed linear regression for QTL analyses.
Extended Data Fig. 10
Extended Data Fig. 10. Local manhattan plot of AD GWAS 13, eQTL analysis for KCNN4 and caQTL for Peak_82668.
Bottom row indicates open chromatin regions in the window, and the red region indicates the target peak for caQTL analysis shown. Red points indicate variants within the 95% confidence interval from statistical fine-mapping. P values are nominal significance estimates from two-sided logistic regression for GWAS, and mixed linear regression for QTL analyses
Fig. 1.
Fig. 1.. Chromatin accessibility landscape in human microglia and AD predisposition.
a) Schematic outline of data generation. b) Comparison of human microglia ATAC-seq dataset to other brain open chromatin datasets (Supplementary Table 5) utilizing jointly called OCRs in multidimensional scaling space. c) Enrichment of trait-associated genetic variants in neuronal (NeuN+, n = 315,630), non-neuronal (NeuN, n = 205,120), and microglia (n = 210,832) OCRs. The utilized GWAS studies are described in Supplementary Table 6, including the number of SNPs from each study. Estimated coefficients from LD score regression are normalized by the per-SNP heritability (h2/total SNPs per GWAS), with horizontal bars indicating standard error (AD FDR = 0.99, 0.60, and 0.027 for NeuN+, NeuN, and microglia, respectively).
Fig. 2.
Fig. 2.. Transcriptional regulation by open chromatin regions.
a) Fraction of transcriptional variation for each gene explained by accessible chromatin for observed data (blue) and permuted data (grey) (*** indicates P <10−323, one-sided Wilcoxon test) b) Distribution of distance from TSS for E-P interactions (top right); histograms of the number of OCRABC per gene (bottom left), the number of genes per OCRABC (bottom middle) and the number of skipped genes between the OCRABC and the linked gene (bottom right). c) OCRABC involved in E-P interactions have stronger correlation with the expression of the corresponding gene compared to a subset of non E-P pairs, matched by the distance. The lines represent the predicted relationship (generalized additive model), and shaded areas reflecting 95% confidence interval. d) OCRABC involved in E-P interactions (n = 18,018) have stronger correlation with the OCR at the linked promoter compared to OCRs not in an E-P link (n = 2,560,916). Horizontal center lines indicate the median, and thick vertical lines indicate interquartile range, thin vertical line indicate upper and lower adjacent values (first quartile - 1.5IQR, third quartile + 1.5IQR), and the top and bottom of the violin plot boundary define maxima and minima. e) Enrichment of microglia E-P interactions with non-neuronal (NeuN, Nshared linked E-Pairs = 4,729, NMicroglia Only linked E-Pairs = 18,406) and neuronal (NeuN+, Nshared linked E-Pairs = 2,869, NMicroglia Only linked E-Pairs = 20,266) E-P interactions amongst all considered E-P pairs (NAll tested E-P pairs=289,993 with E-P distance < 229.9 Kb, containing 95% of all linked E-P pairs). Colored bars indicate the odds ratio and error bars represent 95% confidence intervals. f) Enrichment of trait-associated genetic variants in neuronal (NeuN+, n = 38,233), non-neuronal (NeuN, n = 37,056), microglia (n = 24,497) and microglia-specific (n = 18,678) E-P interactions. The utilized GWAS studies are described in Supplementary Table 6, including the number of SNPs from each study. Coefficients from LD score regression (two-sided linear regression) are normalized by the per-SNP heritability (h2/total SNPs per GWAS), with horizontal bars indicating standard error (AD FDR = 0.97, 0.48 and 0.0049 for NeuN+, NeuN, and microglia, respectively).
Fig. 3.
Fig. 3.. Genetic regulation of chromatin accessibility in human microglia.
a) Count of OCRs with caQTL signals in microglia (Mg) and macrophages (Mφ) shown by cell type specificity based on Bayesian meta-analysis. Analysis of microglia-only OCRs gives caQTLs specific to microglia (green), and analysis of shared OCRs gives both shared and cell type specific caQTLs. b) QQ plot of nominal P values reflecting the concordance between DeepSEA predictions and caQTL regression coefficient. Significant assays from myeloid lineages are indicated by colors; c) Spearman correlation between caSNPs’ effect size estimated by caQTL analysis and by DeepSEA predicted effect on epigenetic assays for promoters/enhancers (green) and repressors (purple). P values for each test are indicated. Red horizontal bars correspond to positive relationships, and blue correspond to negative relationships. d) Concordance between caSNPs’ allelic effects on chromatin accessibility and the predicted change in motif binding ability for PU.1 compared to all 53 TFs (including PU.1), whose binding sites were significantly disrupted by caSNPs. Concordance proportion is shown for SNPs exceeding the specified fine-mapping posterior probability, with shaded regions indicating 95% confidence intervals. e) Enrichment for fine-mapped caSNPs within OCRABC also being fine-mapped eSNPs for the target genes compared to those in OCRs not involved in E-P interactions. Enrichments are shown over a range of posterior probability cutoffs applied to both caSNPs and eSNPs. Lines indicate the odds ratios, and shaded areas represent 95% confidence intervals. f) Enrichment of trait-associated genetic variants in 95% credible set of microglia meta-eSNPs (n = 468,604) and meta-caSNPs (n = 269,536). The utilized GWAS studies are described in Supplementary Table 6, including the number of SNPs from each study. Estimated coefficients from LD score regression are normalized by the per-SNP heritability (h2/total SNPs per GWAS), with horizontal bars indicating standard error (AD FDR = 0.0025 and 0.017 for eSNPs and caSNPs, respectively).
Fig. 4.
Fig. 4.. Integration of AD etiologic landscape with genetic regulation of transcriptional and chromatin accessibility in microglia.
a) Overlap of 316 fine-mapped SNPs from 29 AD GWAS loci (red) with OCRABC (blue) and promoters (green), with 3 loci supported with both OCRABC and promoters (purple). b) Fine-mapping to define candidate AD genes based on: (i) joint colocalization for eQTL, caQTL and GWAS signal (‘moloc’) (lilac); colocalization for (ii) eQTL and GWAS (‘eQTL-coloc’) (pink); and (iii) caQTL and GWAS (‘caQTL-coloc’) (teal) signal; fine-mapped AD variants (PP>0.01) within (iv) OCRABC (blue) and (v) promoter (green) OCRs. ‘AD GWAS’ indicates regions identified by Jansen et al. , and ‘x’ indicates significant joint fine-mapping with gene expression or chromatin accessibility. ‘AD direction’ is the linked gene’s expression in relation to the AD risk alleles (red = higher; blue = lower, ‘&’ indicates consistency for multiple genes in the region. Shade indicates the confidence in the direction assignment). Color schema for ‘Linked Genes’: genes are unambiguously fine-mapped and previously implicated in AD (purple); not previously fine-mapped as AD risk genes (red). The novel putative AD risk genes outside previously reported AD loci are shown in bold. c) Local plot showing results from AD GWAS , eQTL analysis of PICALM, and caQTL analysis of peak_30728. Red points indicate genetic variants in the 95% credible set from statistical fine-mapping of each trait. Inset shows colocalization posterior probabilities (CLPP) for the top variants in the credible set for gene expression and chromatin accessibility. d) Visualization of the PICALM locus showing: open chromatin regions from 4 cell populations and microglia from this study; E-P interactions (ABC); fine-mapped (PP>0.05) SNPs from AD GWAS ,,; genetic regulation from eQTLs and caQTL form thus study; and colocalization analysis between pairs of traits (i.e. AD GWAS, gene expression chromatin accessibility) using ‘coloc’ and all three traits using ‘moloc’ methods. Inset focuses on the 1.5 kb region immediately flanking peak_30728.
Fig. 5.
Fig. 5.. Transcription factor binding landscape in microglia integrating AD genetics.
a) Top cell-specific TF binding events detected by TF footprinting in the microglia and three other major brain cell lineages . Line thickness indicates the fold enrichment in the highlighted cell types compared to the mean number of bound TFs in other cell types (all BH<0.05, one-sided binomial test). b) Aggregated footprint profile of PU1 motif within the jointly called OCRs in the four cell populations (total number of detected PU.1 motifs = 192,514). Plot outline colors the same as in panel (a). c) Schema for AD TF prioritization analysis. d) Principal component analysis of expression for predicted PU1 targets genes for n=127 samples colored by expression of PU1-encoding SPI1 gene. Spearman correlation (ρ) with each principal component. e) Prioritization of TFs from AD TF regulatory networks based on correlation with PC1 of the respective downstream target genes (shaded in green by P value, ‘#’ = FDR < 0.05, ‘·’ = P value < 0.05, two-sided linear regression). Right column: Enrichment analyses of the TF downstream target genes for immune-related gene signatures. The values represent odds ratio enrichment for immune-related signatures among enrichments for all functional signatures. Significant enrichment (FDR < 0.05, two-sided Fisher’s Exact Test) is indicated by “#”.

References

    1. Salter MW & Stevens B Microglia emerge as central players in brain disease. Nat. Med. 23, 1018–1027 (2017). - PubMed
    1. Bartels T, De Schepper S & Hong S Microglia modulate neurodegeneration in Alzheimer’s and Parkinson’s diseases. Science 370, 66–69 (2020). - PubMed
    1. Song WM & Colonna M The identity and function of microglia in neurodegeneration. Nat. Immunol. 19, 1048–1058 (2018). - PubMed
    1. Nott A et al. Brain cell type-specific enhancer-promoter interactome maps and disease-risk association. Science 366, 1134–1139 (2019). - PMC - PubMed
    1. Hauberg ME et al. Common schizophrenia risk variants are enriched in open chromatin regions of human glutamatergic neurons. Nat. Commun. 11, 5581 (2020). - PMC - PubMed

Publication types