. 2022 Aug 5;22(1):196.
doi: 10.1186/s12902-022-01112-5.

Correlation of obesity, dietary patterns, and blood pressure with uric acid: data from the NHANES 2017-2018

Affiliations

Correlation of obesity, dietary patterns, and blood pressure with uric acid: data from the NHANES 2017-2018

Jia Yao et al. BMC Endocr Disord. .

Abstract

Background: Prevalence rates of hyperuricemia and gout are increasing. Clinical investigations of hyperuricemia-related risk factors aid in the early detection, prevention, and management of hyperuricemia and gout. Ongoing research is examining the association of obesity, dietary patterns, and blood pressure (BP) with serum uric acid (sUA).

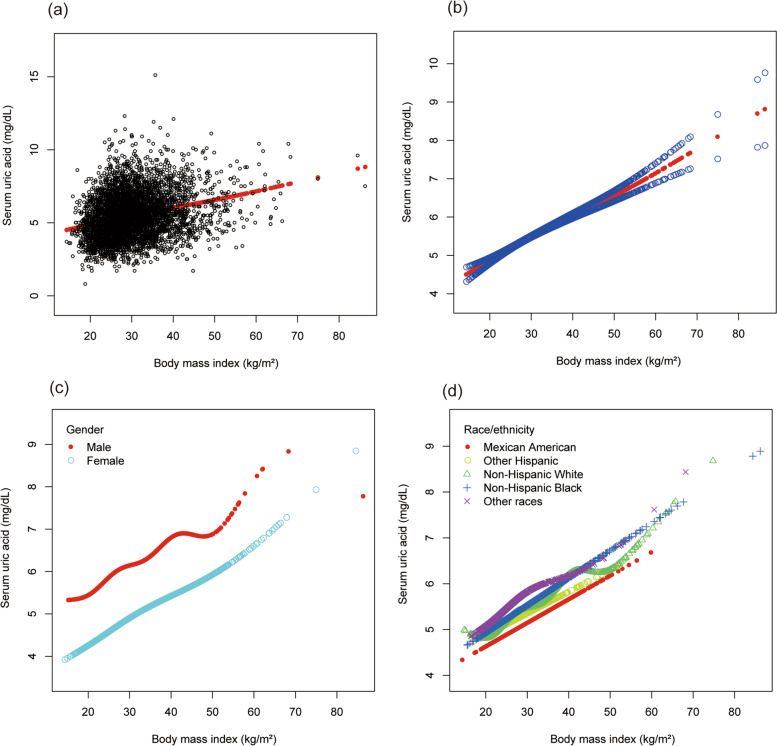
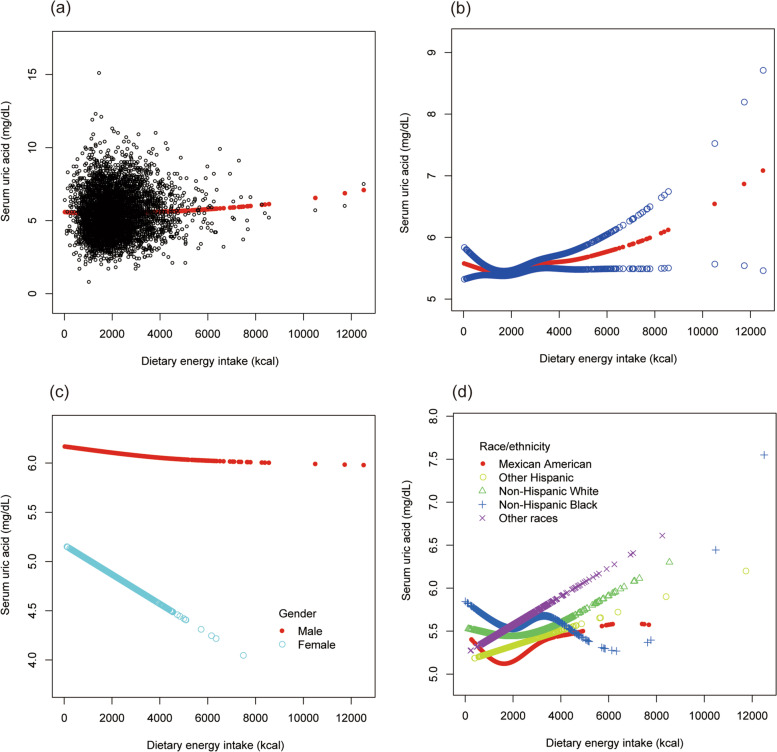
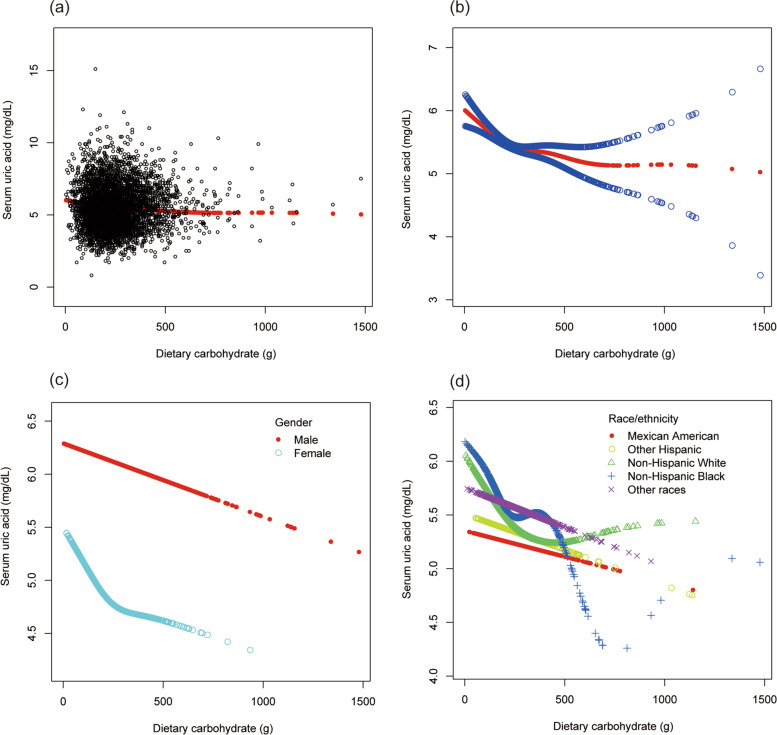
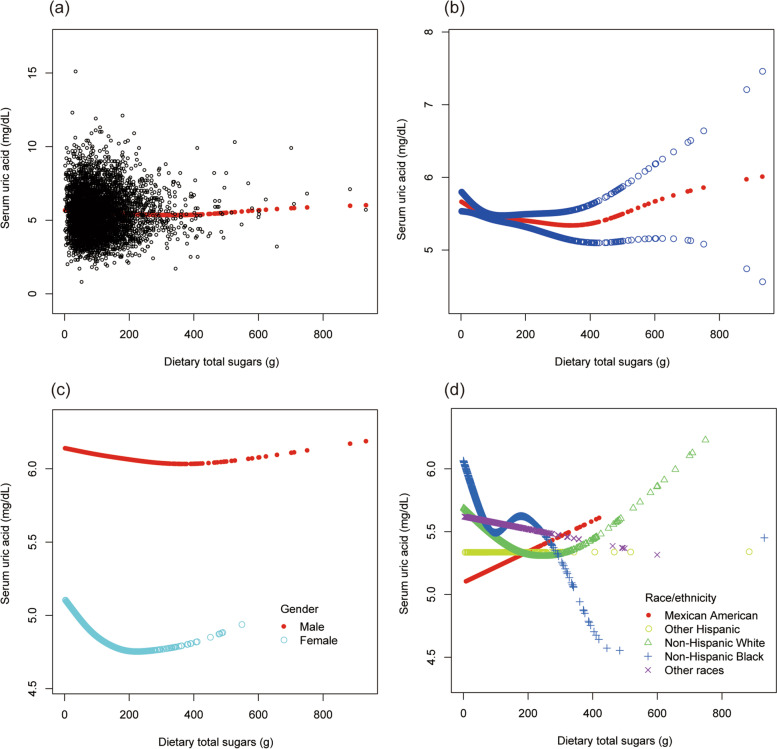
Methods: A cross-sectional study was conducted based on the National Health and Nutrition Examination Survey. The exposures included body mass index (BMI), dietary patterns, and BP. The outcome variable was sUA level. The weighted multivariate linear regression models and smooth curve fittings were used to assess the association of BMI, dietary patterns, and BP with sUA.

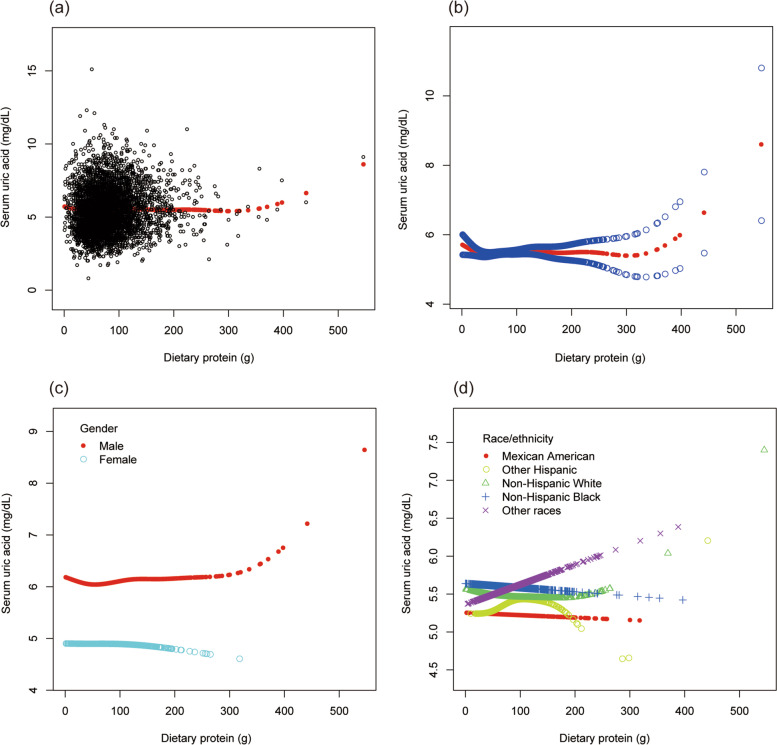
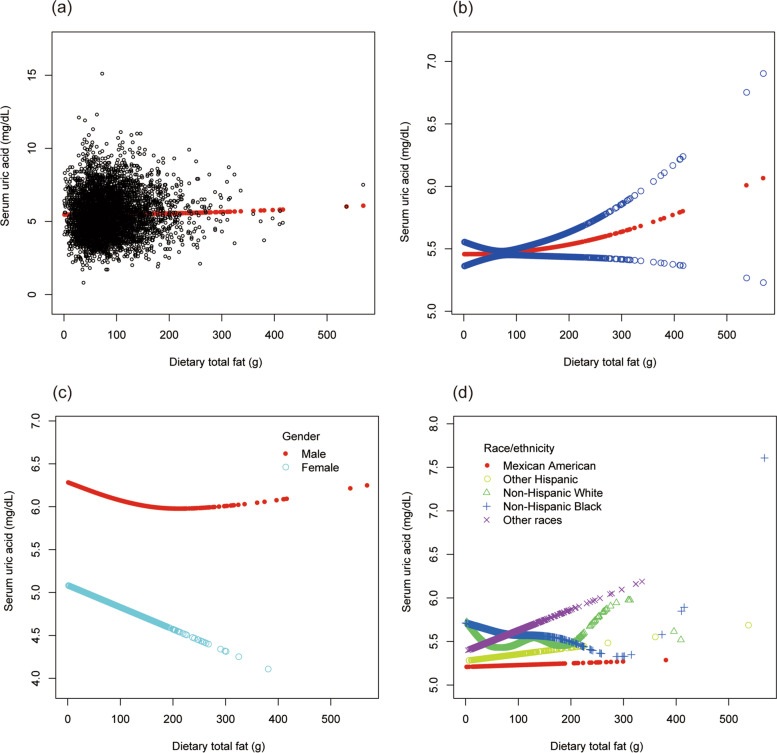
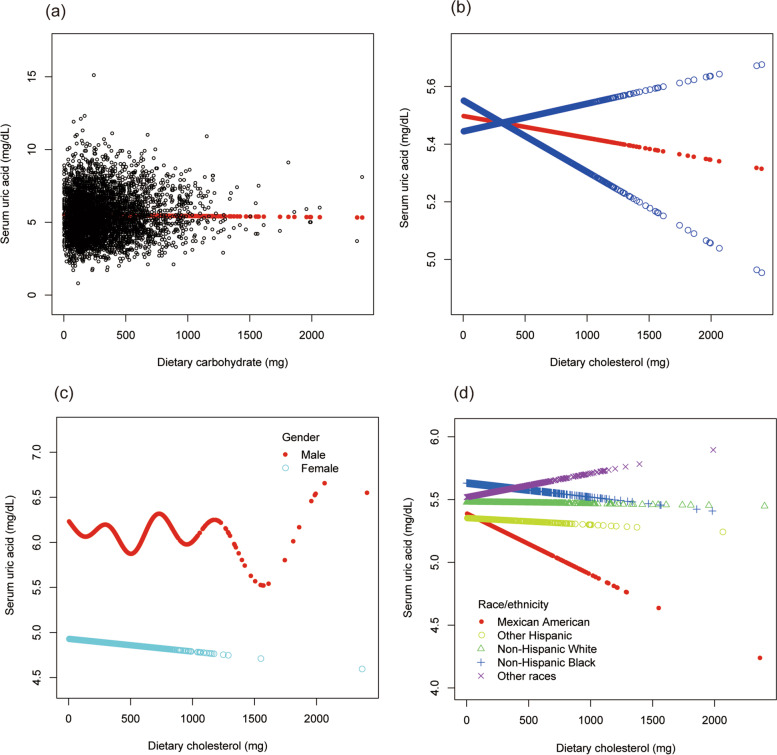
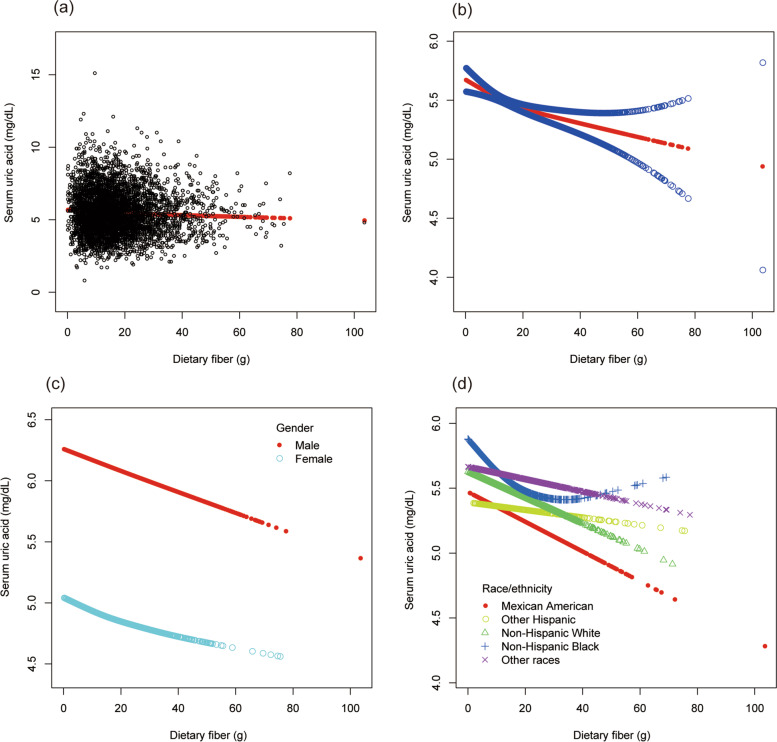
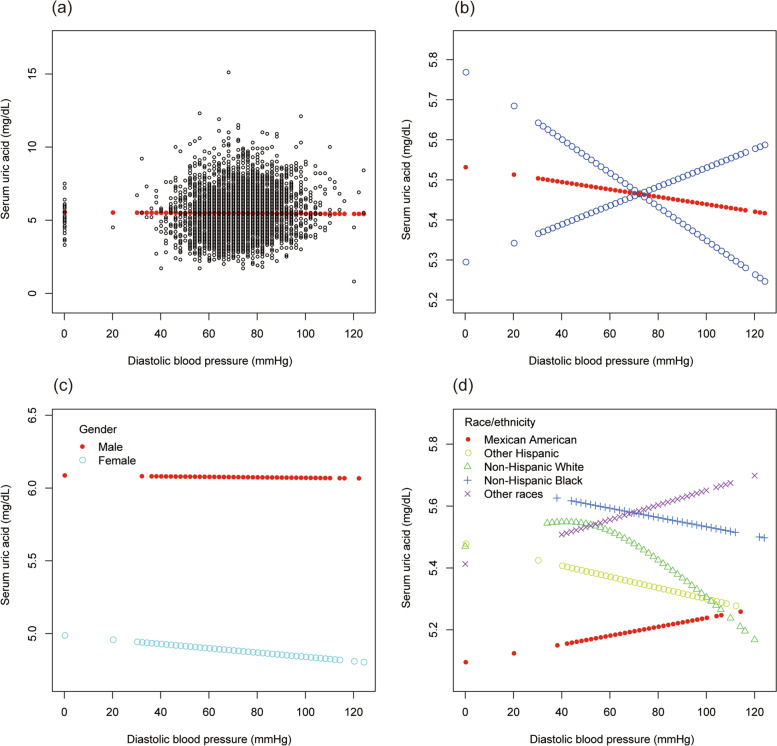
Results: There was a significantly positive correlation between BMI and sUA (β = 0.059, 95% CI: 0.054 to 0.064, P < 0.00001). Overweight and obese individuals had higher sUA levels than those with the normal BMI (β = 0.451, 95% CI: 0.357 to 0.546, P < 0.00001; β = 0.853, 95% CI: 0.760 to 0.946, P < 0.00001; respectively). Dietary energy intake was positively correlated with sUA (β = 0.000, 95% CI: 0.000 to 0.000, P = 0.01057). Dietary intake of carbohydrate and fiber were negatively correlated with sUA (β = - 0.001, 95% CI: - 0.002 to - 0.000, P < 0.00001; β = - 0.008, 95% CI: - 0.011 to - 0.004, P = 0.00001; respectively). Moreover, systolic BP was positively correlated with sUA (β = 0.006, 95% CI: 0.003 to 0.009, P = 0.00002). However, no statistical differences were found about the associations of dietary intake of total sugars, protein, total fat, cholesterol, and diastolic BP with sUA.

Conclusions: The current cross-sectional investigation of a nationally representative sample of US participants showed that BMI, dietary energy intake, and systolic BP were positively correlated with sUA levels; dietary carbohydrate and fiber intake were negatively correlated with sUA levels. The findings might be helpful for the management and treatment of hyperuricemia and gout.

Keywords: Blood pressure; Diet; NHANES; Obesity; Uric acid.


Conflict of interest statement

All authors declare no competing interest.

Figures

Fig. 1
Fig. 1
The association between body mass index and serum uric acid. a Each black point represents a sample. b The solid red line represents the smooth curve fit between variables. c Stratified by gender. d Stratified by race/ethnicity
Fig. 2
Fig. 2
The association between dietary energy intake and serum uric acid. a Each black point represents a sample. b The solid red line represents the smooth curve fit between variables. Blue bands represent the 95% of confidence interval from the fit. c Stratified by gender. d Stratified by race/ethnicity
Fig. 3
Fig. 3
The association between dietary carbohydrate and serum uric acid. a Each black point represents a sample. b The solid red line represents the smooth curve fit between variables. Blue bands represent the 95% of confidence interval from the fit. c Stratified by gender. d Stratified by race/ethnicity
Fig. 4
Fig. 4
The association between dietary total sugars and serum uric acid. a Each black point represents a sample. b The solid red line represents the smooth curve fit between variables. Blue bands represent the 95% of confidence interval from the fit. c Stratified by gender. d Stratified by race/ethnicity
Fig. 5
Fig. 5
The association between dietary protein and serum uric acid. a Each black point represents a sample. b The solid red line represents the smooth curve fit between variables. Blue bands represent the 95% of confidence interval from the fit. c Stratified by gender. d Stratified by race/ethnicity
Fig. 6
Fig. 6
The association between dietary total fat and serum uric acid. a Each black point represents a sample. b The solid red line represents the smooth curve fit between variables. Blue bands represent the 95% of confidence interval from the fit. c Stratified by gender. d Stratified by race/ethnicity
Fig. 7
Fig. 7
The association between dietary cholesterol and serum uric acid. a Each black point represents a sample. b The solid red line represents the smooth curve fit between variables. Blue bands represent the 95% of confidence interval from the fit. c Stratified by gender. d Stratified by race/ethnicity
Fig. 8
Fig. 8
The association between dietary fiber and serum uric acid. a Each black point represents a sample. b The solid red line represents the smooth curve fit between variables. Blue bands represent the 95% of confidence interval from the fit. c Stratified by gender. d Stratified by race/ethnicity
Fig. 9
Fig. 9
The association between systolic blood pressure and serum uric acid. a Each black point represents a sample. b The solid red line represents the smooth curve fit between variables. Blue bands represent the 95% of confidence interval from the fit. c Stratified by gender. d Stratified by race/ethnicity
Fig. 10
Fig. 10
The association between diastolic blood pressure and serum uric acid. a Each black point represents a sample. b The solid red line represents the smooth curve fit between variables. Blue bands represent the 95% of confidence interval from the fit. c Stratified by gender. d Stratified by race/ethnicity

References

    1. Chen-Xu M, Yokose C, Rai SK, Pillinger MH, Choi HK. Contemporary prevalence of gout and hyperuricemia in the United States and decadal trends: the National Health and nutrition examination survey, 2007-2016. Arthritis Rheumatol (Hoboken, NJ) 2019;71(6):991–999. doi: 10.1002/art.40807. - DOI - PMC - PubMed
    1. Zeng J, Lawrence WR, Yang J, Tian J, Li C, Lian W, He J, Qu H, Wang X, Liu H, et al. Association between serum uric acid and obesity in Chinese adults: a 9-year longitudinal data analysis. BMJ Open. 2021;11(2):e041919. doi: 10.1136/bmjopen-2020-041919. - DOI - PMC - PubMed
    1. Chen MY, Zhao CC, Li TT, Zhu Y, Yu TP, Bao YQ, Li LX, Jia WP. Serum uric acid levels are associated with obesity but not cardio-cerebrovascular events in Chinese inpatients with type 2 diabetes. Sci Rep. 2017;7:40009. doi: 10.1038/srep40009. - DOI - PMC - PubMed
    1. Ali N, Miah R, Hasan M, Barman Z, Mou AD, Hafsa JM, Trisha AD, Hasan A, Islam F. Association between serum uric acid and metabolic syndrome: a cross-sectional study in Bangladeshi adults. Sci Rep. 2020;10(1):7841. doi: 10.1038/s41598-020-64884-7. - DOI - PMC - PubMed
    1. FitzGerald JD, Dalbeth N, Mikuls T, Brignardello-Petersen R, Guyatt G, Abeles AM, Gelber AC, Harrold LR, Khanna D, King C, et al. 2020 American College of Rheumatology Guideline for the Management of Gout. Arthritis Rheumatol (Hoboken, NJ) 2020;72(6):879–895. doi: 10.1002/art.41247. - DOI - PubMed