

An in vivo critically colonised wound model with dysbiotic wound microbiota
- PMID: 35932181
- PMCID: PMC9927901
- DOI: 10.1111/iwj.13906
An in vivo critically colonised wound model with dysbiotic wound microbiota
Abstract
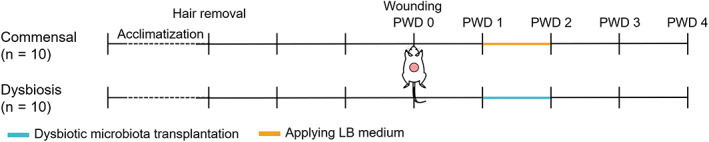
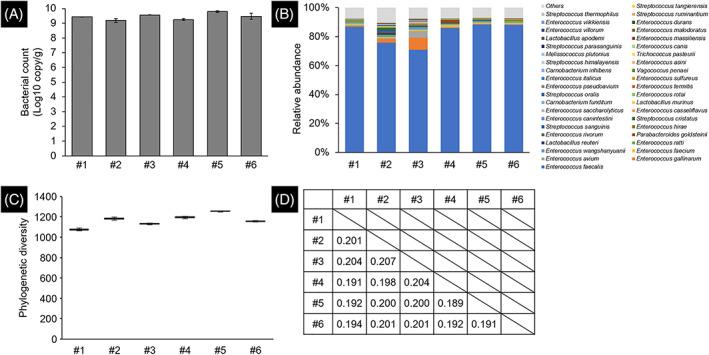
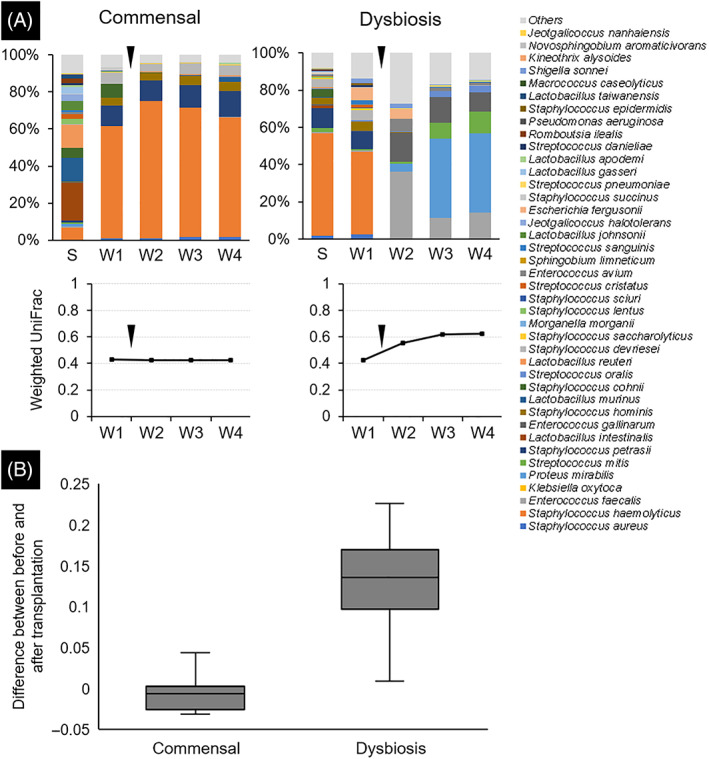
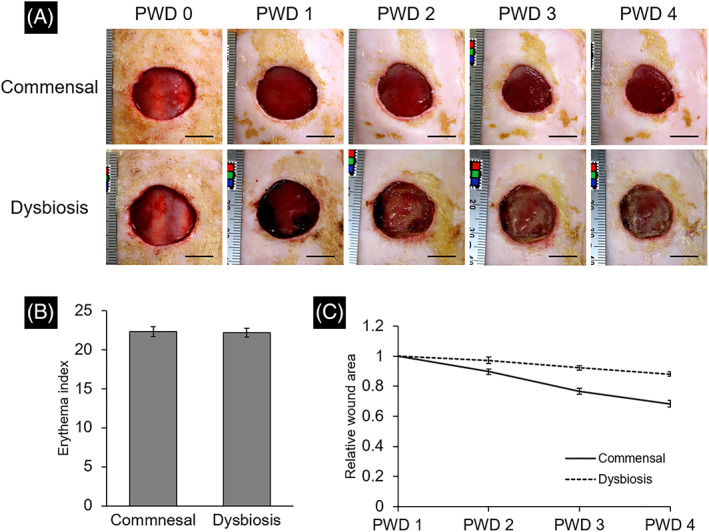
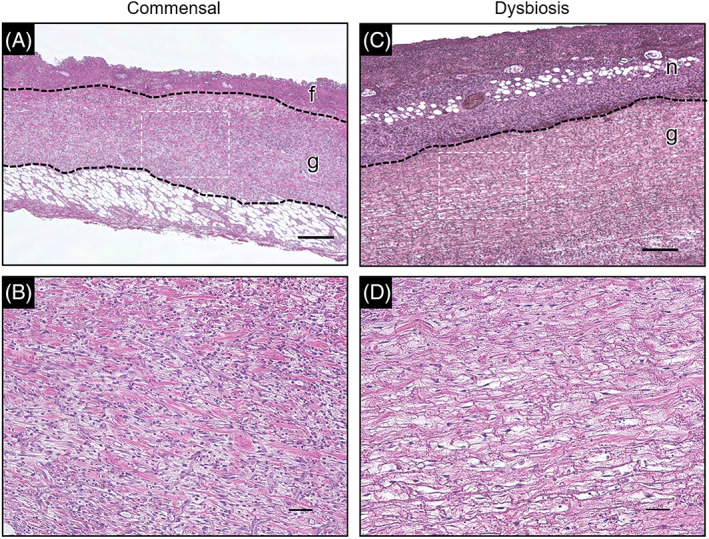
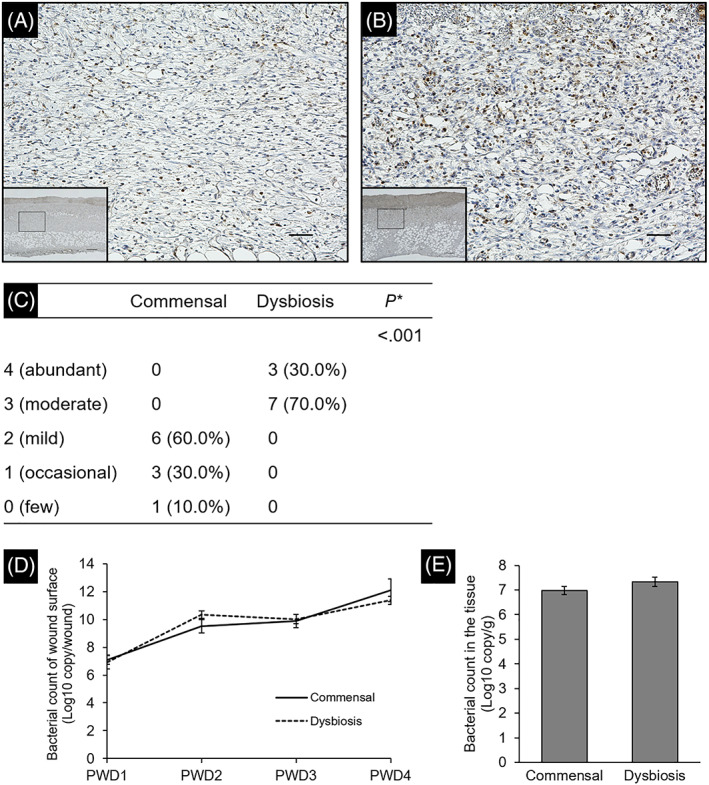
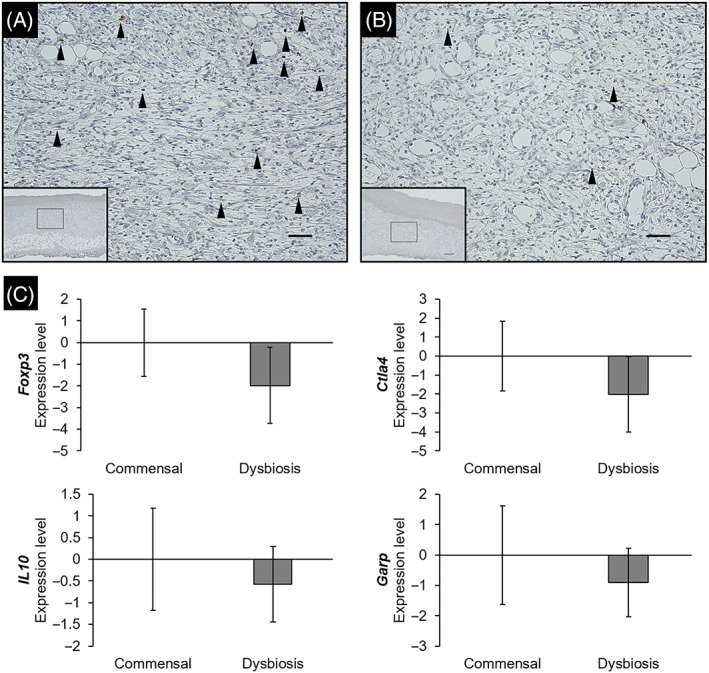
In critically colonised wounds, many of the signs of infection are often absent, and delayed healing may be the only clinical sign. The prevention of critical colonisation is important, but its pathophysiology has not yet been elucidated. We have previously reported that dysbiotic microbiota dissimilar to the peri-wound skin microbiota may develop in critically colonised wounds. To investigate the role of dysbiotic microbiota, this study aimed to develop a critically colonised wound model by transplantation of dysbiotic microbiota. To transplant microbiota, a bacterial solution (dysbiosis group) or with Luria-Bertani medium (commensal group) was inoculated to full-thickness wounds of rats. The bacterial solution was prepared by anaerobically culturing bacteria from donor rats on an artificial dermis in Luria-Bertani medium for 72 hours. As a result, the degree of the change in the microbial similarity between pre- and post-transplantation of microbiota was significantly higher in the dysbiosis group (P < .001). No signs of infection were observed in any rat in either group. The wound area in the dysbiosis group was significantly larger (P < .001), and there was a significant infiltration of neutrophils (P < .001). All rats of the dysbiosis group represented the clinical features of critically colonised wounds. Furthermore, there were significantly fewer regulatory T cells in the wounds of the dysbiosis group. This is the first study to develop a novel animal model that represents the clinical features of critically colonised wounds and will be useful in investigating the pathogenesis of critical colonisation via regulatory T cells.
Keywords: 16S ribosomal RNA; chronic wounds; hard-to-heal wounds; microbiome; wound infection.
© 2022 The Authors. International Wound Journal published by Medicalhelplines.com Inc and John Wiley & Sons Ltd.
Conflict of interest statement
Takeo Minematsu and Sofoklis Koudounas belong to the Department of Skincare Science, which receives financial support from Saraya Co., Ltd.
Figures
Similar articles
-
Relationship Between Dysbiotic Wound Microbiota and Critical Colonization: Involvement of FOXP3-Positive Cells in Rats.Ann Plast Surg. 2024 Nov 1;93(5):617-623. doi: 10.1097/SAP.0000000000004092. Epub 2024 Sep 4. Ann Plast Surg. 2024. PMID: 39356291
-
Relationship between healing status and microbial dissimilarity in wound and peri-wound skin in pressure injuries.J Tissue Viability. 2023 Feb;32(1):144-150. doi: 10.1016/j.jtv.2022.10.006. Epub 2022 Oct 31. J Tissue Viability. 2023. PMID: 36344337
-
[Antiseptic effect of compound lysostaphin disinfectant and its preventive effect on infection of artificial dermis after graft on full-thickness skin defect wound in rats].Zhonghua Shao Shang Za Zhi. 2018 Apr 20;34(4):225-232. doi: 10.3760/cma.j.issn.1009-2587.2018.04.007. Zhonghua Shao Shang Za Zhi. 2018. PMID: 29690741 Chinese.
-
Gut microbiota and host defense in critical illness.Curr Opin Crit Care. 2017 Aug;23(4):257-263. doi: 10.1097/MCC.0000000000000424. Curr Opin Crit Care. 2017. PMID: 28548992 Review.
-
Biodiversity of Skin Microbiota as an Important Biomarker for Wound Healing.Biology (Basel). 2023 Aug 30;12(9):1187. doi: 10.3390/biology12091187. Biology (Basel). 2023. PMID: 37759587 Free PMC article. Review.
Cited by
-
The healing process of diabetic ulcers correlates with changes in the cutaneous microbiota.Sci Rep. 2024 Nov 12;14(1):27628. doi: 10.1038/s41598-024-77987-2. Sci Rep. 2024. PMID: 39528566 Free PMC article.
-
Carbon source competition within the wound microenvironment can significantly influence infection progression.NPJ Biofilms Microbiomes. 2024 Jun 25;10(1):52. doi: 10.1038/s41522-024-00518-4. NPJ Biofilms Microbiomes. 2024. PMID: 38918415 Free PMC article.
References
-
- Edwards R, Harding KG. Bacteria and wound healing. Curr Opin Infect Dis. 2004;17(2):91‐96. - PubMed
-
- James GA, Swogger E, Wolcott R, et al. Biofilms in chronic wounds. Wound Repair Regen. 2008;16(1):37‐44. - PubMed
-
- Murphy C, Atkin L, Dissemond J, et al. Defying hard‐to‐heal wounds with an early antibiofilm intervention strategy: ‘wound hygiene’. J Wound Care. 2019;28(12):818‐822. - PubMed
-
- Kunimitsu M, Nakagami G, Kitamura A, et al. Dissemination of microbiota between wounds and the beds of patients with pressure injuries: a cross‐sectional study. Wound Pract Res. 2021;29(2):70‐76.
-
- Xu Z, Hsia HC. The impact of microbial communities on wound healing: a review. Ann Plast Surg. 2018;81(1):113‐123. - PubMed
MeSH terms
Grants and funding
LinkOut - more resources
Full Text Sources
Research Materials
