. 2022 Oct 21;113(5):500-515.
doi: 10.1093/jhered/esac038.

Extensive genome introgression between domestic ferret and European polecat during population recovery in Great Britain

Affiliations

Extensive genome introgression between domestic ferret and European polecat during population recovery in Great Britain

Graham J Etherington et al. J Hered. .

Abstract

The European polecat (Mustela putorius) is a mammalian predator which occurs across much of Europe east to the Ural Mountains. In Great Britain, following years of persecution the range of the European polecat contracted and by the early 1900s was restricted to unmanaged forests of central Wales. The European polecat has recently undergone a population increase due to legal protection and its range now overlaps that of feral domestic ferrets (Mustela putorius furo). During this range expansion, European polecats hybridized with feral domestic ferrets producing viable offspring. Here, we carry out population-level whole-genome sequencing on 8 domestic ferrets, 19 British European polecats, and 15 European polecats from the European mainland. We used a range of population genomics methods to examine the data, including phylogenetics, phylogenetic graphs, model-based clustering, phylogenetic invariants, ABBA-BABA tests, topology weighting, and Fst. We found high degrees of genome introgression in British polecats outside their previous stronghold, even in those individuals phenotyped as "pure" polecats. These polecats ranged from presumed F1 hybrids (gamma = 0.53) to individuals that were much less introgressed (gamma = 0.2). We quantify this introgression and find introgressed genes containing Fst outliers associated with cognitive function and sight.

Keywords: European polecat; Mustelids; conservation; domestic ferret; genomics; introgression.


Conflict of interest statement

None declared.

Figures

Fig. 1.
Fig. 1.
(A) The range of the European polecat across the Great Britain in 1915. Dark green indicates stronghold, pale green indicates localized or rare occurrences, and “?” indicates uncertain status (Langley and Yalden 1977). (B) The distribution of hectads (10 km × 10 km squares) in which verifiable records of true polecats (dark green), polecat–ferrets (yellow), both true polecats and polecat–ferrets (lime green) and unverifiable records (gray) were received during the 2014 to 2015 European polecat survey (Croose 2016).
Fig. 8.
Fig. 8.
Admixture statistics for fd, fdM, and df across a 7 Mb stretch of Super-scaffold_13. The red bar highlights the window of 1,000 SNPs in the top 1-percentile of fdM values, the black rectangle represents a cluster of 140 Fst outliers, and the black triangle represent the location of the protein-coding gene ENSMPUG00000008056.
Fig. 2.
Fig. 2.
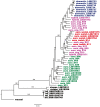
ML phylogeny with 1,000 bootstrap replicates, for whole mitochondrial genomes of all 49 samples in this study, with main haplotype groups annotated. Numbers at nodes refer to bootstrap support values of 95 and above. Domestic ferret samples are labeled as “domestic_” and colored dark-blue, European polecats from mainland Europe are labeled as “euro_” and colored green, European polecats from England are labeled as “euro_eng_” and colored purple, European polecats from Wales are labeled as “euro_welsh_” and colored red, and samples identified (by phenotype) as ferret × polecat hybrids are labeled as “hybrid_” and colored purple (to reflect their English origin). Steppe polecats and Black-footed ferrets are labeled as “steppe_” and “bff_,” respectively, and colored black. The tree is rooted with Least Weasel and branch lengths are in expected substitutions per site.
Fig. 3.
Fig. 3.
ML phylogeny with 1,000 bootstrap replicates, for genome-wide SNPs of all 49 samples. Numbers at nodes refer to bootstrap support values of 95 and above. Taxa are labeled as in Fig. 2. The tree is rooted with Least Weasel and branch lengths are in expected substitutions per site.
Fig. 7.
Fig. 7.
TWISST analyses of domestic ferret and polecat populations along the 23 longest scaffolds, and scaffolds associated with putative adaptive introgression (A) shows the genome-wide average weighting of the 15 possible topologies with the 5 specified population. (B) shows the weighting of the 2 most frequent topologies, as well as the topology indicated by TreeMix analysis, across the scaffolds. The color blocks below the panels show which topology out of the 15 was the most frequent overall across each scaffold, using the colors shown in panel A (all are either T1 or T2). The y-axis gives the relative frequency at which a topology is inferred across the linkage groups (x-axis). (C) shows the 3 super-scaffolds putatively associated with adaptive introgression in more detail, with all 3 topologies from B plotted. The gray or black × axis bars correspond to the highlighted sections in B. The y-axis in C is the same as B. w, weasel; e, mainland European polecat (euro on panel B); d, domestic ferret (domestic on panel B); ee, English polecat (euro_eng on panel B); ew, Welsh polecat (euro_welsh on panel B).
Fig. 5.
Fig. 5.
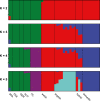
Admixture plots for values of K = 2 (top) to K = 5 (bottom). Statistical support gives K = 3 as the most significant number of populations. Samples of European polecat from the European mainland have been further broken down into their country of origin as follows. SPA = Spain, FRA = France, GER = Germany, AUT = Austria, and ITL = Italy.
Fig. 6.
Fig. 6.
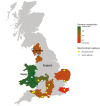
Distribution of polecat- and ferret-specific alleles across samples of European Polecats in Great Britain, along with mitochondrial genome haplotypes assigned in Fig. 2. Locations named on map refer to major areas mentioned in text.
Fig. 4.
Fig. 4.
TreeMix phylogeny showing the optimum number of migration edges (2). The tree is rooted by Least Weasel (“weasel”). Populations are labeled as in Fig. 2. Migration arrows are colored according to their weight. Horizontal branch lengths are proportional to the amount of genetic drift that has occurred along the branch.

References

    1. Aleo S, et al. Autism spectrum disorder and intellectual disability in an inherited 2q14.3 micro-deletion involving CNTNAP5. Am J Med Genet A. 2020;182(12):3071–3073. - PubMed
    1. Alves PC, et al. Evidence for genetic similarity of two allopatric European hares (Lepus corsicanus and L. castroviejoi) inferred from nuclear DNA sequences. Mol Phylogenet Evol. 2008;46(3):1191–1197. - PubMed
    1. Andrews, S. 2010. FastQC: a quality control tool for high throughput sequence data. Available online at: http://www.bioinformatics.babraham.ac.uk/projects/fastqc/
    1. Birks J. Polecats. Whittet Books,Stansted, United Kingdom; 2015.
    1. Birks J, Kitchener A. The distribution and status of the polecat Mustela putorius in Britain in the 1990s. Vol. 152. London: The Vincent Wildlife Trust; 1999.

Publication types