. 2022 Aug 5;138(4):1016-1027.
doi: 10.3171/2022.6.JNS212904. Print 2023 Apr 1.

Association of clinical outcomes and connectivity in awake versus asleep deep brain stimulation for Parkinson disease

Affiliations

Association of clinical outcomes and connectivity in awake versus asleep deep brain stimulation for Parkinson disease

Ron Gadot et al. J Neurosurg. .

Abstract

Objective: Deep brain stimulation (DBS) for Parkinson disease (PD) is traditionally performed with awake intraoperative testing and/or microelectrode recording. Recently, however, the procedure has been increasingly performed under general anesthesia with image-based verification. The authors sought to compare structural and functional networks engaged by awake and asleep PD-DBS of the subthalamic nucleus (STN) and correlate them with clinical outcomes.

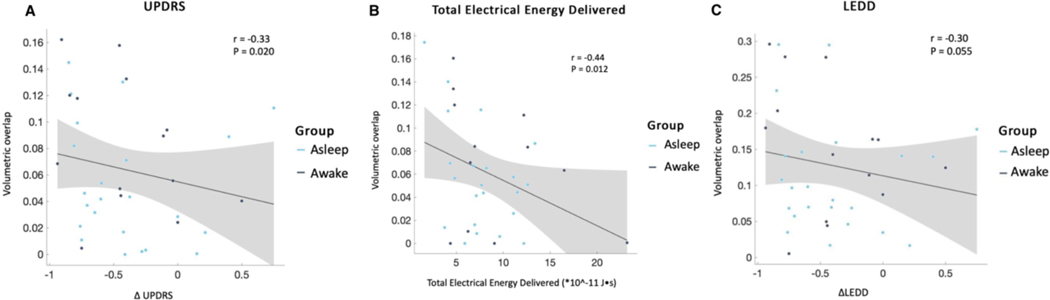
Methods: Levodopa equivalent daily dose (LEDD), pre- and postoperative motor scores on the Movement Disorders Society-Unified Parkinson's Disease Rating Scale part III (MDS-UPDRS III), and total electrical energy delivered (TEED) at 6 months were retroactively assessed in patients with PD who received implants of bilateral DBS leads. In subset analysis, implanted electrodes were reconstructed using the Lead-DBS toolbox. Volumes of tissue activated (VTAs) were used as seed points in group volumetric and connectivity analysis.

Results: The clinical courses of 122 patients (52 asleep, 70 awake) were reviewed. Operating room and procedure times were significantly shorter in asleep cases. LEDD reduction, MDS-UPDRS III score improvement, and TEED at the 6-month follow-up did not differ between groups. In subset analysis (n = 40), proximity of active contact, VTA overlap, and desired network fiber counts with motor STN correlated with lower DBS energy requirement and improved motor scores. Discriminative structural fiber tracts involving supplementary motor area, thalamus, and brainstem were associated with optimal clinical improvement. Areas of highest structural and functional connectivity with VTAs did not significantly differ between the two groups.

Conclusions: Compared to awake STN DBS, asleep procedures can achieve similarly optimal targeting-based on clinical outcomes, electrode placement, and connectivity estimates-in more efficient procedures and shorter operating room times.

Keywords: Parkinson disease; anesthesia; asleep DBS; connectivity; connectomics; deep brain stimulation; functional neurosurgery.


Conflict of interest statement

Conflict of Interest: Dr. Sheth is a consultant for Boston Scientific, Neuropace, Abbott and Zimmer Biomet. All other authors have no relevant disclosures.

Figures

Figure 1.
Figure 1.. Anterior view of reconstructed DBS leads
A.) DBS leads placed into bilateral STN (orange) can be visualized with bilateral red nuclei (red) for reference. B.) The centroids of active contacts from each DBS lead can be visualized in asleep (light blue) and awake (dark blue) cases with DISTAL minimal atlas with 7T 100 μm T1 MRI backdrop. C-F) Active contacts visualized on coronal and axial slices of MNI template brain for cross-patient comparisons. G-H) Sample patient bilateral STN lead reconstruction in patient native space with anatomical T2-weighted axial and coronal slice backdrop.
Figure 2.
Figure 2.. Relationship between active contact distance and clinical variables in all patients.
Lower active contact distance to motor STN was significantly associated with A) lower TEED requirement (R2 = 0.609, p = 0.009) and B) greater UPRDRSIII reduction (R2 = 0.459, p = 0.038) but not C) LEDD change (R2 = 0.226, p = 0.15) at 6-month follow-up.
Figure 3.
Figure 3.. Association between VTA to motor-STN overlap with clinical outcomes.
Normalized overlap was significantly associated with UPDRS (p = 0.020) and TEED change (p=0.012) but not LEDD change (p = 0.055) at 6 months. Two sample t-tests demonstrated no significant difference between awake and asleep cohorts in the associative relationships.
Figure 4.
Figure 4.. Association between VTA modulated number of fibers connecting with supplementary motor area (SMA) and superior frontal gyrus (SFG) and clinical outcomes.
Increased fiber-count with SMA was significantly correlated with A.) UPDRS reduction (p = 0.018) and B.) decreased TEED (p = 0.008) but not C.) LEDD reduction (p = 0.078). Increased fiber-count with SFG was significantly correlated with all three clinical outcomes (D-F). Two sample t-tests between awake and asleep cohorts demonstrated no significant differences in the associative relationships. Light blue = asleep performed; dark blue = awake performed.
Figure 5.
Figure 5.. DBS Fiber Filtering analysis and connectivity comparisons.
A.) All fibers engaged by VTAs of all included patients. On right, only top 20% of fibers that predict the lowest TEED requirement co-variated with LEDD and UPDRS reduction (more negative LEDD and UPDRS change) at 6 months are seen. Fibers in white to red scale represent t-values for positive association between selected fibers and lower TEED requirement. B.) Fibers with strongest discriminative value project from the VTAs in the subthalamic nucleus to supplementary motor area and superior frontal gyrus as well as thalamic nuclei and brainstem. C.) Average structural connectivity profiles of asleep (n = 25) and awake (n = 15) cohorts. High structural connectivity is found between VTAs and SMA, SFG, thalamus, corpus callosum, and brainstem. T-score matrices within these ROIs were averaged within asleep and awake patient groups and compared between cohorts using two-tailed ANOVAs; no significant differences in clustering analysis were found. D.) Average functional connectivity profiles of asleep (n = 25) and awake (n = 15) cohorts. High functional connectivity is found between VTAs and thalamus, medial temporal cortex, anterior cingulate cortex, brainstem, and cerebellum. Fisher z-transformed t-scores within these ROIs were averaged within asleep and awake patient groups and compared between cohorts using two-tailed ANOVAs; no significant differences in clustering analysis were found.

References

    1. Mahajan UV, Ravikumar VK, Kumar KK, et al. Bilateral Deep Brain Stimulation is the Procedure to Beat for Advanced Parkinson Disease: A Meta-Analytic, Cost-Effective Threshold Analysis for Focused Ultrasound. Neurosurgery. 2021;88(3):487–496. - PMC - PubMed
    1. Chen T, Mirzadeh Z, Chapple KM, et al. Clinical outcomes following awake and asleep deep brain stimulation for Parkinson disease. J Neurosurg. 2018;130(1):109–120. - PubMed
    1. Mirzadeh Z, Chapple K, Lambert M, et al. Parkinson’s disease outcomes after intraoperative CT-guided “asleep” deep brain stimulation in the globus pallidus internus. J Neurosurg. 2016;124(4):902–907. - PubMed
    1. Park HR, Lim YH, Song EJ, et al. Bilateral Subthalamic Nucleus Deep Brain Stimulation under General Anesthesia: Literature Review and Single Center Experience. J Clin Med. 2020;9(9). - PMC - PubMed
    1. Moran CH, Pietrzyk M, Sarangmat N, et al. Clinical Outcome of “Asleep” Deep Brain Stimulation for Parkinson Disease Using Robot-Assisted Delivery and Anatomic Targeting of the Subthalamic Nucleus: A Series of 152 Patients. Neurosurgery. 2020;88(1):165–173. - PubMed