

Mapping local variation in household overcrowding across Africa from 2000 to 2018: a modelling study
- PMID: 35932787
- PMCID: PMC9364142
- DOI: 10.1016/S2542-5196(22)00149-8
Mapping local variation in household overcrowding across Africa from 2000 to 2018: a modelling study
Abstract
Background: Household overcrowding is a serious public health threat associated with high morbidity and mortality. Rapid population growth and urbanisation contribute to overcrowding and poor sanitation in low-income and middle- income countries, and are risk factors for the spread of infectious diseases, including COVID-19, and antimicrobial resistance. Many countries do not have adequate surveillance capacity to monitor household overcrowding. Geostatistical models are therefore useful tools for estimating household overcrowding. In this study, we aimed to estimate household overcrowding in Africa between 2000 and 2018 by combining available household survey data, population censuses, and other country-specific household surveys within a geostatistical framework.
Methods: We used data from household surveys and population censuses to generate a Bayesian geostatistical model of household overcrowding in Africa for the 19-year period between 2000 and 2018. Additional sociodemographic and health-related covariates informed the model, which covered 54 African countries.
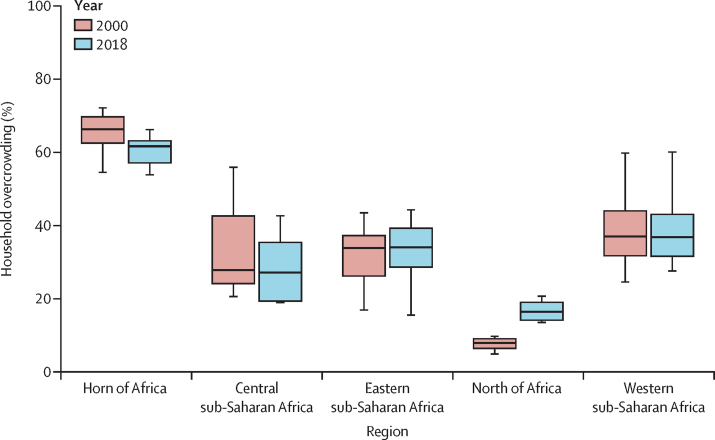
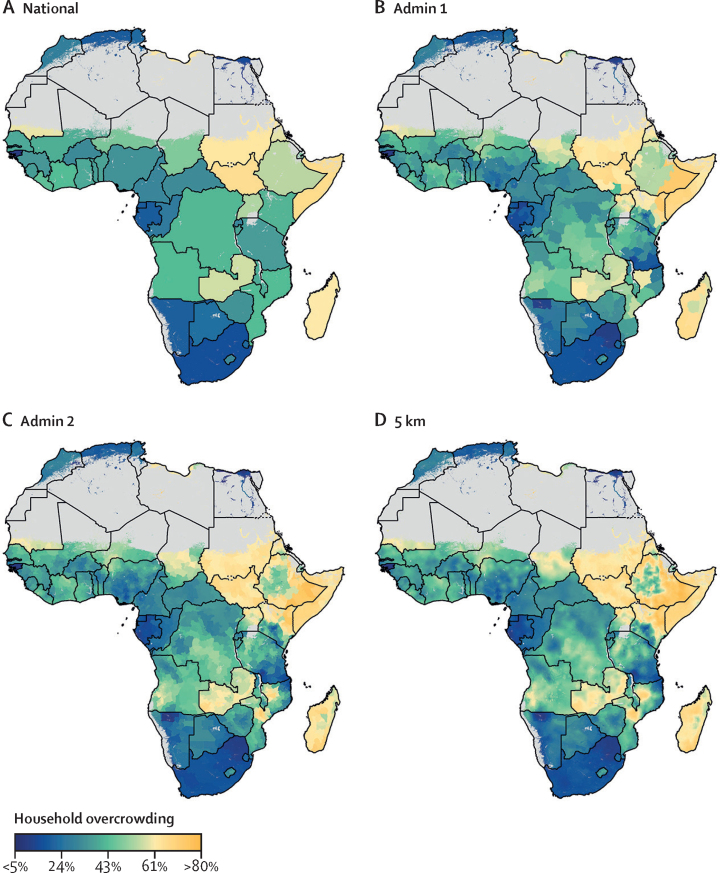
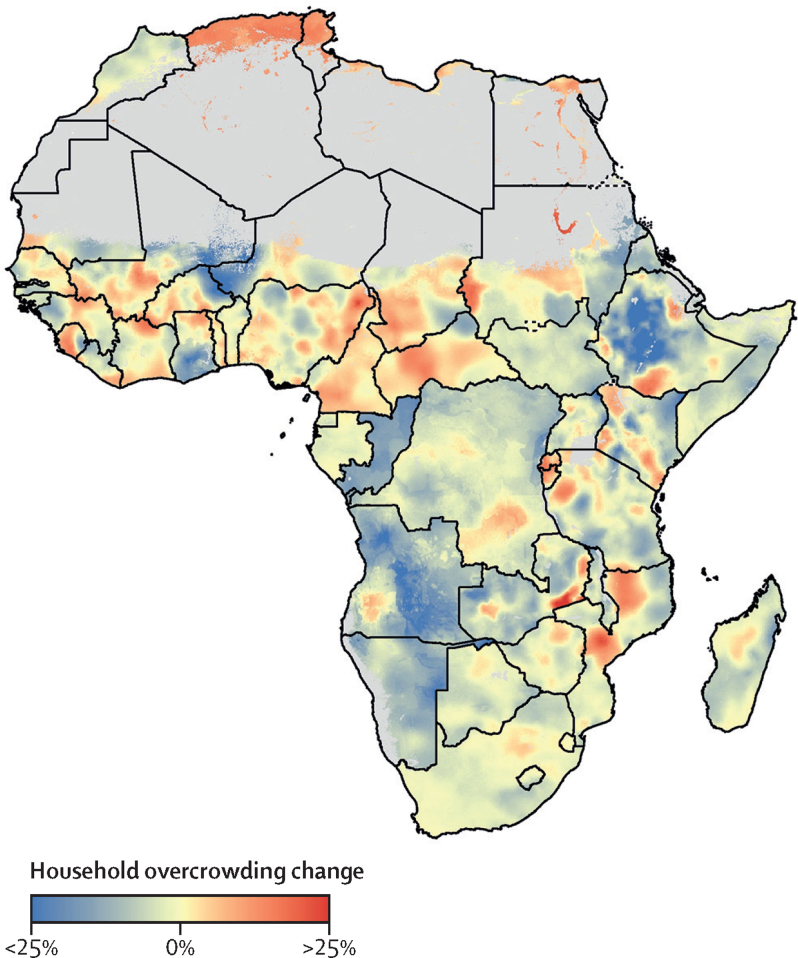
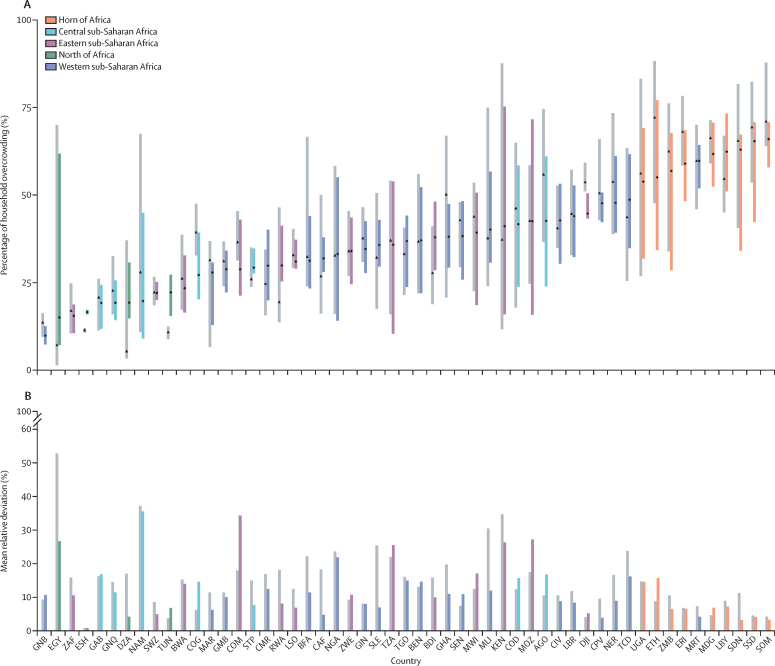
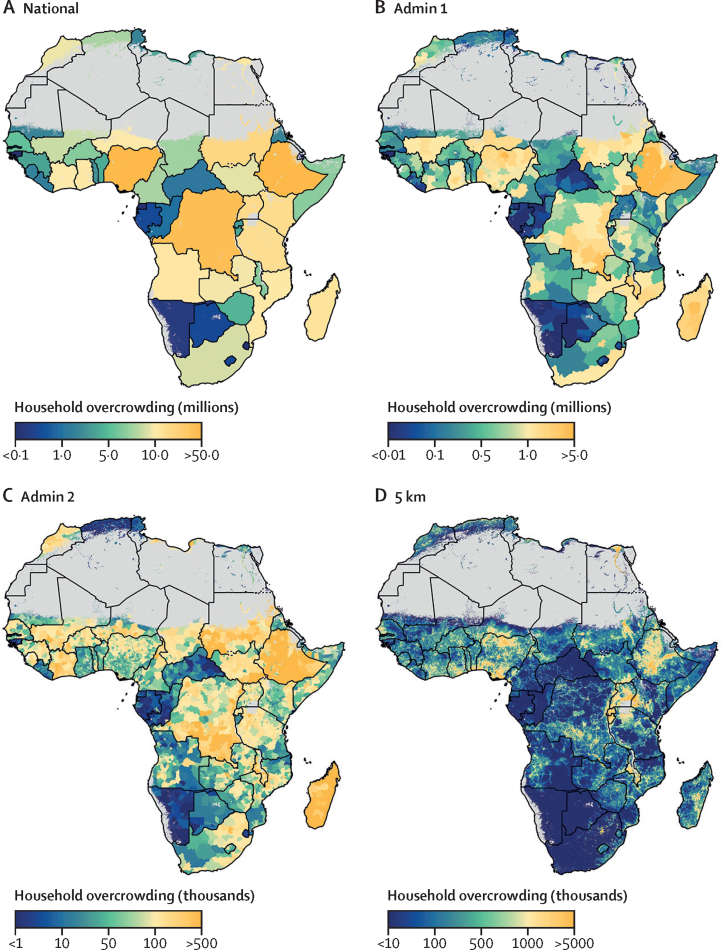
Findings: We analysed 287 surveys and population censuses, covering 78 695 991 households. Spatial and temporal variability arose in household overcrowding estimates over time. In 2018, the highest overcrowding estimates were observed in the Horn of Africa region (median proportion 62% [IQR 57-63]); the lowest regional median proportion was estimated for the north of Africa region (16% [14-19]). Overall, 474·4 million (95% uncertainty interval [UI] 250·1 million-740·7 million) people were estimated to be living in overcrowded conditions in Africa in 2018, a 62·7% increase from the estimated 291·5 million (180·8 million-417·3 million) people who lived in overcrowded conditions in the year 2000. 48·5% (229·9 million) of people living in overcrowded conditions came from six African countries (Nigeria, Ethiopia, Democratic Republic of the Congo, Sudan, Uganda, and Kenya), with a combined population of 538·3 million people.
Interpretation: This study incorporated survey and population censuses data and used geostatistical modelling to estimate continent-wide overcrowding over a 19-year period. Our analysis identified countries and areas with high numbers of people living in overcrowded conditions, thereby providing a benchmark for policy planning and the implementation of interventions such as in infectious disease control.
Funding: UK Department of Health and Social Care, Wellcome Trust, Bill & Melinda Gates Foundation.
Copyright © 2022 The Author(s). Published by Elsevier Ltd. This is an Open Access article under the CC BY 4.0 license. Published by Elsevier Ltd.. All rights reserved.
Conflict of interest statement
Declaration of interests All authors declare no competing interests.
Figures
References
-
- UN Progress towards the Sustainable Development Goals. Report of the Secretary-General. 2016. https://digitallibrary.un.org/record/833184
-
- UN The United Nations Conference on Housing and Sustainable Urban Development Habitat III. 2016. https://www.un.org/en/conferences/habitat/quito2016
-
- WHO WHO Housing and Health Guidelines. 2018. https://www.who.int/publications/i/item/9789241550376 - PubMed
-
- Rader B, Scarpino SV, Nande A, et al. Crowding and the shape of COVID-19 epidemics. Nat Med. 2020;26:1829–1834. - PubMed
Publication types
MeSH terms
Grants and funding
LinkOut - more resources
Full Text Sources
Medical
