. 2022 Sep;298(9):102305.
doi: 10.1016/j.jbc.2022.102305. Epub 2022 Aug 4.

Oxygen-dependent regulation of E3(SCF)ubiquitin ligases and a Skp1-associated JmjD6 homolog in development of the social amoeba Dictyostelium

Affiliations

Oxygen-dependent regulation of E3(SCF)ubiquitin ligases and a Skp1-associated JmjD6 homolog in development of the social amoeba Dictyostelium

Andrew W Boland et al. J Biol Chem. 2022 Sep.

Abstract

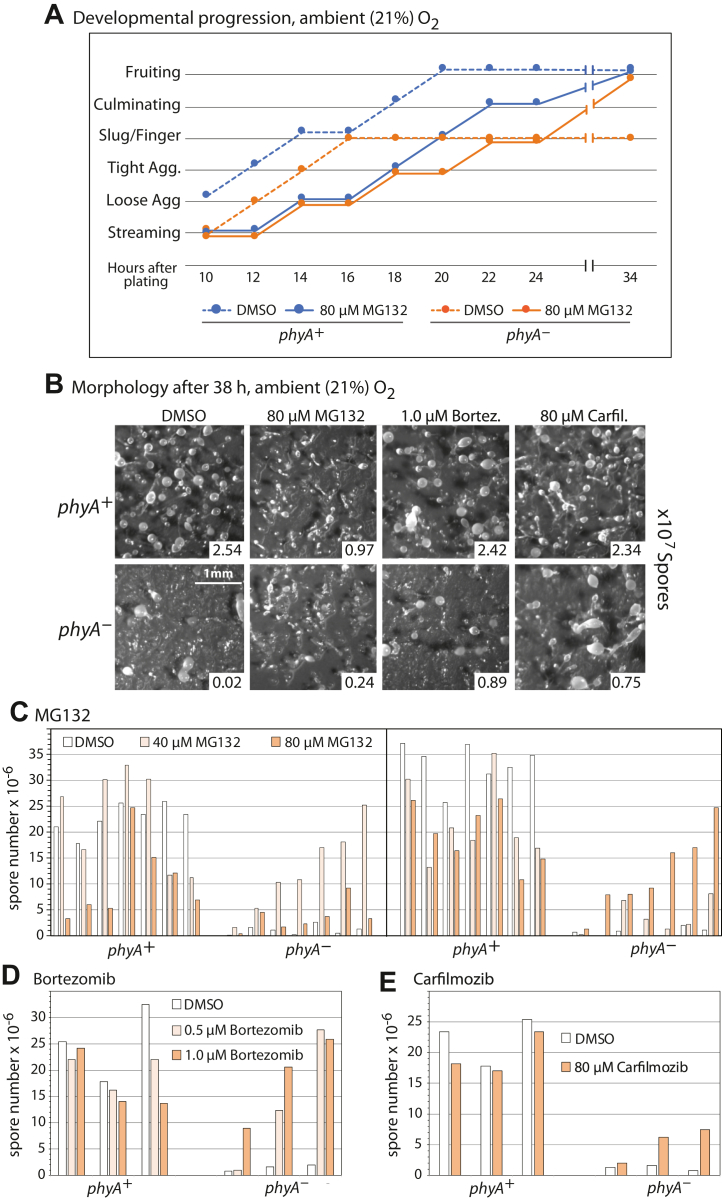
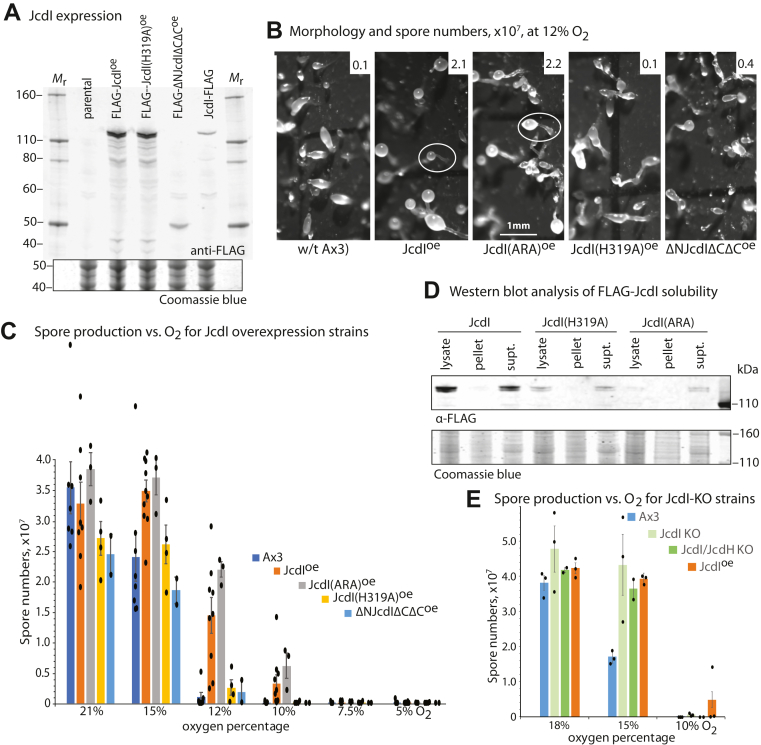
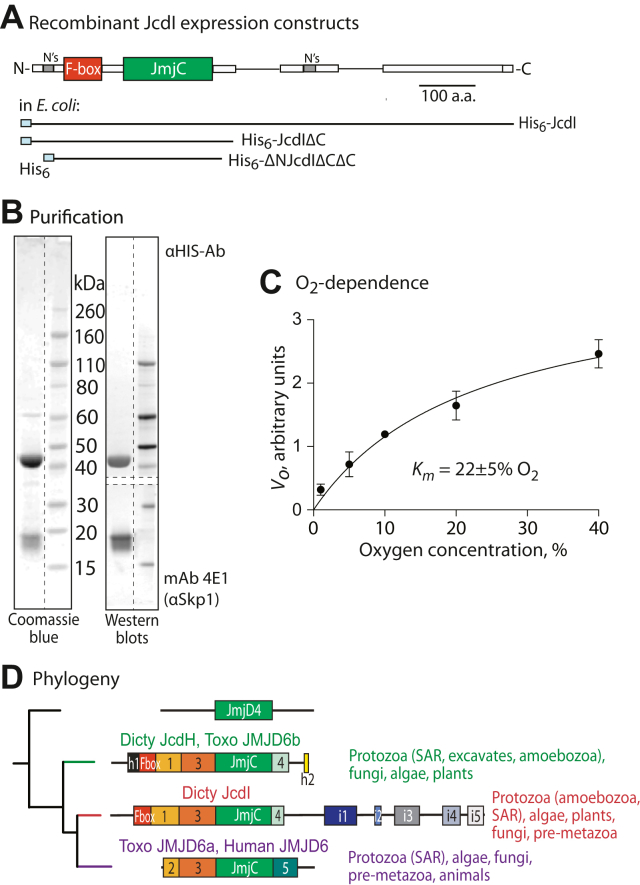
E3-SCF (Skp1/cullin-1/F-box protein) polyubiquitin ligases activate the proteasomal degradation of over a thousand proteins, but the evolutionary diversification of the F-box protein (FBP) family of substrate receptor subunits has challenged their elucidation in protists. Here, we expand the FBP candidate list in the social amoeba Dictyostelium and show that the Skp1 interactome is highly remodeled as cells transition from growth to multicellular development. Importantly, a subset of candidate FBPs was less represented when the posttranslational hydroxylation and glycosylation of Skp1 was abrogated by deletion of the O2-sensing Skp1 prolyl hydroxylase PhyA. A role for this Skp1 modification for SCF activity was indicated by partial rescue of development, which normally depends on high O2 and PhyA, of phyA-KO cells by proteasomal inhibitors. Further examination of two FBPs, FbxwD and the Jumonji C protein JcdI, suggested that Skp1 was substituted by other factors in phyA-KO cells. Although a double-KO of jcdI and its paralog jcdH did not affect development, overexpression of JcdI increased its sensitivity to O2. JcdI, a nonheme dioxygenase shown to have physiological O2 dependence, is conserved across protists with its F-box and other domains, and is related to the human oncogene JmjD6. Sensitization of JcdI-overexpression cells to O2 depended on its dioxygenase activity and other domains, but not its F-box, which may however be the mediator of its reduced levels in WT relative to Skp1 modification mutant cells. The findings suggest that activation of JcdI by O2 is tempered by homeostatic downregulation via PhyA and association with Skp1.

Keywords: E3(SCF)ubiquitin-ligase; F-box protein; Jumonji C; Skp1; cellular slime mold; glycosylation; oxygen; prolyl hydroxylase.


Conflict of interest statement

Conflict of interest The authors declare that they have no conflicts of interest with the contents of this article.

Figures

Figure 1
Figure 1
The SCF complex and Dictyostelium development.A, schematic illustration of a generic SCF complex including modes of regulation based on studies in yeast, mammalian cells, and plant cells (1, 2, 50, 81, 82). The novel regulation explored here involves the posttranslational prolyl hydroxylation and glycosylation of Skp1 in protists, including Dictyostelium. B, schematic illustration of the starvation-induced developmental cycle of Dictyostelium discoideum. Prestalk cells and anterior-like cells are labeled blue (83). The life cycle is renewed when spores from a fruiting body germinate to become feeding amoebae.
Figure 2
Figure 2
Effects of proteasome inhibitors on developmental progression. Amoebae (phyA+ or phyA) were spread on filters in the presence or absence of the indicated concentrations of inhibitors or an equivalent volume of the carrier solvent (DMSO) and allowed to develop. A, morphology, observed at 2 h intervals starting at 10 h, was graphed as a function of time. B, representative images of morphologies after 38 h in the presence of the indicated concentrations of inhibitors. The spherical structures represent the spore-containing sori of fruiting bodies. Spore counts from the represented trials are shown in the inset. C–E, quantitation of spore numbers from all trials. Results from all independent trials are shown and graphed in increasing order of spore numbers produced by inhibitor-treated phyA cells. phyA+ cells from same trials are at the left in matching order. C, trials using 80 μM carfilzomib. D, trials using 40 μM and 80 μM MG132. E, trials using 0.5 μM and 1.0 μM bortezomib. Trials where maximal spore formation occurred at 40 μM or 80 μM MG132 are in separate panels. DMSO, dimethyl sulfoxide.
Figure 3
Figure 3
Effects of proteasome inhibitors on protein polyubiquitination. Cells were treated with the indicated concentrations of proteasome inhibitors and analyzed by whole cell Western blotting using anti-K48-polyubiquitin (polyUb). Densitometry was performed on the indicated regions and normalized to the Coomassie blue stain intensity of the gel after electrotransfer. A, comparison of phyA+ and phyA vegetative cells (left). All data points are shown, and the quantitation shows the average ±SD of three independent trials. Response of phyA+ vegetative cells to treatment with the indicated concentrations of MG132 after 2 h (right). B, comparison of effects of 80 μM MG132 on cells shaken in starvation buffer over 10 h. For statistical analysis, time points ≥1 h were averaged. C, similar analysis of cells starved at an air–water interface, which allows development to the tight aggregate stage (10 h) or slugs (14–16 h, based on morphology). Paired t tests were used to determine the significance of differences between pooled data from treated and untreated samples. D, comparison of the effects of three proteasome inhibitors, after incubation up to the slug stage of development.
Figure 4
Figure 4
Dependence of the Skp1 interactome on cell differentiation and Skp1 modification. The Skp1 interactome was assessed by co-IP with anti-myc (mAb 9E10) from cells expressing Skp1-myc or with anti-Skp1 (affinity-purified pAb UOK77) from strains lacking a tagged Skp1, and captured proteins were detected and quantified by label-free proteomic analysis. Proteins that were enriched relative to a statistically significant extent over control co-IPs (untagged Skp1 for mAb 9E10 and nonspecific IgG for pAb UOK77), as summarized in Table S2, Figs. S1, and S2, are classified according to life cycle stage, the detection method, properties, and dependence on PhyA. A–G, Venn diagrams illustrate the overlap of results between the two life cycle stages (panel A), overlaps between the two antibodies (panel B for vegetative stage cells; E for slugs), fraction of interactors possessing predicted F-box and substrate receptor domains (panel C for vegetative cells; F for slugs), and fraction of the interactors shown in panels C and F that are enriched in phyA+versus phyA cells (panel D for vegetative stage; G for slug). H, Skp1-myc interaction candidates in vegetative cells were plotted according to fold-enrichment in phyA+versus phyA cells and statistical significance. Red data points represent interactors that were found at 1.5-fold higher levels at t test and Wilcoxon test p-values ≤ 0.05. Open red circles represent candidates determined to be phyA+ enhanced by pairwise comparison criteria (Table S2). I, same for results from anti-Skp1 and vegetative cells. J, same as panel (H), using slug cells. K, same as panel (I), using slug cells. co-IP, coimmunoprecipitation.
Figure 5
Figure 5
Interactions of FbxwD with Skp1. The fbxwD locus was modified in phyA+ and phyA cells to append a C-terminal FLAG tag to the protein. A, FbxwD and Skp1 abundance were analyzed by Western blot analysis of whole cells solubilized in SDS using anti-FLAG for FbxwD-FLAG and pAb UOK77 for Skp1. Levels were quantitated by densitometry and normalized to Coomassie blue staining of the blotted gel. Note the more rapid gel migration of Skp1 from phyA cells owing to absence of glycosylation. The average ratio of three independent trials ± SD are graphed. FbxwD-FLAG was IPed with mAb M2 under conditions where >90% of FbxwD-FLAG was captured and analyzed similarly by Western blotting. The average ratio of co-IPed Skp1 relative to FbxwD-FLAG is graphed from three independent trials ± SD. B, similar analysis of FbxwD-FLAG and Skp1 from slug cells.
Figure 6
Figure 6
Effect of Skp1 glycosylation on endogenous levels of JcdI and its interaction with Skp1.A, schematic diagrams illustrating ectopic expression of full-length FLAG-JcdI (FLAG-Fbxo13) and truncated and mutated derivatives, and tagging of the endogenous gene with a C-terminal FLAG tag (JcdI-FLAG). B, point mutations in the predicted F-box domain, based on mutations used for yeast Ctf13. C, strains ectopically expressing FLAG-JcdI and FLAG-JcdI(ARA) were subjected to co-IP with mAb M2 (for FLAG-JcdI) or pAb UOK77 (for Skp1) and analyzed by Western blotting and probing with the respective Abs. D–F, endogenous JcdI-FLAG was compared between gnt1+ and gnt1 vegetative cells. D, the total level of JcdI-FLAG relative to actin in NP40-solubilized whole cells (panel D) was determined on two independent clones from three biological replicates (each represented by a triangle) using an unpaired t test. E, the interaction of JcdI-FLAG with Skp1 was assessed in reciprocal co-IPs. F, ratios were quantified by densitometry and the average ± SD for the indicated number of independent trials (represented by separate symbols). G–I, similar analyses of slug stage cells. Tooled vertical lines mark where irrelevant lanes were deleted from the same Western blot or gel. co-IP, coimmunoprecipitation.
Figure 8
Figure 8
JcdI overexpression reduces O2threshold for development.Dictyostelium was transformed with plasmids directing the overexpression of normal or mutant FLAG-JcdI isoforms under control of the constitutive discoidin-1γ promoter. A, clones were screened for expression level in vegetative cells, as assessed by Western blotting of whole cell extracts probed with anti-FLAG (mAb M2). Cells were induced to develop by spreading at high density on moist filters in starvation buffer as in Figure 2B and maintained under controlled flow of different O2 levels. B, representative terminal morphologies at 12% O2. Typical fruiting bodies are encircled in white. C, mean spore counts from three independent trials of FLAG-JcdI overexpression development, which included data from three independent FLAG-JcdI overexpression strains, after 36 h, ± SEM. D, Western blot analysis of the distribution of FLAG-JcdI isoforms between particulate and cytosolic fractions after gentle filter lysis of vegetative stage cells in the absence of detergent and centrifugation at 200,000g for 30 min. E, mean spore counts from three independent trials of jcdI and jcdI/jcdH cells after 36 h, ± SEM.
Figure 7
Figure 7
JcdI/Fbxo13 is an O2-dependent nonheme dioxygenase.A, domain analysis of the predicted JcdI protein and summary of expression constructs in E. coli. B, SDS-PAGE and Western blot analysis of the purified ΔNJcdIΔCΔC/Skp1 complex expressed in E. coli. Vertical dashed lines refer to irrelevant lanes removed from the same gel, and horizontal dashed lines indicate the division of the same blot for probing with different Abs. C, nonheme dioxygenase activity was measured based on the conversion of αKG to succinate, as is typical of this enzyme class even in the absence of an acceptor substrate, in the presence of various levels of O2. Succinate was detected using a commercial luminescence-based succinate-Glo assay. Initial velocities (Vo) were calculated from three technical replicates of a single trial that was replicated with similar results in an independent trial. D, a summary of the evolution of JcdI-like sequences, based on the relatedness of their JmjC domains using a maximum likelihood method. Members of each group have characteristic distinct sequence homology segments that are represented as shaded boxes. Phylogenetic distributions are summarized to the right. SAR, a group including stramenopiles, alveolates, and rhizaria; Dicty, Dictyostelium (an amoebozoan); Toxo, Toxoplasma (an alveolate). The full tree of 71 sequences is shown in Fig. S8.

Similar articles

Cited by

References

    1. Willems A.R., Schwab M., Tyers M. A hitchhiker's guide to the cullin ubiquitin ligases: SCF and its kin. Biochim. Biophys. Acta - Mol. Cell Res. 2004;1695:133–170. - PubMed
    1. Harper J.W., Schulman B.A. Cullin-RING ubiquitin ligase regulatory circuits: a quarter century beyond the F-box hypothesis. Annu. Rev. Biochem. 2021;90:403–429. - PMC - PubMed
    1. Skaar J.R., Pagan J.K., Pagano M. Mechanisms and function of substrate recruitment by F-box proteins. Nat. Rev. Mol. Cell Biol. 2013;14:369–381. - PMC - PubMed
    1. Schulman B.A., Carrano A.C., Jeffrey P.D., Bowen Z., Kinnucan E.R., Finnin M.S., et al. Insights into SCF ubiquitin ligases from the structure of the Skp1-Skp2 complex. Nature. 2000;408:381–386. - PubMed
    1. de Bie P., Ciechanover A. Ubiquitination of E3 ligases: self-regulation of the ubiquitin system via proteolytic and non-proteolytic mechanisms. Cell Death Differ. 2011;18:1393–1402. - PMC - PubMed

Publication types

MeSH terms

Substances