

Cinnabarinic Acid Provides Hepatoprotection Against Nonalcoholic Fatty Liver Disease
- PMID: 35933113
- PMCID: PMC9513857
- DOI: 10.1124/jpet.122.001301
Cinnabarinic Acid Provides Hepatoprotection Against Nonalcoholic Fatty Liver Disease
Abstract
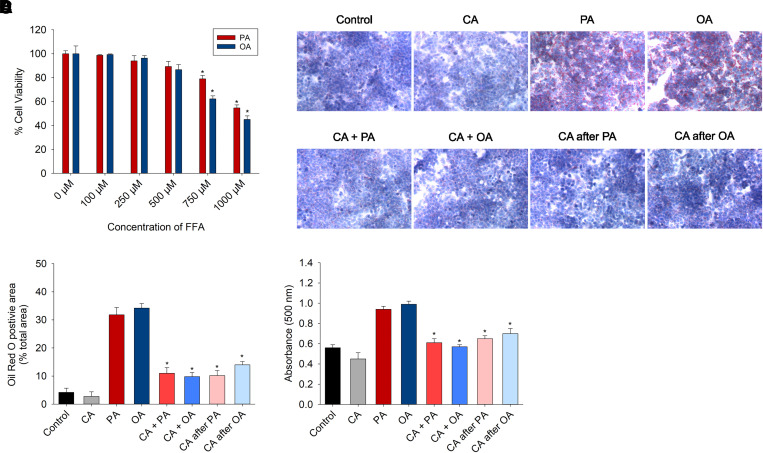
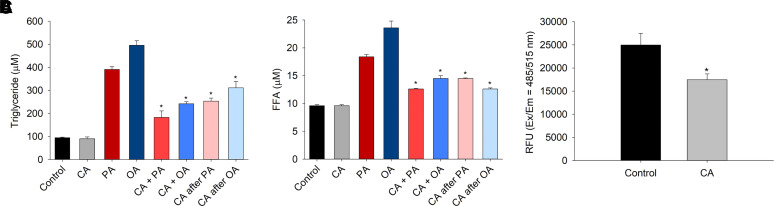
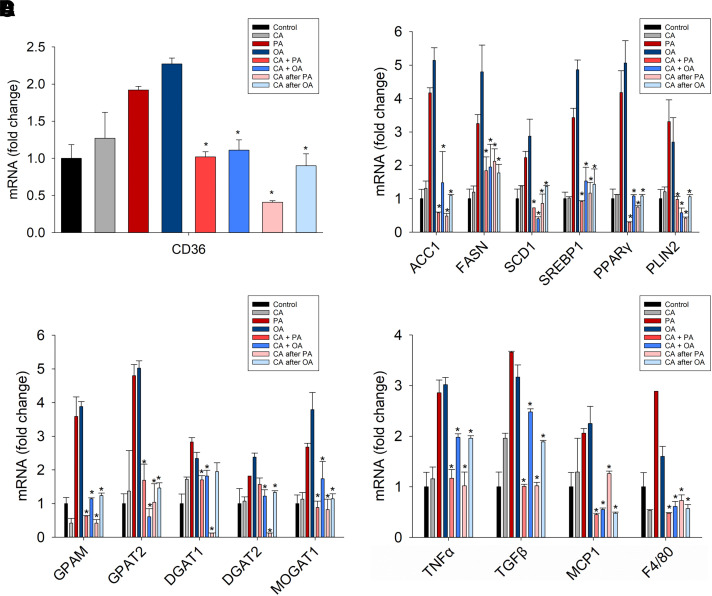
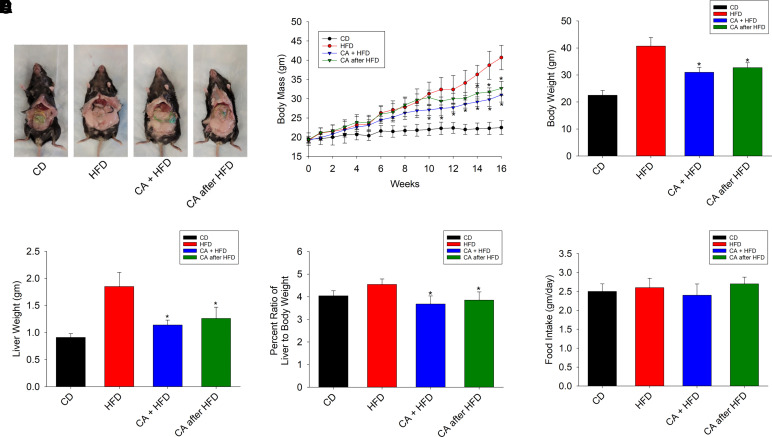
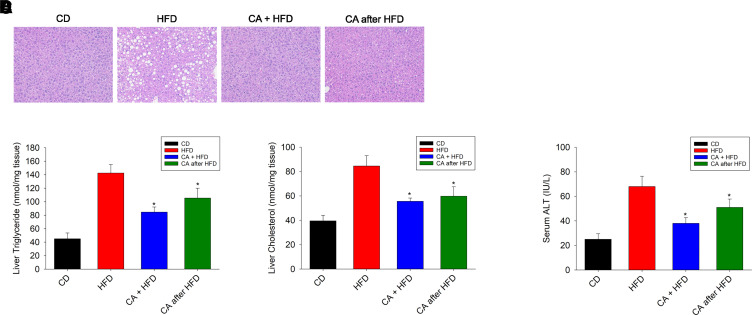
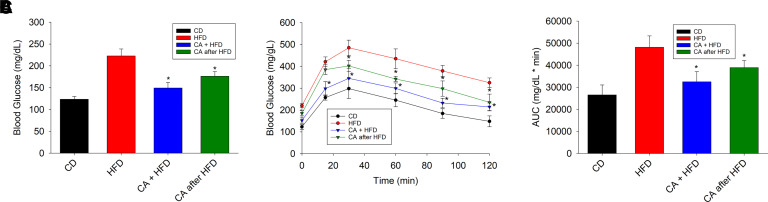
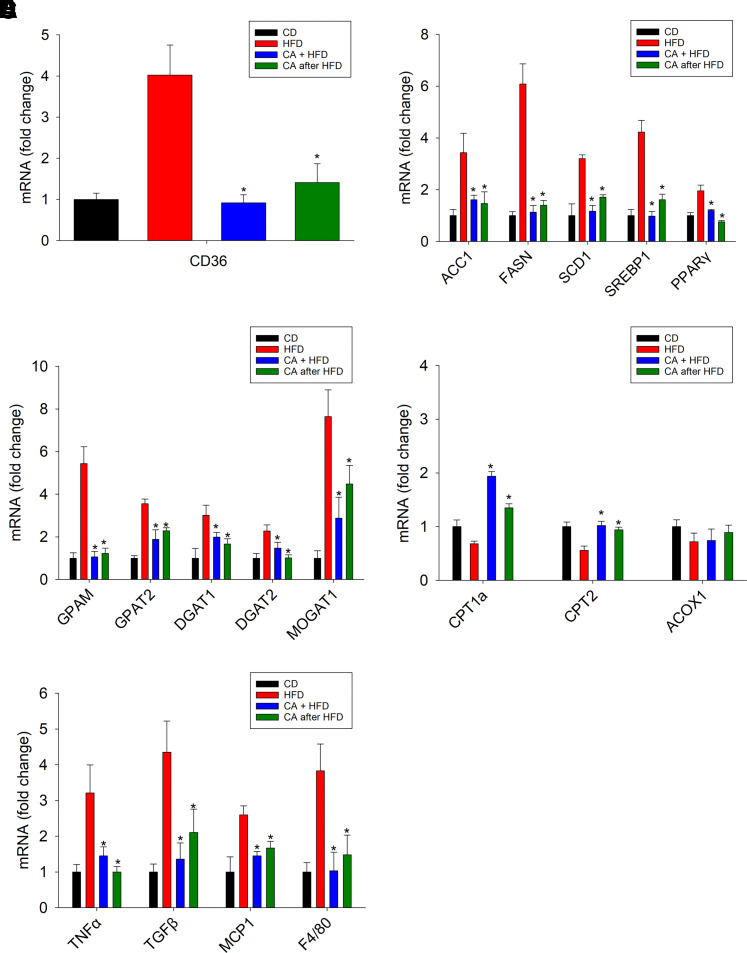
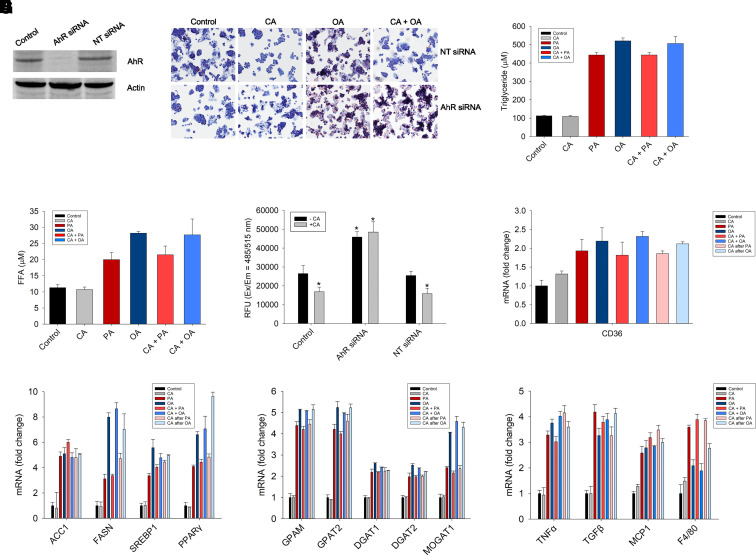
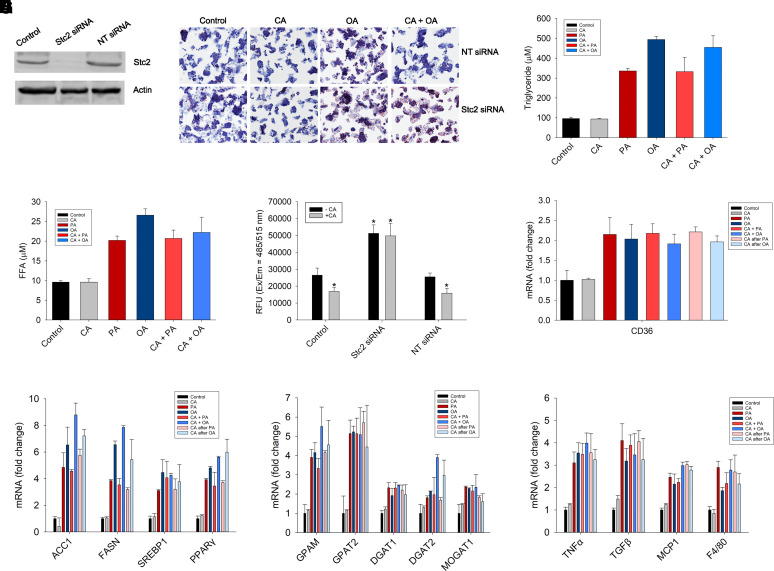
Nonalcoholic fatty liver disease (NAFLD) is a chronic condition in which excess lipids accumulate in the liver and can lead to a range of progressive liver disorders including non-alcoholic steatohepatitis, liver cirrhosis, and hepatocellular carcinoma. While lifestyle and diet modifications have proven to be effective as NAFLD treatments, they are not sustainable in the long-term, and currently no pharmacological therapies are approved to treat NAFLD. Our previous studies demonstrated that cinnabarinic acid (CA), a novel endogenous Aryl hydrocarbon Receptor (AhR) agonist, activates the AhR target gene, Stanniocalcin 2, and confers cytoprotection against a plethora of ER/oxidative stressors. In this study, the hepatoprotective and anti-steatotic properties of CA were examined against free fatty-acid-induced in vitro and high-fat-diet fed in vivo NAFLD models. The results demonstrated that CA treatment significantly lowered weight gain and attenuated hepatic lipotoxicity both before and after the established fatty liver, thereby protecting against steatosis, inflammation, and liver injury. CA mitigated intracellular free fatty acid uptake concomitant with the downregulation of CD36/fatty acid translocase. Genes involved in fatty acid and triglyceride synthesis were also downregulated in response to CA treatment. Additionally, suppressing AhR and Stc2 expression using RNA interference in vitro verified that the hepatoprotective effects of CA were absolutely dependent on both AhR and its target, Stc2. Collectively, our results demonstrate that the endogenous AhR agonist, CA, confers hepatoprotection against NAFLD by regulating hepatic fatty acid uptake and lipogenesis. SIGNIFICANCE STATEMENT: In this study using in vitro and in vivo models, we demonstrate that cinnabarinic acid (CA), an endogenous AhR agonist, provides protection against non-alcoholic fatty liver disease. CA bestows cytoprotection against steatosis and liver injury by controlling expression of several key genes associated with lipid metabolism pathways, limiting the hepatic lipid uptake, and controlling liver inflammation. Moreover, CA-induced hepatoprotection is absolutely dependent on AhR and Stc2 expression.
Copyright © 2022 by The American Society for Pharmacology and Experimental Therapeutics.
Figures
Similar articles
-
Cinnabarinic acid protects against metabolic dysfunction-associated steatohepatitis by activating aryl hydrocarbon receptor-dependent AMPK signaling.Am J Physiol Gastrointest Liver Physiol. 2025 Apr 1;328(4):G433-G447. doi: 10.1152/ajpgi.00337.2024. Epub 2025 Mar 10. Am J Physiol Gastrointest Liver Physiol. 2025. PMID: 40062565 Free PMC article.
-
Cinnabarinic Acid-Induced Stanniocalcin 2 Confers Cytoprotection against Alcohol-Induced Liver Injury.J Pharmacol Exp Ther. 2022 Apr;381(1):1-11. doi: 10.1124/jpet.121.000999. Epub 2022 Jan 25. J Pharmacol Exp Ther. 2022. PMID: 35078862 Free PMC article.
-
Aryl hydrocarbon receptor-dependent stanniocalcin 2 induction by cinnabarinic acid provides cytoprotection against endoplasmic reticulum and oxidative stress.J Pharmacol Exp Ther. 2015 Apr;353(1):201-12. doi: 10.1124/jpet.114.222265. Epub 2015 Feb 11. J Pharmacol Exp Ther. 2015. PMID: 25672339 Free PMC article.
-
Decoding Cinnabarinic Acid-Specific Stanniocalcin 2 Induction by Aryl Hydrocarbon Receptor.Mol Pharmacol. 2022 Jan;101(1):45-55. doi: 10.1124/molpharm.121.000376. Epub 2021 Nov 11. Mol Pharmacol. 2022. PMID: 34764210 Free PMC article.
-
Fatty Acids and Effects on In Vitro and In Vivo Models of Liver Steatosis.Curr Med Chem. 2019;26(19):3439-3456. doi: 10.2174/0929867324666170518101334. Curr Med Chem. 2019. PMID: 28521680 Review.
Cited by
-
Skeletal muscles and gut microbiota-derived metabolites: novel modulators of adipocyte thermogenesis.Front Endocrinol (Lausanne). 2023 Oct 6;14:1265175. doi: 10.3389/fendo.2023.1265175. eCollection 2023. Front Endocrinol (Lausanne). 2023. PMID: 37867516 Free PMC article. Review.
-
A Review on the Role and Function of Cinnabarinic Acid, a "Forgotten" Metabolite of the Kynurenine Pathway.Cells. 2024 Mar 5;13(5):453. doi: 10.3390/cells13050453. Cells. 2024. PMID: 38474418 Free PMC article. Review.
-
The Ah Receptor from Toxicity to Therapeutics: Report from the 5th AHR Meeting at Penn State University, USA, June 2022.Int J Mol Sci. 2023 Mar 14;24(6):5550. doi: 10.3390/ijms24065550. Int J Mol Sci. 2023. PMID: 36982624 Free PMC article.
-
AhR governs lipid metabolism: the role of gut microbiota.Front Microbiol. 2025 Jan 29;16:1442282. doi: 10.3389/fmicb.2025.1442282. eCollection 2025. Front Microbiol. 2025. PMID: 39944639 Free PMC article. Review.
-
Role of Hepatic Aryl Hydrocarbon Receptor in Non-Alcoholic Fatty Liver Disease.Receptors (Basel). 2023 Mar;2(1):1-15. doi: 10.3390/receptors2010001. Epub 2023 Jan 4. Receptors (Basel). 2023. PMID: 37284280 Free PMC article.
References
-
- Angulo P (2002) Nonalcoholic fatty liver disease. N Engl J Med 346:1221–1231. - PubMed
-
- Bugianesi E, Leone N, Vanni E, Marchesini G, Brunello F, Carucci P, Musso A, De Paolis P, Capussotti L, Salizzoni M, et al. (2002) Expanding the natural history of nonalcoholic steatohepatitis: from cryptogenic cirrhosis to hepatocellular carcinoma. Gastroenterology 123:134–140. - PubMed
Publication types
MeSH terms
Substances
Grants and funding
LinkOut - more resources
Full Text Sources
Medical
