. 2022 Aug 6;20(1):352.
doi: 10.1186/s12967-022-03546-w.

Harm of circadian misalignment to the hearts of the adolescent wistar rats

Affiliations

Harm of circadian misalignment to the hearts of the adolescent wistar rats

YunLei Wang et al. J Transl Med. .

Abstract

Purpose: The purpose of this study was to observe the harm of circadian misalignment (CM), caused by an inverted photoperiod (IP), on the hearts of the adolescent Wistar rats, and to explore the mechanisms leading to harm.

Methods: An IP was used to create a CM model. A total of 174 Wistar rats were randomly divided into circadian alignment (CA) and CM groups (87 rats per group). The different activity rhythms of the two groups of rats were adjusted through different light/dark cycles for 90 days. We recorded the rhythmic activity trajectory and sleep time of the rats. After 90 days of modeling, we performed various analyses (i.e., blood pressure, weight, cardiac ultrasound tests, serological tests, cardiac tissue immunofluorescence, immunohistochemistry, transmission electron microscopy on myocardial mitochondria, western blotting, and quantitative polymerase chain reactions).

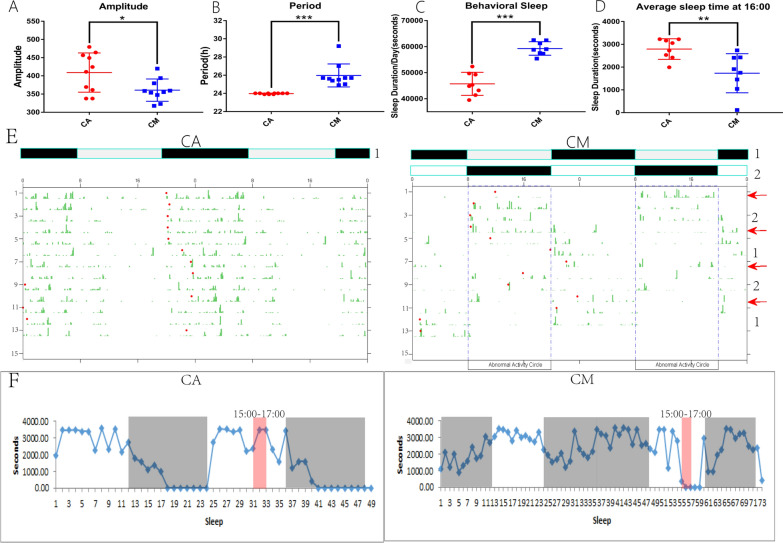
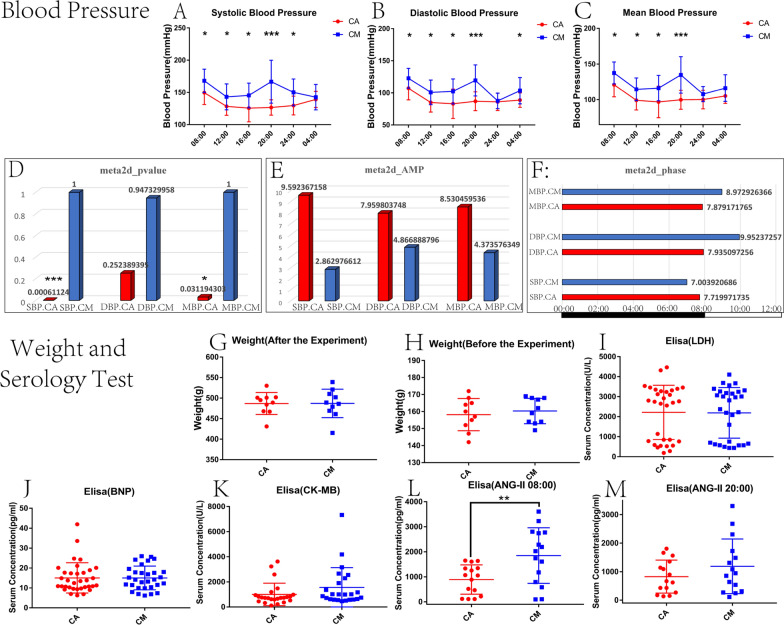
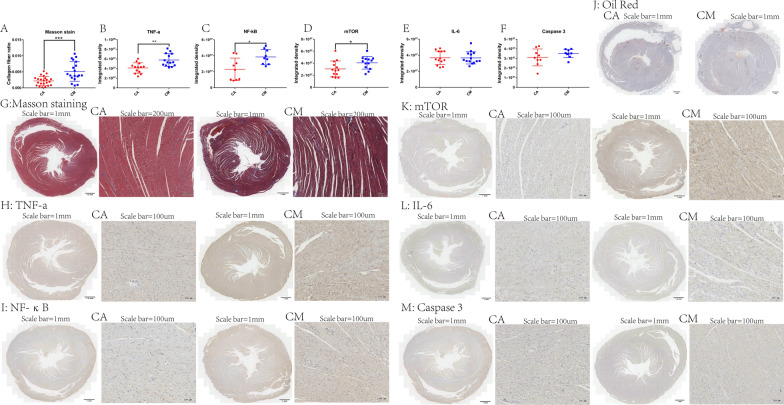
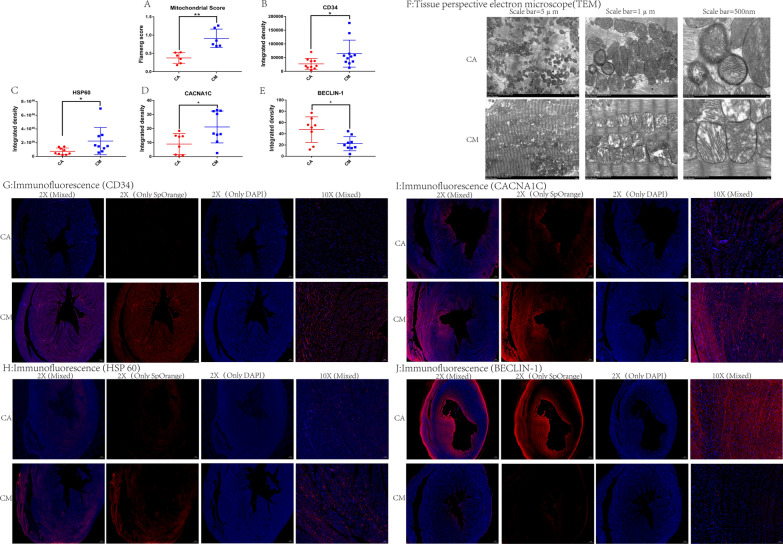
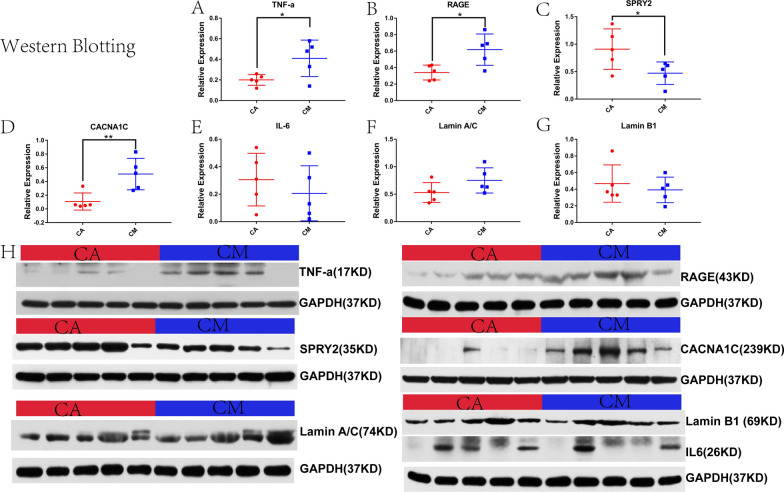
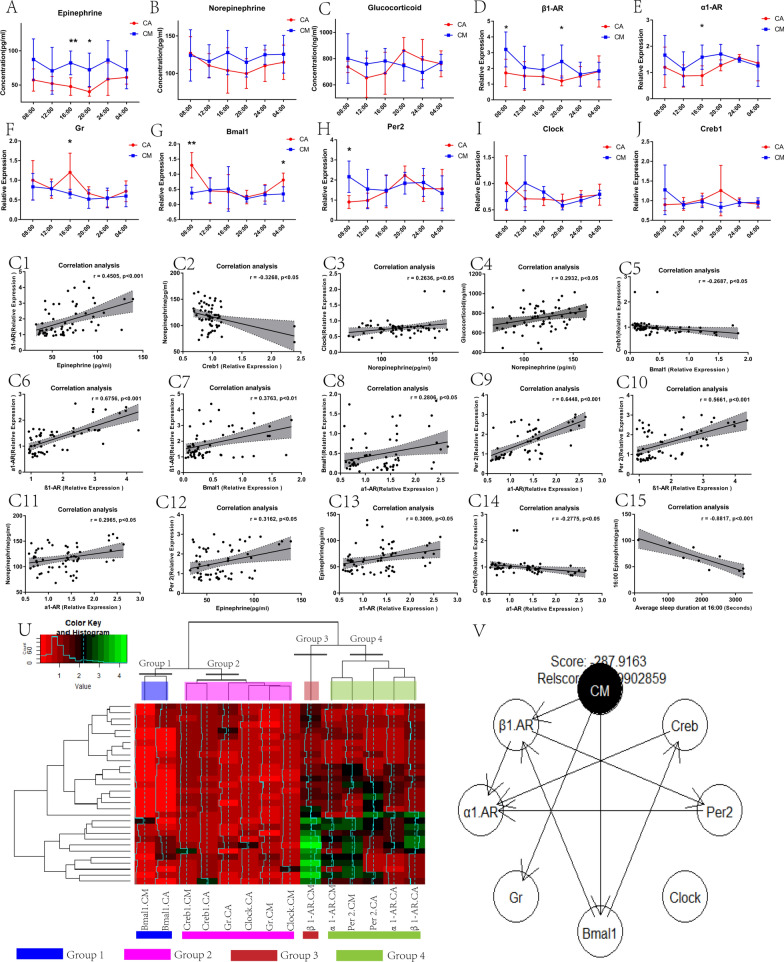
Results: (1) The IP protocol caused CM in rats. (2) CM rats showed significantly higher blood pressure during the day (resting phase). They also showed significantly higher serum levels of angiotensin II and epinephrine during the day compared to the CA rats. (3) CM caused up-regulation of gene expression of adrenergic receptors α1 (α1-AR) and β1 (β1-AR) and down-regulation of the glucocorticoid receptor (Gr) gene expression in rat hearts. It also caused downregulation of Bmal1 expression. In addition, the changes in Bmal1 and Per2 correlated with the changes in β1-AR and α1-AR. (4) CM had adverse effects on multiple molecular proteins of the heart. (5) CM increased the collagen fibers in the rat heart and increased the destruction of mitochondria. (6) Eventually, CM caused a decrease in the pumping function of the heart and decreased the coronary blood flow rate.

Conclusions: (1) CM significantly affected the cardiac structure and function in the adolescent rats through a variety of mechanisms. (2) CM can regulate the expression of myocardial clock genes, and it is likely to have an impact on the heart through this pathway.

Keywords: Adolescent rats; Blood pressure; Circadian misalignment; Clock gene; Heart.


Conflict of interest statement

None.

Figures

Fig. 1
Fig. 1
Rhythm amplitude (A) and rhythm period (B) of two different LD-cycle rats measured by Clock Lab. Twenty-four-hour sleep duration (C) and the average sleep duration at 16:00 (D) of rats with two rhythms measured by HomeCage. *p < 0.05, **p < 0.01, ***p < 0.001 (two-sample t-test). E The 24-h activity track of the two groups of rats over 12 consecutive days. The green mark represents the number of times the rat pushed the wheel at this time point, and the red dot represents the onset of the rat’s activity. IP prolonged the rhythm period of rats and gradually delayed the onset of activity. F The 24-h sleep duration trajectory of the two groups of rats. The CA group was measured for 2 days (48 h), and the photoperiod was LD. The CM group was continuously measured for 3 days (72 h), and the photoperiods were DL, DD, and LD. The black shading denotes that the rat was in the dark phase. The white area indicates that the rat was in the light phase. The area shaded in pink represents the sleep time of rats from 15:00 to 17:00, and the average sleep time of rat at 16:00. Abbreviations: CA, circadian alignment; CM, circadian misalignment; DD, dark/dark; DL, dark/light; IP, inverted photoperiod; LD, light/dark
Fig. 2
Fig. 2
A–C The systolic blood pressure (A), diastolic blood pressure (B), and mean arterial pressure (C) of CM and CA rats at different time points. DF The meta2d_pvalue (D), mata2d_AMP (E), and meta2d_phase (F) of the blood pressure in the CM and CA rats at six time points during the 24-h cycle, respectively. *p < 0.05, **p < 0.01, ***p < 0.001. Weights of rats in the two groups after (G) and before (H) the modeling. Serum LDH (I), BNP (J), CK-MB (K), ANGII (08:00) (L), and ANGII (20:00) (M) of the two groups of rats. *p < 0.05, **p < 0.01, ***p < 0.001 (two-sample t-test). Abbreviations: ANGII, angiotensin II; BNP, brain natriuretic peptide; CK-MB, creatine kinase-MB; LDH, lactate dehydrogenase; SBP, systolic blood pressure; DBP, diastolic blood pressure; MBP, mean blood pressure
Fig. 3
Fig. 3
A–J Measurement results of M-Mode. A–J present the results for cardiac output per minute (CO), ejection fraction (EF), short axis shortening rate (FS), systolic diameter (SD), diastolic diameter (DD), left ventricular weight (LV Mass), end-systolic volume, end-diastolic volume, stroke volume (SV), and heart rate (HR), respectively. K M-mode measurement images and analysis results for the two groups of rats. L–O Mean transvalvular pressure, mean velocity, peak transvalvular pressure, and peak velocity of coronary blood flow in the two groups of rats. P Blood flow chart and analysis results for the coronary arteries of the two groups of rats measured using color Doppler. *p < 0.05, **p < 0.01, ***p < 0.001 (two-sample t-test)
Fig. 4
Fig. 4
A Ratio of collagen fibers in heart sections obtained from the two groups of rats, measured by Masson’s trichrome staining. Levels of TNF-a (B), NF-κB (C), mTOR (D), IL-6 (E), and CASP3 (F) measured by immunohistochemical analysis of heart sections. *p < 0.05, **p < 0.01, ***p < 0.001 (two-sample t-test). G Masson’s trichrome staining of sections obtained from the two groups of rats. Immunohistochemical analysis of sections stained for TNF-a (H), NF-κB (I), mTOR (K), IL-6 (L), and CASP3 (M). Yellow–brown represents positive expression. J Staining with Oil Red O (scale: 1 mm). Abbreviations: CASP3, caspase 3; IL-6, interleukin-6; mTOR, mammalian target of rapamycin; NF-κB, nuclear factor-kappa B; TNF-a, tumor necrosis factor-alpha
Fig. 5
Fig. 5
A The Flameng score of myocardial mitochondria measured using a fluoroscopy electron fiberscope. Expression of CD34 (B), HSP60 (C), CACNA1C (D) and BECLIN-1 (E) in the two groups of rats measured by immunofluorescence staining. *p < 0.05, **p < 0.01, ***p < 0.001 (two-sample t-test). (F) Transmission electron microscope scanning images of the myocardial mitochondria from the two groups of rats. A large number of myocardial mitochondria in the CM group showed vacuolar changes and cristae fractures, indicating a significant increase in ruptured mitochondria. Immunofluorescence staining for CD34 (G), HSP60 (H), CACNA1C (I) and BECLIN-1 (J). Blue represents the nucleus stained with DAPI, and red represents positive expression. Abbreviations: DAPI, 4′,6-diamidino-2-phenylindole; HSP60, heat shock protein 60; CACNA1C, Calcium Voltage-Gated Channel Subunit Alpha1 C; BECLIN-1, Coiled-Coil, Moesin-Like BCL2-Interacting Protein
Fig. 6
Fig. 6
Relative expression levels of TNF-a (A), RAGE (B), SPRY2 (C), CACNA1C (D), IL-6 (E), lamin A/C (F), and lamin B1 (G) in the apical tissues of rats from the two groups, measured by western blotting. *p < 0.05, **p < 0.01, ***p < 0.001 (two-sample t-test). H Bands of the above proteins. Abbreviations: IL-6, interleukin-6; RAGE, receptor for advanced glycosylation end-product specific; SPRY2, sprouty RTK signaling antagonist 2; TNF-a, tumor necrosis factor-alpha; CACNA1C, Calcium Voltage-Gated Channel Subunit Alpha1 C
Fig. 7
Fig. 7
A-C represent the statistical results of the concentration of serum EPI, NE, and COR, respectively, in the two groups of rats at six time points in 24 h. DJ represent the relative expression of the myocardial β1-AR, α1-AR, Gr, Bmal1, Per2, Clock, and Creb1 respectively, in the two groups of rats at six time points in 24 h. The two independent samples t-test was used to compare the two groups at each time point. *p < 0.05, **p < 0.01, ***p < 0.001. (C1-C15) represent the correlation analysis between the two factors, respectively. The U represents a two-way clustering heat map of gene expression in myocardial tissue, which is classified using a hierarchical clustering method. Red represents low relative expression, and green represents high relative expression. The V represents the Bayesian network diagram of the interaction between CM and myocardial genes calculated using the heuristic mode. When there is a line between two factors, it indicates that the two factors have a causal relationship (Parents-Descendants), the arrow points to the result (Descendants), and the other end of it is the cause (Parents)

Similar articles

Cited by

References

    1. Scheer FA, et al. Adverse metabolic and cardiovascular consequences of circadian misalignment. Proc Natl Acad Sci U S A. 2009;106(11):4453–4458. doi: 10.1073/pnas.0808180106. - DOI - PMC - PubMed
    1. Fagundo-Rivera J, et al. Work, family and nurses perception about their own health: relationship with breast cancer and shift work. Rev Esp Salud Publica. 2021;2:95. - PubMed
    1. Morris CJ, et al. Circadian misalignment increases cardiovascular disease risk factors in humans. Proc Natl Acad Sci U S A. 2016;113(10):E1402–E1411. doi: 10.1073/pnas.1516953113. - DOI - PMC - PubMed
    1. Fritschi L, et al. Hypotheses for mechanisms linking shiftwork and cancer. Med Hypotheses. 2011;77(3):430–436. doi: 10.1016/j.mehy.2011.06.002. - DOI - PubMed
    1. Vetter C, et al. Association between rotating night shift work and risk of coronary heart disease among women. JAMA. 2016;315(16):1726–1734. doi: 10.1001/jama.2016.4454. - DOI - PMC - PubMed

Publication types

Substances