. 2022 Aug 6;23(1):564.
doi: 10.1186/s12864-022-08801-4.

Simultaneous testing of rule- and model-based approaches for runs of homozygosity detection opens up a window into genomic footprints of selection in pigs

Affiliations

Simultaneous testing of rule- and model-based approaches for runs of homozygosity detection opens up a window into genomic footprints of selection in pigs

Jan Berghöfer et al. BMC Genomics. .

Abstract

Background: Past selection events left footprints in the genome of domestic animals, which can be traced back by stretches of homozygous genotypes, designated as runs of homozygosity (ROHs). The analysis of common ROH regions within groups or populations displaying potential signatures of selection requires high-quality SNP data as well as carefully adjusted ROH-defining parameters. In this study, we used a simultaneous testing of rule- and model-based approaches to perform strategic ROH calling in genomic data from different pig populations to detect genomic regions under selection for specific phenotypes.

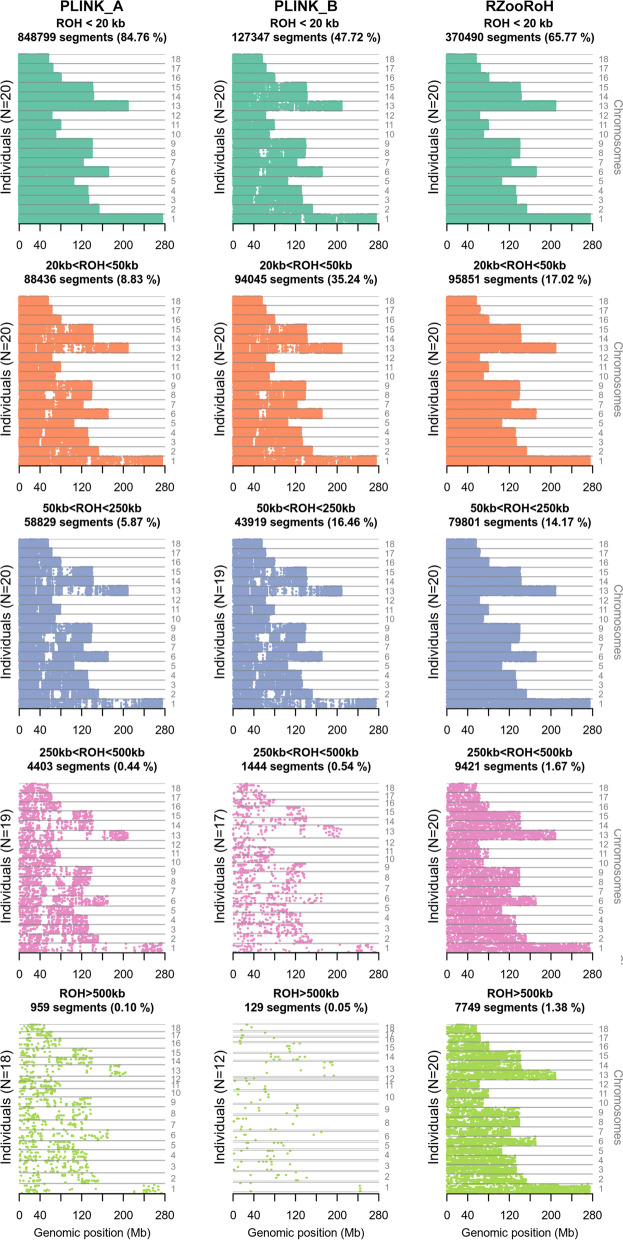
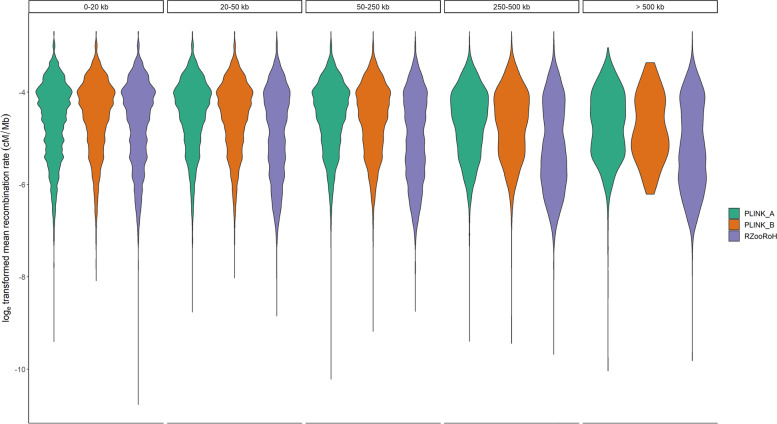
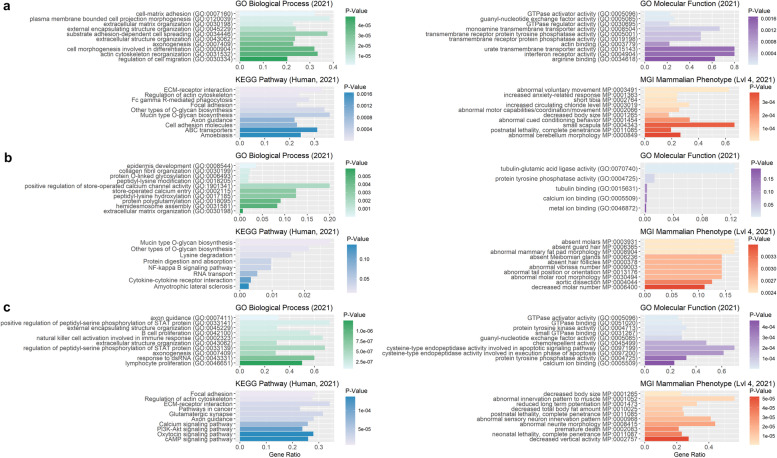
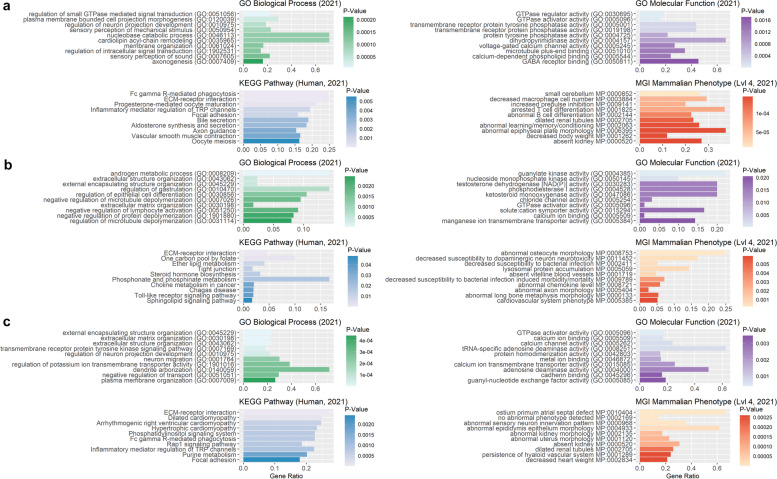
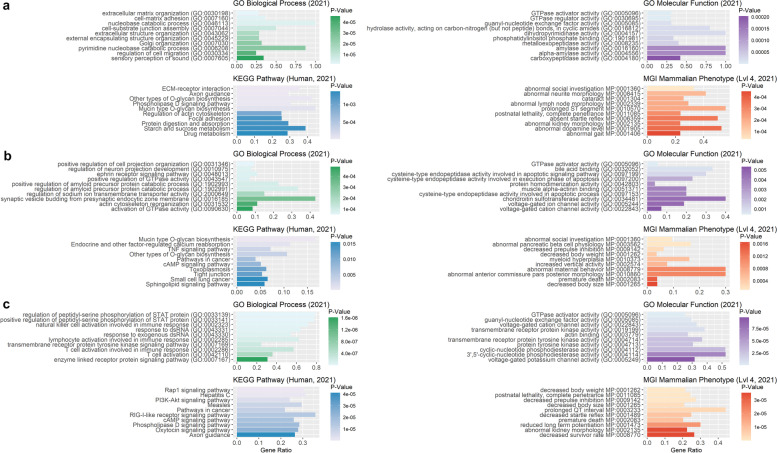
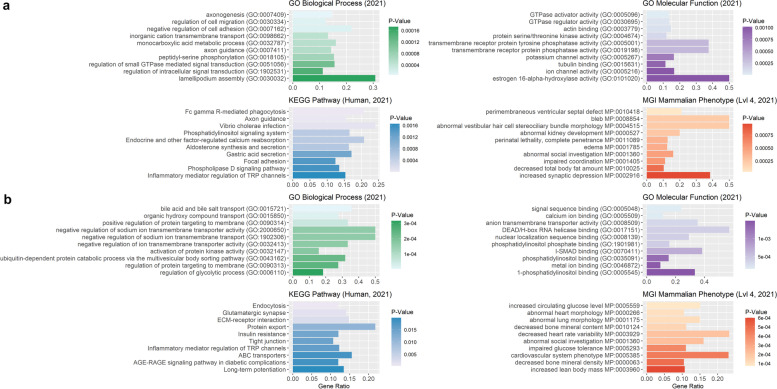
Results: Our ROH analysis using a rule-based approach offered by PLINK, as well as a model-based approach run by RZooRoH demonstrated a high efficiency of both methods. It underlined the importance of providing a high-quality SNP set as input as well as adjusting parameters based on dataset and population for ROH calling. Particularly, ROHs ≤ 20 kb were called in a high frequency by both tools, but to some extent covered different gene sets in subsequent analysis of ROH regions common for investigated pig groups. Phenotype associated ROH analysis resulted in regions under potential selection characterizing heritage pig breeds, known to harbour a long-established breeding history. In particular, the selection focus on fitness-related traits was underlined by various ROHs harbouring disease resistance or tolerance-associated genes. Moreover, we identified potential selection signatures associated with ear morphology, which confirmed known candidate genes as well as uncovered a missense mutation in the ABCA6 gene potentially supporting ear cartilage formation.

Conclusions: The results of this study highlight the strengths and unique features of rule- and model-based approaches as well as demonstrate their potential for ROH analysis in animal populations. We provide a workflow for ROH detection, evaluating the major steps from filtering for high-quality SNP sets to intersecting ROH regions. Formula-based estimations defining ROHs for rule-based method show its limits, particularly for efficient detection of smaller ROHs. Moreover, we emphasize the role of ROH detection for the identification of potential footprints of selection in pigs, displaying their breed-specific characteristics or favourable phenotypes.

Keywords: Pig genome; Runs of homozygosity; SNP density; Selection signatures.


Conflict of interest statement

The authors declare that they have no competing interests.

Figures

Fig. 1
Fig. 1
Workflow of ROH detection pipeline. Fastq files were used as input, variants were called, quality controlled and underwent ROH detection with the rule-based ROH detection approach implemented in PLINK and the model-based ROH detection approach run by RZooRoH. Finally, ROHRs were identified and investigated for potential genes of interest using functional enrichment analysis. A ROHRs-merging step was run as optional for particular applications
Fig. 2
Fig. 2
Evaluation of SNP filtering parameters. a The number of SNPs after filtering with the minimum read depth (minDP, rainbow colors), the maximum read depth (maxDP) and a minimum quality threshold (minQ) of 30 are displayed. An increase of the number of filtered SNPs can be observed with an increasing maxDP and a decrease with a higher minDP. b The number of SNPs resulting from strategic testing of minimum mean read depth (min-meanDP) and maximum number of allowed missing genotypes (max-missing-count) testing. An increase of the number of filtered SNPs is displayed relative to an increasing number of allowed missing genotypes (max-missing-count) and a lower minimum mean read depth (min-meanDP)
Fig. 3
Fig. 3
Configuration test for PLINK’s ROH detection parameters defining the scanning window. The number of detected ROHs for different scanning window sizes (homozyg-window-snp) and scanning window-thresholds (homozyg-window-threshold) are displayed. A higher number of ROHs was detected when a lower homozyg-window-snp value was applied. In general, the number of ROHs was markedly higher in custom parameter settings (red) compared to default parameter settings (blue)
Fig. 4
Fig. 4
Test of PLINK’s ROH detection parameters defining a ROH segment. a The number of detected ROHs for different minimum SNP counts (homozyg-snp) and maximum gap sizes between two SNPs (homozyg-gap, on top of each plot) is displayed. A higher number of ROHs with a lower ROH length is detected by using the less stringent default parameter settings (blue). b Test settings for ROH detection based on SNP density. The number of detected ROHs for a maximum inverse density (homozyg-density) and the maximum gap size between two ROHs (homozyg-gap, on top of each plot) are given. The highest number of ROHs was identified for homozyg-density of 0.08 kb/SNP based on custom parameter settings (red) and homozyg-density of 0,12 kb/SNP for default parameter settings (blue)
Fig. 5
Fig. 5
Evaluation of the consequences resulting from the number of heterozygous and missing SNPs in PLINK. The number of ROHs and average ROH length (in kb) dependent of the maximum number of heterozygous SNPs (homozyg-window-het) and missing SNPs allowed per window (homozyg-window-missing, on top of each plot) for parameter sets PLINK_A (homozyg-SNP 20, green) and PLINK_B (homozyg-SNP 120, orange) is displayed
Fig. 6
Fig. 6
Size distribution and overlap of ROHs detected using PLINK_A and PLINK_B. For each parameter set (PLINK_A, PLINK_B), the number of ROHs per size category are displayed for each investigated breed (x-axis: ASxMA: Angeln Saddleback × Mangalitza, BP: Bentheim Black Pied, DU: Duroc, GMN: Goettingen Minipig, GO: Gloucester Old Spot, HR: Husum Red Pied, HRxAS: Husum Red Pied × Angeln Saddleback, IB: Iberian, KK: Kune, LR × YS × PI: Landrace × Yorkshire × Pietrain, MA: Mangalitza, MH: Meishan, ML: Mini-Lewe, MN: Minipig, MN × MG: Minipig × Mangalitza, PI: Pietrain, TP: Turopolje, WMN: Wuzhishan minipig, YMN: Yucatan miniature pig, YS: Yorkshire). All ROHs were assigned to size categories of “0–20 kb”, 20–50 kb”,”50–250 kb”,”250–500 kb”,”500–1000 kb”,” > 1000 kb” (indicated on top) and the proportion of ROHs overlapping with the other tool or parameter set was highlighted in orange and designated as “yes”
Fig. 7
Fig. 7
Size distribution and overlap of ROHs detected using RZooRoH and PLINK. For each tool and parameter set (PLINK_A, PLINK_B), the number of ROHs per size category are displayed for each investigated breed (x-axis: AS × MA: Angeln Saddleback × Mangalitza, BP: Bentheim Black Pied, DU: Duroc, GMN: Goettingen Minipig, GO: Gloucester Old Spot, HR: Husum Red Pied, HR × AS: Husum Red Pied × Angeln Saddleback, IB: Iberian, KK: Kune, LR × YS × PI: Landrace × Yorkshire × Pietrain, MA: Mangalitza, MH: Meishan, ML: Mini-Lewe, MN: Minipig, MN × MG: Minipig × Mangalitza, PI: Pietrain, TP: Turopolje, WMN: Wuzhishan minipig, YMN: Yucatan miniature pig, YS: Yorkshire). All ROHs were assigned to size categories of “0–20 kb”, “20–50 kb”, “50–250 kb”, “250–500 kb”, “500–1000 kb”, “ > 1000 kb” (indicated on top) and the proportion of ROHs overlapping with the other tool or parameter set was highlighted in orange and designated as “yes”
Fig. 8
Fig. 8
Chromosomal and size-distribution of ROHs detected using PLINK and RZooRoH. Each row contains ROH segments obtained from a single individual (if applicable) put on top of the ROH segments of another individual. These rows are grouped for all 20 individuals based on their position chromosomes 1 (bottom of each panel) to 18 (top of each panel). ROHs are displayed in 5 length categories: 0–20 kb, 20–50 kb, 50–250 kb, 250–500 kb and above 500 kb
Fig. 9
Fig. 9
Relationship between distribution of ROHs lengths and recombination rates for PLINK and RZooRoH. For each tool and parameter set (indicated by colour: PLINK_A (orange) and PLINK_B (green), RZooRoH (purple)), the ROH density is displayed as a function of the mean recombination rate (y-Axis) per size category (top)
Fig. 10
Fig. 10
Functional enrichment analysis for genes overlapping with heritage-breed-associated ROHRs identified with PLINK and RZooRoH. Illustration of 10 highest enriched GO terms for enrichR databases “GO_Molecular_Function_2021”, “GO_Biological_Process_2021, “Human Phenotype Ontology”, “KEGG_2021_Human” and “MGI_Mammalian_Phenotype_Level_4_2021” sorted by p-value (x-axis), for all genes overlapping with ROHRs detected with either PLINK_A (a, 20 SNPs), PLINK_B (b, 120 SNPs) or RZooRoH (c), and shared by all individuals of heritage pig breeds
Fig. 11
Fig. 11
Functional enrichment analysis for genes overlapping with disease-resistance-associated ROHRs identified with PLINK and RZooRoH. Illustration of 10 highest enriched GO terms for enrichR databases “GO_Molecular_Function_2021”, “GO_Biological_Process_2021”, “KEGG_2021_Human” and “MGI_Mammalian_Phenotype_Level_4_2021” sorted by p-value (x-axis), for all genes overlapping with ROHRs detected with either PLINK_A (a, 20 SNPs), PLINK_B (b, 120 SNPs) or RZooRoH (c), and shared by all individuals with T/T genotype (GBP5: g.127301202G > T) associated with disease resistance
Fig. 12
Fig. 12
Functional enrichment analysis for genes overlapping with lop-ear-associated ROHRs identified with PLINK and RZooRoH. Illustration of 10 most significantly enriched GO terms for enrichR databases “GO_Molecular_Function_2021”, “GO_Biological_Process_2021”,”KEGG_2021_Human” and “MGI_Mammalian_Phenotype_Level_4_2021” sorted by p-value (x-axis), for all genes overlapping with ROHRs detected with either PLINK_A (a, 20 SNPs), PLINK_B (b, 120 SNPs) or RZooRoH (c), and shared by all individuals with lop ears
Fig. 13
Fig. 13
Functional enrichment analysis for genes overlapping with prick-ear-associated ROHRs identified with PLINK and RZooRoH. Illustration of 10 most significant enriched GO terms for enrichR databases “GO_Molecular_Function_2021”, “GO_Biological_Process_2021”, “KEGG_2021_Human” and “MGI_Mammalian_Phenotype_Level_4_2021” sorted by p-value (x-axis), for all genes overlapping with ROHRs detected with PLINK_A (a, 20 SNPs) or RZooRoH (b), and shared by all individuals with prick ears. For PLINK_B (120 SNPs), no ROHRs shared by all individuals with prick ears were detected

Similar articles

Cited by

References

    1. Falconer DS, Mackay TFC. Introduction to quantitative genetics. 4. Harlow, England: Prentice Hall; 1996.
    1. Peripolli E, Munari DP, Silva MVGB, Lima ALF, Irgang R, Baldi F. Runs of homozygosity: current knowledge and applications in livestock. Anim Genet. 2017;48(3):255–271. doi: 10.1111/age.12526. - DOI - PubMed
    1. Curik I, Ferenčaković M, Sölkner J. Inbreeding and runs of homozygosity: a possible solution to an old problem. Livest Sci. 2014;166:26–34. doi: 10.1016/j.livsci.2014.05.034. - DOI
    1. Ceballos FC, Joshi PK, Clark DW, Ramsay M, Wilson JF. Runs of homozygosity: windows into population history and trait architecture. Nat Rev Genet. 2018;19(4):220–234. doi: 10.1038/nrg.2017.109. - DOI - PubMed
    1. Gibson J, Morton NE, Collins A. Extended tracts of homozygosity in outbred human populations. Hum Mol Genet. 2006;15(5):789–795. doi: 10.1093/hmg/ddi493. - DOI - PubMed

LinkOut - more resources