Selective isolation of extracellular vesicles from minimally processed human plasma as a translational strategy for liquid biopsies
- PMID: 35933395
- PMCID: PMC9357340
- DOI: 10.1186/s40364-022-00404-1
Selective isolation of extracellular vesicles from minimally processed human plasma as a translational strategy for liquid biopsies
Abstract
Background: Intercellular communication is mediated by extracellular vesicles (EVs), as they enclose selectively packaged biomolecules that can be horizontally transferred from donor to recipient cells. Because all cells constantly generate and recycle EVs, they provide accurate timed snapshots of individual pathophysiological status. Since blood plasma circulates through the whole body, it is often the biofluid of choice for biomarker detection in EVs. Blood collection is easy and minimally invasive, yet reproducible procedures to obtain pure EV samples from circulating biofluids are still lacking. Here, we addressed central aspects of EV immunoaffinity isolation from simple and complex matrices, such as plasma.
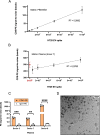
Methods: Cell-generated EV spike-in models were isolated and purified by size-exclusion chromatography, stained with cellular dyes and characterized by nano flow cytometry. Fluorescently-labelled spike-in EVs emerged as reliable, high-throughput and easily measurable readouts, which were employed to optimize our EV immunoprecipitation strategy and evaluate its performance. Plasma-derived EVs were captured and detected using this straightforward protocol, sequentially combining isolation and staining of specific surface markers, such as CD9 or CD41. Multiplexed digital transcript detection data was generated using the Nanostring nCounter platform and evaluated through a dedicated bioinformatics pipeline.
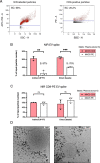
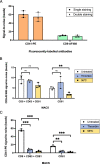
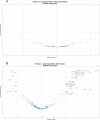
Results: Beads with covalently-conjugated antibodies on their surface outperformed streptavidin-conjugated beads, coated with biotinylated antibodies, in EV immunoprecipitation. Fluorescent EV spike recovery evidenced that target EV subpopulations can be efficiently retrieved from plasma, and that their enrichment is dependent not only on complex matrix composition, but also on the EV surface phenotype. Finally, mRNA profiling experiments proved that distinct EV subpopulations can be captured by directly targeting different surface markers. Furthermore, EVs isolated with anti-CD61 beads enclosed mRNA expression patterns that might be associated to early-stage lung cancer, in contrast with EVs captured through CD9, CD63 or CD81. The differential clinical value carried within each distinct EV subset highlights the advantages of selective isolation.
Conclusions: This EV isolation protocol facilitated the extraction of clinically useful information from plasma. Compatible with common downstream analytics, it is a readily implementable research tool, tailored to provide a truly translational solution in routine clinical workflows, fostering the inclusion of EVs in novel liquid biopsy settings.
Keywords: Early-stage cancer; Enrichment; Extracellular vesicle; Immunoprecipitation; Liquid biopsy; Plasma; Platelet.
© 2022. The Author(s).
Conflict of interest statement
The authors declare no conflicts of interest.
Figures


Similar articles
-
EV-Elute: A universal platform for the enrichment of functional surface marker-defined extracellular vesicle subpopulations.J Extracell Vesicles. 2024 Dec;13(12):e70017. doi: 10.1002/jev2.70017. J Extracell Vesicles. 2024. PMID: 39692115 Free PMC article.
-
[Efficient capture and proteomics analysis of urinary extracellular vesicles by affinity purification].Se Pu. 2025 May;43(5):508-517. doi: 10.3724/SP.J.1123.2024.11013. Se Pu. 2025. PMID: 40331614 Free PMC article. Chinese.
-
A novel multiplex bead-based platform highlights the diversity of extracellular vesicles.J Extracell Vesicles. 2016 Feb 19;5:29975. doi: 10.3402/jev.v5.29975. eCollection 2016. J Extracell Vesicles. 2016. PMID: 26901056 Free PMC article.
-
Characterizing Extracellular Vesicles and Their Diverse RNA Contents.Front Genet. 2020 Jul 17;11:700. doi: 10.3389/fgene.2020.00700. eCollection 2020. Front Genet. 2020. PMID: 32765582 Free PMC article. Review.
-
Emergence of Extracellular Vesicles as "Liquid Biopsy" for Neurological Disorders: Boom or Bust.Pharmacol Rev. 2024 Feb 13;76(2):199-227. doi: 10.1124/pharmrev.122.000788. Pharmacol Rev. 2024. PMID: 38351075 Free PMC article. Review.
Cited by
-
Methods to Evaluate Changes in Mitochondrial Structure and Function in Cancer.Cancers (Basel). 2023 Apr 29;15(9):2564. doi: 10.3390/cancers15092564. Cancers (Basel). 2023. PMID: 37174030 Free PMC article. Review.
-
Factors to consider before choosing EV labeling method for fluorescence-based techniques.Front Bioeng Biotechnol. 2024 Sep 18;12:1479516. doi: 10.3389/fbioe.2024.1479516. eCollection 2024. Front Bioeng Biotechnol. 2024. PMID: 39359260 Free PMC article. Review.
-
A critical systematic review of extracellular vesicle clinical trials.J Extracell Vesicles. 2024 Oct;13(10):e12510. doi: 10.1002/jev2.12510. J Extracell Vesicles. 2024. PMID: 39330928 Free PMC article.
-
Cancer screening with multicancer detection tests: A translational science review.CA Cancer J Clin. 2024 Jul-Aug;74(4):368-382. doi: 10.3322/caac.21833. Epub 2024 Mar 22. CA Cancer J Clin. 2024. PMID: 38517462 Free PMC article. Review.
-
Proteomic analysis of plasma-derived extracellular vesicles: pre- and postprandial comparisons.Sci Rep. 2024 Oct 3;14(1):23032. doi: 10.1038/s41598-024-74228-4. Sci Rep. 2024. PMID: 39363010 Free PMC article.
References
-
- Johnsen KB, Gudbergsson JM, Andresen TL, Simonsen JB. What is the blood concentration of extracellular vesicles? Implications for the use of extracellular vesicles as blood-borne biomarkers of cancer. Biochim Biophys Acta BBA Rev Cancer. 2019;1871(1):109–116. doi: 10.1016/j.bbcan.2018.11.006. - DOI - PubMed
Grants and funding
LinkOut - more resources
Full Text Sources
Miscellaneous

