. 2022 Aug 6;13(1):4580.
doi: 10.1038/s41467-022-32284-2.

Spatiotemporal dynamics of macrophage heterogeneity and a potential function of Trem2hi macrophages in infarcted hearts

Affiliations

Spatiotemporal dynamics of macrophage heterogeneity and a potential function of Trem2hi macrophages in infarcted hearts

Seung-Hyun Jung et al. Nat Commun. .

Abstract

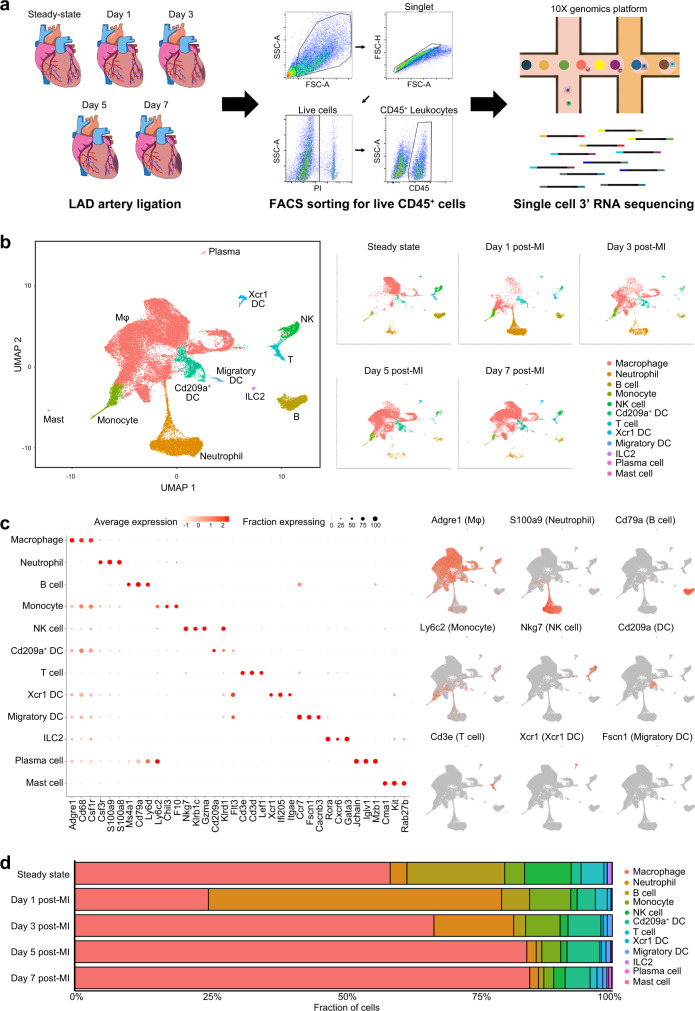
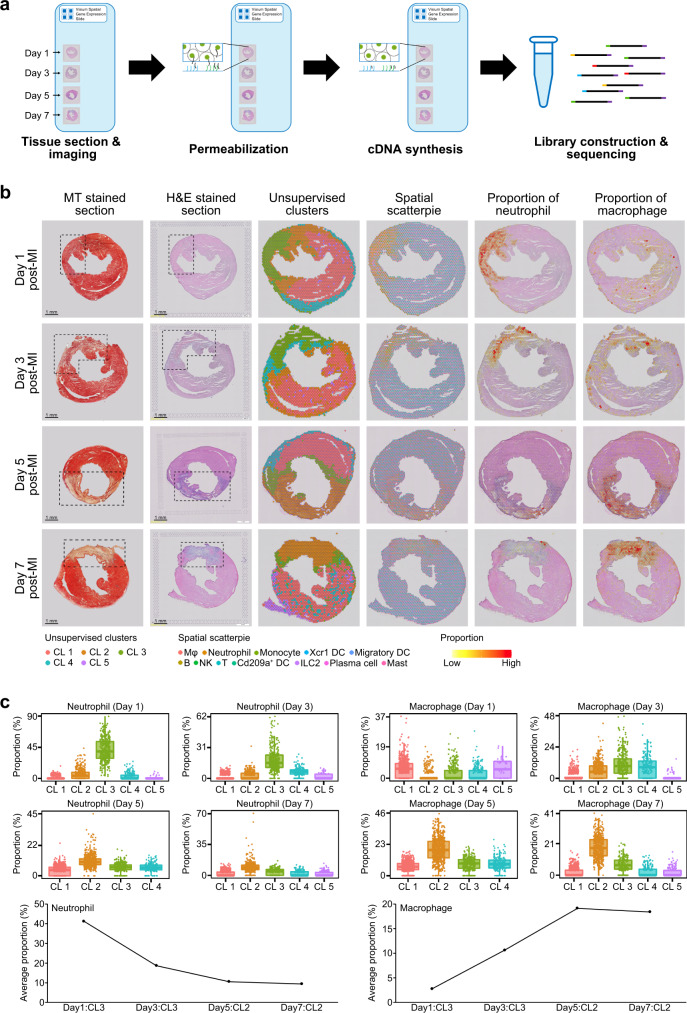
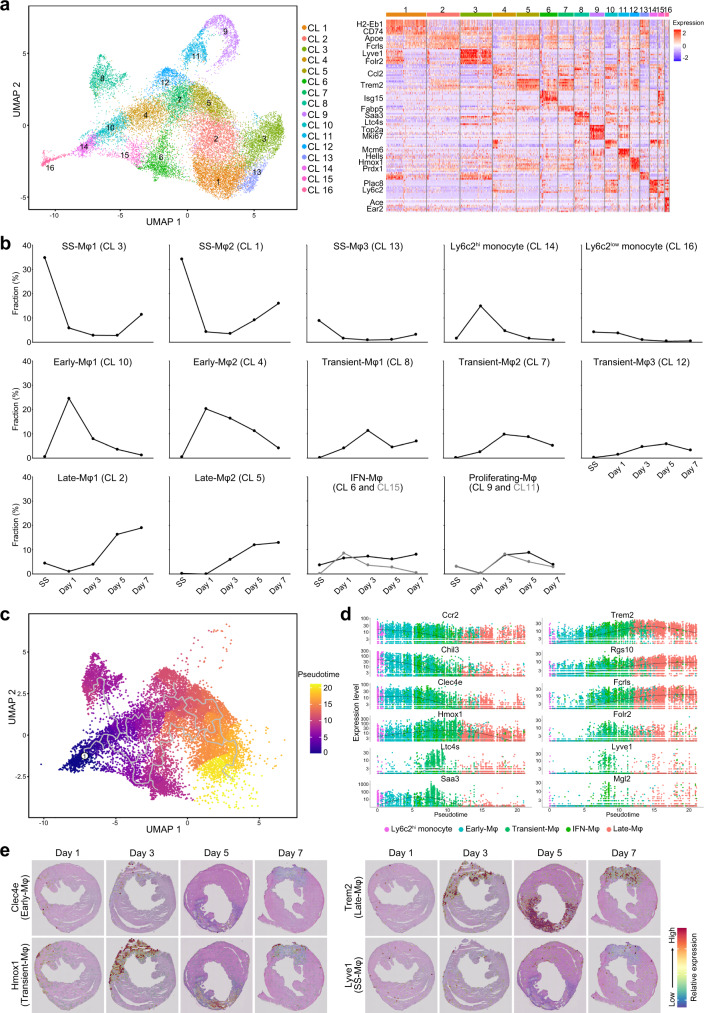
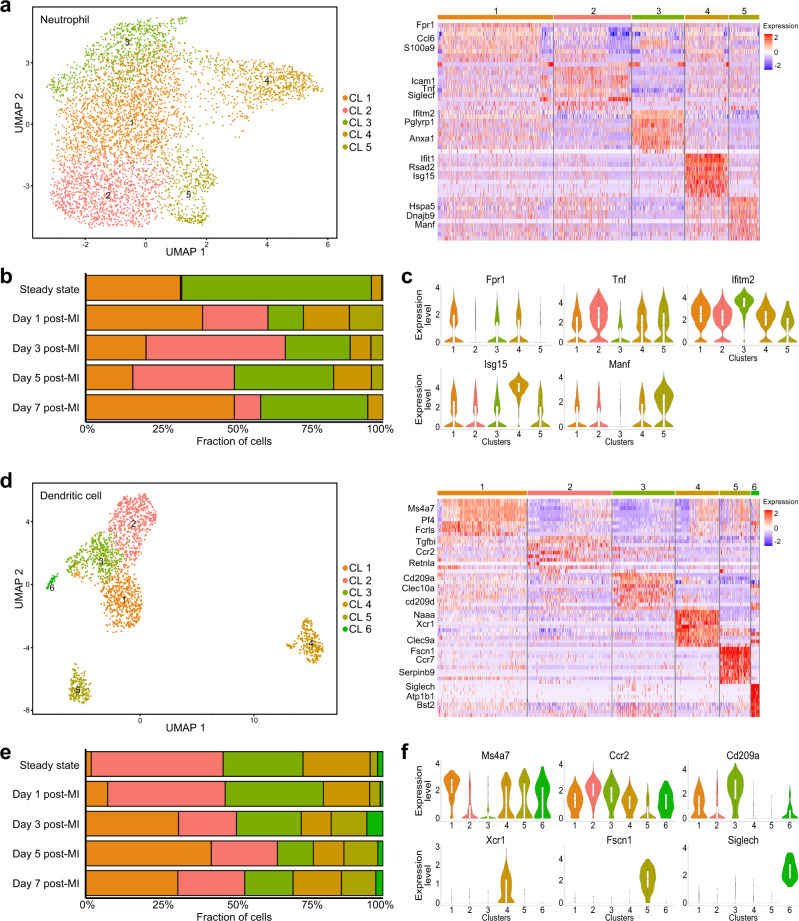
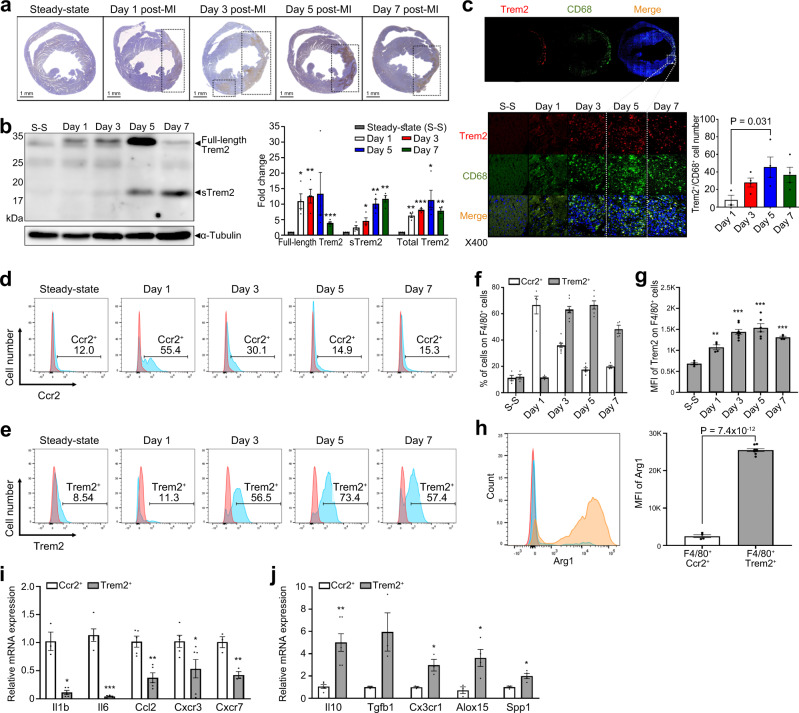
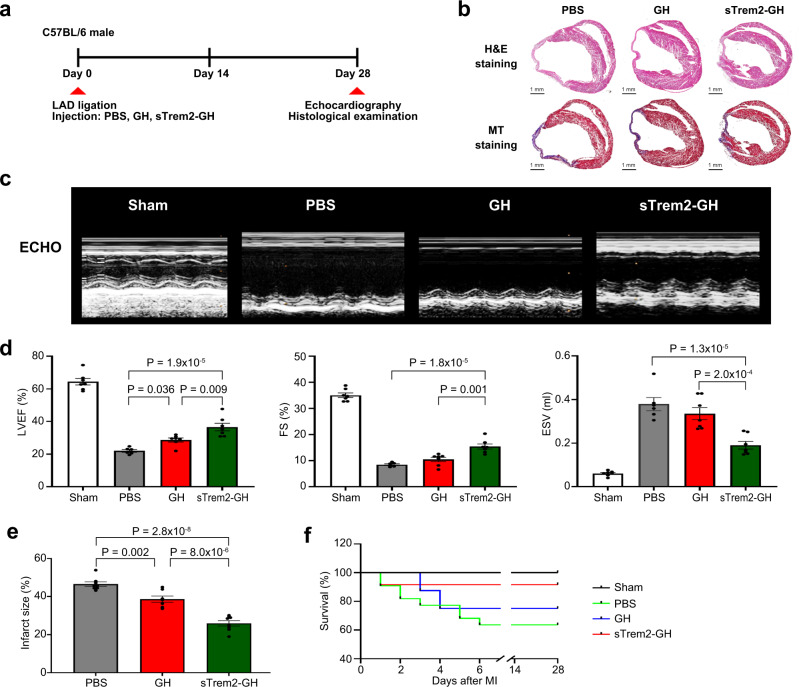
Heart failure (HF) is a frequent consequence of myocardial infarction (MI). Identification of the precise, time-dependent composition of inflammatory cells may provide clues for the establishment of new biomarkers and therapeutic approaches targeting post-MI HF. Here, we investigate the spatiotemporal dynamics of MI-associated immune cells in a mouse model of MI using spatial transcriptomics and single-cell RNA-sequencing (scRNA-seq). We identify twelve major immune cell populations; their proportions dynamically change after MI. Macrophages are the most abundant population at all-time points (>60%), except for day 1 post-MI. Trajectory inference analysis shows upregulation of Trem2 expression in macrophages during the late phase post-MI. In vivo injection of soluble Trem2 leads to significant functional and structural improvements in infarcted hearts. Our data contribute to a better understanding of MI-driven immune responses and further investigation to determine the regulatory factors of the Trem2 signaling pathway will aid the development of novel therapeutic strategies for post-MI HF.


Conflict of interest statement

The authors declare no competing interests.

Figures

Fig. 1
Fig. 1. Time-dependent immune cell dynamics after myocardial infarction.
a Graphical representation of the experimental setup. Experimental MI was induced in mice by the permanent ligation of the proximal portion of the left anterior descending artery (LAD). Samples were isolated from mouse hearts at days 0, 1, 3, 5, and 7 post-MI. Tissues were enzymatically digested and live CD45+ cells were FACS-sorted and loaded for scRNA-seq. b Two-dimensional uniform manifold approximation and projection (UMAP) visualization of the 33,977 cardiac CD45+ cells identified 12 broad cell types after unsupervised clustering. Each point represents a single cell; cell types are color-coded. c Left: dot plot of well-known cell-type-specific marker genes per cell type. The dot intensity (from white to red) represents the average expression value of all cells per cell type and the dot size represents the proportion of cells expressing the genes. Right: feature plot representing the expression levels of the selected cell-type-specific marker genes. d Bar plot representing the proportions of cells in each of the 12 broad cell types according to the time-point after MI. Source data are provided in the Source Data file.
Fig. 2
Fig. 2. Spatial transcriptome sequencing (ST-seq) of mouse hearts after MI.
a Schematic workflow of ST-seq. Frozen heart sections were placed onto Visium Spatial Gene Expression slides and then permeabilized; cDNAs were synthesized on the slides. b The first and second column represents Masson’s trichrome- and H&E-stained images showing the infarcted area (dotted box). In the third column, each spot contains 1–10 cells on average, colored according to the defined clusters using Seurat. The fourth column represents the spatial scatter pie plot which shows the proportions of the immune cells. The proportions were deconvoluted from the scRNA-seq data using the SPOTlight algorithm. The fifth and sixth columns represent the neutrophil and macrophage proportion, respectively. Yellow and red indicate lower and higher proportions, respectively. Results are representative of four different samples. c The proportion of neutrophils and macrophages among total immune cells infiltrated into heart tissue according to the time-point after MI. Each cluster from the time-point after MI has the same number of spots (day 1 post-MI: 1803 spots; day 3 post-MI: 1916 spots; day 5 post-MI: 1870 spots; day 7 post-MI: 1973 spots). The lower whisker, lower hinge, box center, upper hinge, and upper whisker represent the minimum, lower quartile, median, upper quartile, and maximum calculated without outlier values which are more than 1.5× interquartile range of the lower and upper quartiles. The proportion of all immune cell types are illustrated in Supplementary Figs. 2–5. Source data are provided in the Source Data file.
Fig. 3
Fig. 3. Monocyte/macrophage cell subsets.
a The UMAP visualization of the 21,533 cardiac monocytes/macrophages identified 16 subsets (left panel). Each point represents a single cell, colored according to the sub-cluster assigned. In the right panel, the heatmap shows the top 10 most differentially expressed genes in each sub-cluster. Blue and red indicate lower and higher expression, respectively. The typical markers strongly and specifically associated with each sub-cluster are shown on the left. b The proportion of each sub-cluster among total monocytes/macrophages according to the time-point after MI. c Pseudo-time trajectory as per the pseudo-time algorithm. Pseudo-time analysis is an approach used to investigate the path and progress of individual cells undergoing differentiation. Ly6c2hi monocytes were set as the root of the trajectory. The scale indicates the temporal status, from dark blue (recruited Ly6c2hi monocytes) to yellow (Late macrophages). d Spline plots showing the expression of typical markers associated with each cluster across the pseudo-time (Ly6c2hi monocytes: 632 cells; Early-Mφ: 2838 cells; Transient-Mφ: 3146 cells; IFN-Mφ: 1856 cells; Late-Mφ: 4380 cells). e Gene expression levels of Clec4e, Hmox1, Trem2, and Lyve1 as per ST-seq. Blue and red indicate lower and higher expression, respectively. The scale bar is marked on the H&E stained section in Fig. 2b. Results are representative of four different samples. Day 1, day 1 post-MI; Day 3, day 3 post-MI; Day 5, day 5 post-MI; Day 7, day 7 post-MI. Source data for Figs. 3b and 3d are provided in the Source Data file.
Fig. 4
Fig. 4. Neutrophil and dendritic cell subsets.
a The UMAP visualization of 5135 neutrophils identified five distinct subsets (left panel). Each point represents a single cell, colored according to the sub-cluster assigned. In the right panel, the heatmap shows the top 10 most differentially expressed genes in each sub-cluster. Blue and red indicate lower and higher expression, respectively. Typical markers strongly and specifically associated with each sub-cluster are shown on the left. b Bar plot showing the proportions of cells in each of the 5 sub-clusters according to the time-point after MI. c Violin plots of the expression of Fpr1, Tnf1, Ifitm2, Isg15, and Manf in neutrophil sub-clusters (Cluster 1: 1864 cells; Cluster 2: 1243 cells; Cluster 3: 844 cells; Cluster 4: 698 cells; Cluster 5: 486 cells). d The UMAP visualization of 1921 dendritic cells identified 6 distinct subsets (left panel). Each point represents a single cell, colored according to the sub-cluster assigned. In the right panel, the heatmap shows the top 10 most differentially expressed genes in each sub-cluster. Blue and red indicate lower and higher expression, respectively. Typical markers strongly and specifically associated with each sub-cluster are shown on the left. e Bar plot showing the proportions of cells in each of the 6 sub-clusters according to the time-point after MI. f Violin plots of the expression of Ms4a7, Ccr2, Cd209a, Xcr1, Fscn1, and Siglech in DC sub-clusters. (Cluster 1: 541 cells; Cluster 2: 507 cells; Cluster 3: 377 cells; Cluster 4: 264 cells; Cluster 5: 184 cells; Cluster 6: 48 cells). Regarding the box polts of c and f, the lower whisker, lower hinge, box center, upper hinge, and upper whisker represent the minimum, lower quartile, median, upper quartile, and maximum calculated without outlier values which are more than 1.5× interquartile range of the lower and upper quartiles. Source data for b, c and e, f are provided in the Source Data file.
Fig. 5
Fig. 5. Orthogonal validation of the expression of Trem2 in the heart after MI.
a Immunohistochemistry showed a gradual increase in the expression of Trem2 over time in the infarcted area after the induction of MI, almost absent in the steady-state. Results are representative of five different samples. b Western blot targeting Trem2 showed two bands: a 32 kDa sized one corresponding to the full-length Trem2 protein and an 18 kDa sized one corresponding to soluble Trem2 (sTrem2); 50 µg of infarcted heart tissue proteins were loaded onto each lane. Quantitative comparison of the full-length, soluble form, and total Trem2 expression, respectively (n = 4 for each group). Unpaired two-tailed t-test was used to determine the statistical significance. *P < 0.05, **P < 0.01, ***P < 0.001. c Co-localization assay for Trem2 and the macrophage marker CD68 in the infarcted area according to the time-point after MI. Cells were stained with the specific antibodies anti-Trem2 (red) and anti-CD68 (green). Nuclei were counterstained with DAPI (blue). Quantification of Trem2+/CD68+ cells in the infarcted area (n = 3 for day 1 post-MI; n = 4 for days 2, 5, and 7 post-MI). One-way ANOVA with two-tailed Dunnett test was used to determine the statistical significance. d Comparison of the expression of Ccr2, 1, 3, 5, and 7 days after MI by FACS. e Comparison of the expression of Trem2 1, 3, 5, and 7 days after MI by FACS. f Bars are divided to display the percentage of F4/80+ Ccr2 or Trem2 positive cells in the different experimental days (n = 4 for steady-state, days 1 and 7 post-MI; n = 8 for day 3 post-MI; n = 6 for day 5 post-MI). g Quantitative analysis of Trem2+ F4/80+ cells. The sample size is the same as (f). One-way ANOVA with two-tailed Dunnett test was used to determine the statistical significance. **P < 0.01, ***P < 0.001. h Comparison of Arg1+ cells within F4/80+Ccr2+ and F4/80+Trem2+ cells, 5 days after MI (n = 4 for F4/80+Ccr2+; n = 8 for F4/80+Trem2+). Unpaired two-tailed t-test was used to determine the statistical significance. i Comparison of mRNA expression levels of pro-inflammatory genes in F4/80+Ccr2+ macrophages at day 1 post-MI (n = 5) and F4/80+Trem2+ macrophages at day 5 post-MI (n = 6). Unpaired two-tailed t-test was used to determine the statistical significance. *P < 0.05, **P < 0.01, ***P < 0.001. j Comparison of mRNA expression levels of anti-inflammatory genes in F4/80+Ccr2+ macrophages at day 1 post-MI (n = 5) and F4/80+Trem2+ macrophages at day 5 post-MI (n = 6). Unpaired two-tailed t-test was used to determine the statistical significance. *P < 0.05, **P < 0.01. All of the bar charts are presented as mean ± SEM. Source data with exact P values for b, c and fj are provided in the Source Data file.
Fig. 6
Fig. 6. Effect of the injection of soluble Trem2 (sTrem2) on the heart of MI mouse.
a Treatment schedule. We made an injectable gelatin hydrogel (GH) mixed with sTrem2 and then injected it at two sites of the peri-infarcted area after MI. PBS and GH alone were also administered to the control groups. Twenty-eight days post-MI, echocardiography, and histological examination were performed to evaluate the effects of sTrem2. b Hematoxylin and eosin (H&E) stained images (upper panel) and Masson’s trichrome (MT) stained images (lower panel) of heart tissues of PBS-, GH-, and sTrem2-GH-treated groups at day 28 post-MI. Severe LV dilation was prominent in the control PBS-treated group, while a significant attenuation of LV remodeling with less infarcted wall thinning was observed in the sTrem2-GH-treated group. Results are representative of three different samples. c M-mode echocardiography images of sham operation (n = 7), PBS- (n = 6), GH- (n = 7), and sTrem2-GH-treated (n = 7) groups at day 28 post-MI. Results are representative of four different samples. d Each bar plot represents the left ventricular ejection fraction (left), fractional shortening (middle), and end-systolic volume (right) of the different groups. One-way ANOVA with two-tailed Dunnett test was used to determine the statistical significance. e Quantification of the infarct size on day 28 post-MI in PBS- (n = 8), GH- (n = 7), and sTrme2-GH- (n = 8) treated mice. One-way ANOVA with two-tailed Dunnett test was used to determine the statistical significance. f Kaplan–Meier survival analysis after MI in sham-operated (n = 5), PBS- (n = 11), GH- (n = 11), sTrem2-GH- (n = 12) treated mice. All of the bar charts are presented as mean ± SEM. Source data for df are provided in the Source Data file.

References

    1. Roth GA, et al. Demographic and epidemiologic drivers of global cardiovascular mortality. N. Engl. J. Med. 2015;372:1333–1341. doi: 10.1056/NEJMoa1406656. - DOI - PMC - PubMed
    1. Peters, S. A. E. et al. Trends in recurrent coronary heart disease following myocardial infarction among US women and men between 2008 and 2017. Circulation143, 650–660 (2020). - PubMed
    1. Wellings J, Kostis JB, Sargsyan D, Cabrera J, Kostis WJ. Myocardial infarction data acquisition system study G. Risk factors and trends in incidence of heart failure following acute myocardial infarction. Am. J. Cardiol. 2018;122:1–5. doi: 10.1016/j.amjcard.2018.03.005. - DOI - PubMed
    1. Desta L, et al. Incidence, temporal trends, and prognostic impact of heart failure complicating acute myocardial infarction. The SWEDEHEART Registry (Swedish Web-System for Enhancement and Development of Evidence-Based Care in Heart Disease Evaluated According to Recommended Therapies): A study of 199,851 patients admitted with index acute myocardial infarctions, 1996 to 2008. JACC Heart Fail. 2015;3:234–242. doi: 10.1016/j.jchf.2014.10.007. - DOI - PubMed
    1. Swirski FK, Nahrendorf M. Cardioimmunology: The immune system in cardiac homeostasis and disease. Nat. Rev. Immunol. 2018;18:733–744. doi: 10.1038/s41577-018-0065-8. - DOI - PubMed

Publication types