. 2022 Aug 6;13(1):4587.
doi: 10.1038/s41467-022-32255-7.

Temporal profiling of the breast tumour microenvironment reveals collagen XII as a driver of metastasis

Affiliations

Temporal profiling of the breast tumour microenvironment reveals collagen XII as a driver of metastasis

Michael Papanicolaou et al. Nat Commun. .

Abstract

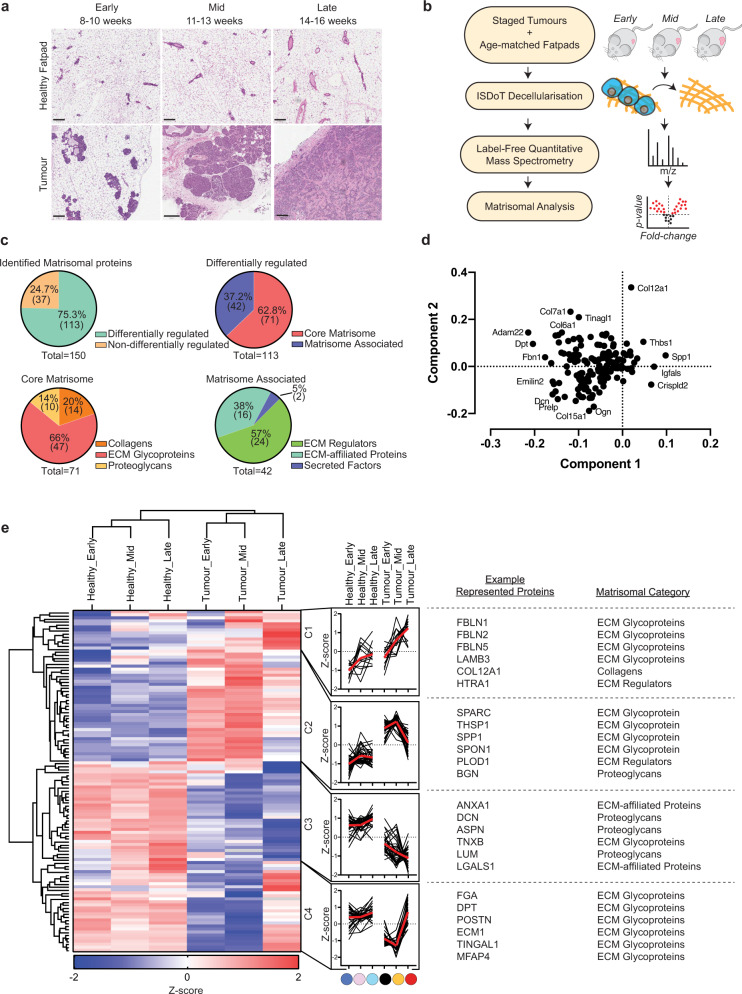
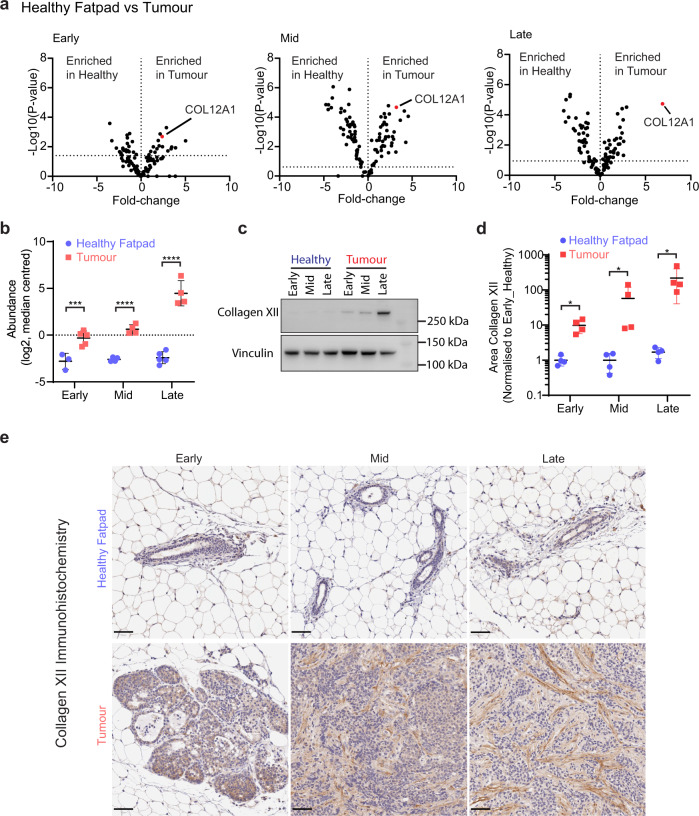
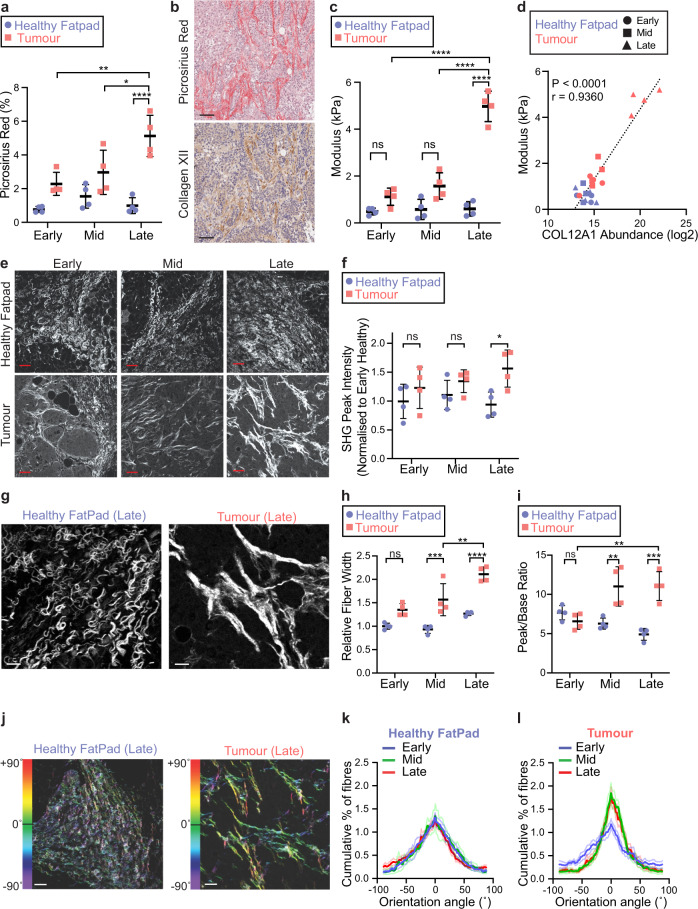
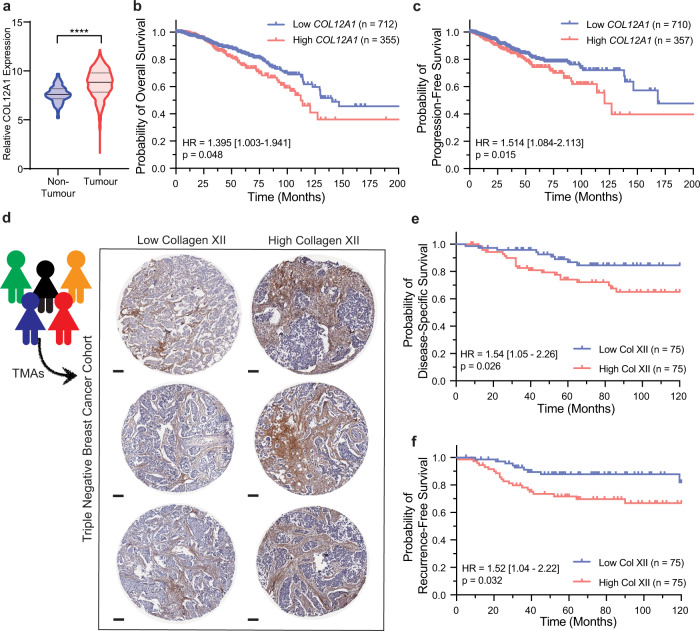
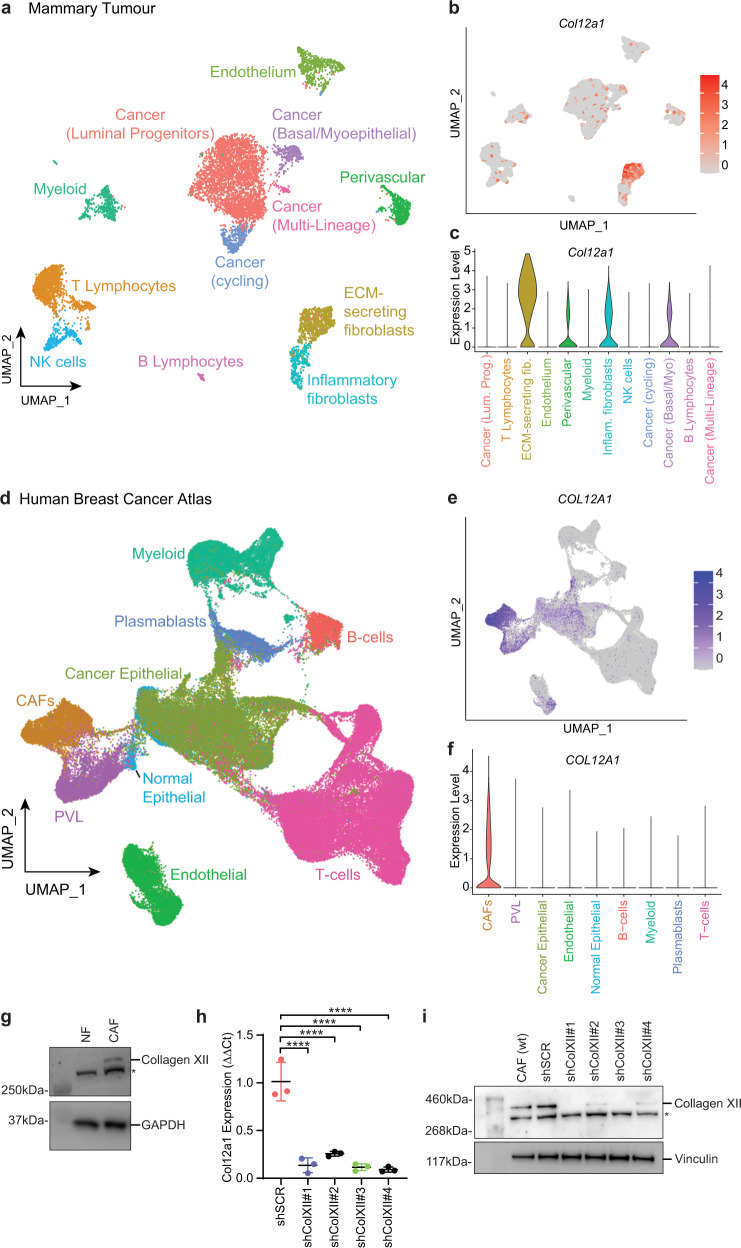
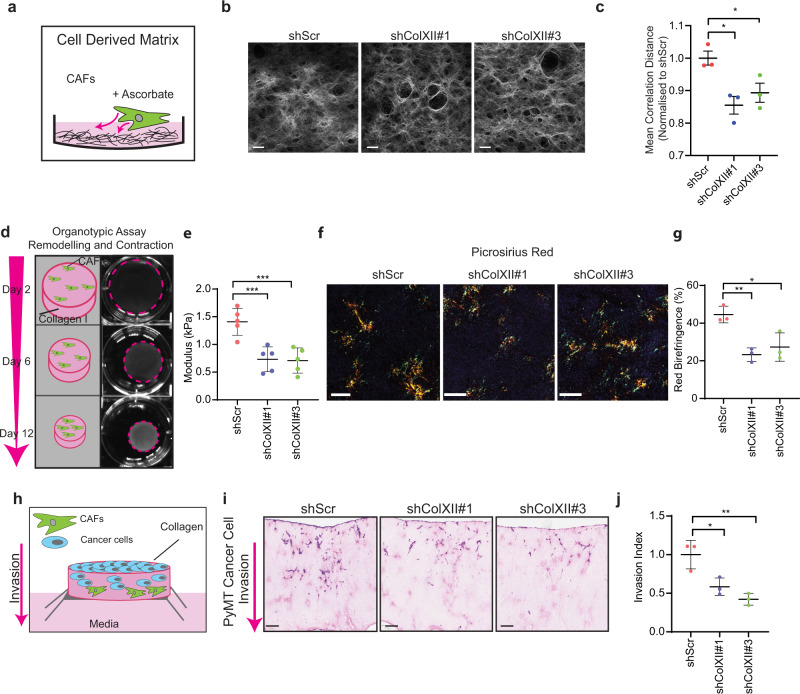
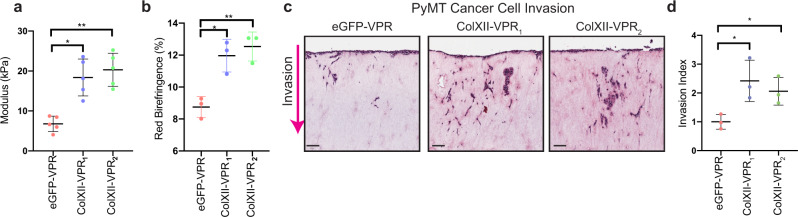
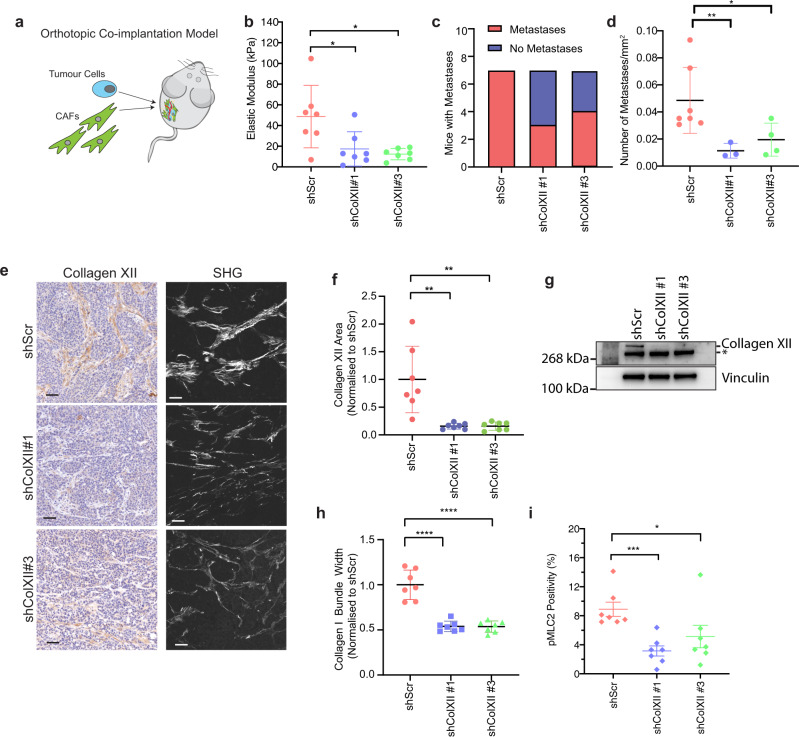
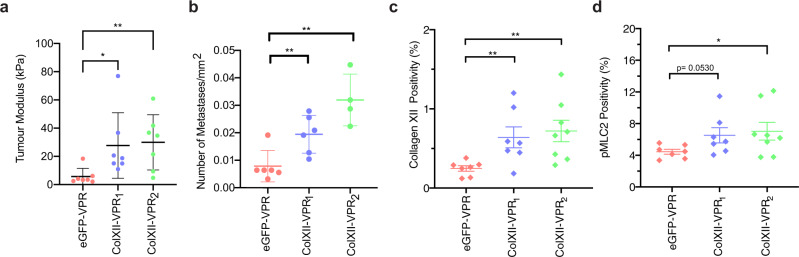
The tumour stroma, and in particular the extracellular matrix (ECM), is a salient feature of solid tumours that plays a crucial role in shaping their progression. Many desmoplastic tumours including breast cancer involve the significant accumulation of type I collagen. However, recently it has become clear that the precise distribution and organisation of matrix molecules such as collagen I is equally as important in the tumour as their abundance. Cancer-associated fibroblasts (CAFs) coexist within breast cancer tissues and play both pro- and anti-tumourigenic roles through remodelling the ECM. Here, using temporal proteomic profiling of decellularized tumours, we interrogate the evolving matrisome during breast cancer progression. We identify 4 key matrisomal clusters, and pinpoint collagen type XII as a critical component that regulates collagen type I organisation. Through combining our proteomics with single-cell transcriptomics, and genetic manipulation models, we show how CAF-secreted collagen XII alters collagen I organisation to create a pro-invasive microenvironment supporting metastatic dissemination. Finally, we show in patient cohorts that collagen XII may represent an indicator of breast cancer patients at high risk of metastatic relapse.


Conflict of interest statement

The authors declare no competing interests.

Figures

Fig. 1
Fig. 1. Proteomic profiling of decellularized breast tumours reveals dynamic changes in the matrisome.
a Histological images (H&E) of mammary tumours and age-matched healthy fatpads from early (8–10 weeks), mid (11–13 weeks) and late (14–16 weeks) stages (scale bar = 200 µm). Representative images of n = 4 mice for the tumour group at mid stage and n = 5 mice for all other groups. b Decell label-free quantitative liquid chromatography-tandem proteomic mass spectrometry (LC-MS/MS) workflow. c Breakdown of matrisome classes detected in tumours and matched healthy fatpads identified by LC-MS/MS. d Principal component analysis (PCA) biplot of tumour and matched healthy fatpad matrisome data. e Temporal profiling of mammary tumours and matched healthy fatpad matrisome. (left) Two-dimensional unsupervised hierarchical clustering of tumours and matched healthy fatpad by Euclidean distance demonstrating 4 clusters (C1–C4) with corresponding profile plot beside each cluster (log2 transformed, median-centred z-score of protein abundance values from proteins present in at least 70% of all samples, median of replicate samples from each condition n = 4–5). (right) Representative example proteins and corresponding matrisome subcategories. Differentially abundant proteins in LC-MS/MS were determined by multi-sample ANOVA (FDR = 0.05). All data derived from n = 4 mice for the tumour group at mid stage and n = 5 mice for all other groups. Source data are provided in the Source data file.
Fig. 2
Fig. 2. Collagen XII is upregulated in breast tumours as the disease progresses.
a Volcano plot of differentially abundant matrisome proteins from LC-MS/MS in matched healthy fatpad or mammary tumour at the early, mid or late stages highlighting collagen XII elevation in mammary tumours at each stage. Multi-sample t test with FDR correction. Data derived from n = 4 mice for the tumour group at mid stage and n = 5 mice for all other groups. b Collagen XII protein abundance in tumour and matched healthy fatpad tissue, quantified by LC-MS/MS (log2 transformed, median centred, collagen XII was detected in n = 25 of 30 samples corresponding to tissue samples from n = 3 mice in the healthy early stage group, n = 4 mice in the healthy mid, tumour mid and tumour late stage groups and n = 5 mice from the healthy late and tumour early stage groups). ***p = 0.0003, ****p < 0.0001 One-way ANOVA with Holm–Sidak multiple comparison test. Data are presented as mean ± SD. c Temporal profile of collagen XII protein expression in healthy fatpad and primary tumours via western blot. Representative of n = 3 biologically independent samples. d Quantification of collagen XII immunohistochemistry (IHC) staining of staged tumours and matched healthy fatpad tissue. Average of 5× fields of view per tumour in n = 4 mice per group. *p = 0.029 Mann–Whitney U-test (two-sided). Data are presented as mean ± SD. e Representative histological images of collagen XII staining quantified in d). Scale bar = 50 µm from n = 4 biologically independent samples. Source data are provided in the Source data file.
Fig. 3
Fig. 3. Collagen XII abundance is associated with altered fibrillar collagen architecture and tumour stiffness.
a Quantification of total picrosirius red stained area in tumour and healthy fatpad tissues. n = 4 tissues; *p = 0.023, **p = 0.0022, ****p < 0.0001; two-way ANOVA with Tukey’s multiple comparison test. Mean ± SD presented. b Representative images of serial histological sections from n = 4 mammary tumour tissues stained for fibrillar collagen (picrosirius red), and collagen XII by IHC (scale bar = 50 µm). c Unconfined compression analysis of n = 4 tumours and healthy fatpads (mean ± SD, n = 4. ****p < 0.0001, ns = not statistically significant; early healthy vs. early tumour p = 0.37; mid healthy vs. mid tumour p = 0.051; two-way ANOVA with Tukey’s multiple comparison test. d Correlation between collagen XII protein abundance (LC-MS/MS) and bulk modulus of primary tissues (Pearson correlation test, r = 0.936, p < 0.0001; n = 24 tissues). e Representative single-plane images of second harmonic generation (SHG) signal acquired from n = 4 tumours and healthy fatpad tissues at early, mid and late stages (scale bar = 40 µm). f Quantification of peak SHG multi-photon signal. n = 4 tissues per group; *p = 0.017, ns = not statistically significant: early healthy vs. early tumour p = 0.58; mid healthy vs. mid tumour p = 0.57. Two-way ANOVA with Tukey’s multiple comparison test. g Representative single-plane images of SHG multi-photon images acquired from n = 4 late-stage tumours and healthy fatpad tissues (scale bar = 15 µm). h Quantification of collagen I fibre bundle width in images from g. Mean ± SD of n = 4 tissues per group; **p = 0.0032, ***p = 0.0006, ****p < 0.0001, ns: p = 0.083; two-way ANOVA with Tukey’s multiple comparison test. i Quantification of collagen I fibril orientation peak to baseline ratio. Mean ± SD, n = 4 tissues per group; **p < 0.01, ***p < 0.001, ns: p = 0.89; mid healthy vs. mid tumour p = 0.0025, late healthy vs. late tumour p = 0.0001, early tumour vs. late tumour p = 0.0042; two-way ANOVA with Tukey’s multiple comparison test. j Representative images of fibril-orientation analysis for collagen I fibres in n = 4 tissues (scale bar = 40 µm). Collagen I fibril orientation distribution for k staged healthy fatpad and l tumour (±SEM, n = 4) corresponding to analysis in i. Source data are provided in the Source data file.
Fig. 4
Fig. 4. Collagen XII expression is associated with poor prognosis in human breast cancer.
a COL12A1 expression in human non-tumour mammary tissue (n = 98) or primary tumour (n = 1080) from ‘The Cancer Genome Atlas’ (TCGA) breast adenocarcinoma cohort (BRCA) (Median and interquartile range, p value determined by two-sided Mann-Whitney test (****p < 0.0001 Mann–Whitney U-test). b Kaplan–Meier overall survival and c progression-free survival analysis of collagen XII stratified (tertiles) breast cancer patients from TCGA BRCA dataset (n = 1067). Univariate Cox Proportional Hazards Model hazard ratio (HR), HR 95% confidence interval and p value for collagen XII high vs low are indicated. d Representative collagen XII IHC-stained TMA sections from triple-negative human breast cancer (TNBC) cohort of n = 150 patients (scale bar = 100 µm). e Kaplan–Meier analysis of disease-specific survival and f distant recurrence from TNBC TMA sections, median-stratified by % stromal collagen XII staining (n = 150, 3 TMA cores per patient). Univariate Cox Proportional Hazards Model hazard ratio (HR), HR 95% confidence interval and p value for collagen XII high vs low are indicated. Source data are provided in the Source data file.
Fig. 5
Fig. 5. Collagen XII is produced by cancer-associated fibroblasts in mouse and human breast tumours.
a UMAP visualisation and clustering of 11,490 cells analysed by single-cell RNA-sequencing from Valdes-Mora et al. of late-stage mammary tumours. b Feature plot and c Violin plot showing the log-normalised expression of Col12a1 over the UMAP structure and clusters as shown in a confirming the source of collagen XII expression. d UMAP visualisation and clustering of 100,064 cells analysed by single-cell RNA-Sequencing from the Breast Cancer Atlas, a study of 26 human primary breast cancers. Cell clusters are labelled by their major lineage annotations for B cells, Plasmablasts, T cells, Myeloid, Cancer epithelial, Normal epithelial, cancer-associated fibroblasts (CAFs), perivascular-like cells (PVL) and endothelial cells. e Feature plot and f Violin plot showing the log-normalised expression of COL12A1 over the UMAP structure and major lineage clusters as shown in d. g Western blot analysis of collagen XII secretion by normal mammary fibroblast (NF) and cancer-associated fibroblasts (CAFs) (*denotes non-specific band). GAPDH is loading control. Representative of n = 3 biologically independent experiments. h Quantification of Col12a1 mRNA expression (n = 3 biologically independent experiments ****p < 0.0001 one-way ANOVA with Tukey’s multiple comparison test) and i collagen XII protein expression (representative of n = 3 biologically independent experiments) in collagen XII knockdown CAF lines generated using collagen XII short-hairpin mRNA scrambled control (shScr) and four collagen XII targeting constructs (shColXII#1–#4) (*denotes non-specific band). Vinculin is loading control. Source data are provided in the Source data file.
Fig. 6
Fig. 6. Collagen XII knockdown modulates fibrillar collagen architecture and inhibits cancer cell invasion.
a Schematic representation of cell-derived extracellular matrix (CDM) secreted by cancer-associated fibroblasts (CAFs). b Representative single-plane images of second harmonic generation (SHG) multi-photon signal of CDMs produced by CAF scrambled control (shScr) and two stable collagen XII knockdown lines (shColXII#1 and #3) from n = 3 biologically independent experiments. c Grey-level co-occurrence matrix (GLCM) analysis of mean correlation distance of collagen I structure in CAF-derived CDMs following collagen XII knockdown. Mean  ± SD, n = 3 biologically independent experiments, *p < 0.05, shScr vs. shColXII#1 p = 0.14; shScr vs. shColXII#3 p = 0.049; One-way ANOVA with Dunnett’s multiple comparisons test. d Schematic representation of 3D organotypic matrix remodelling by fibroblasts (scale bar = 7 mm). Representative of n = 5 biologically independent experiments. e Bulk modulus (stiffness) of organotypic matrices remodelled by control (shScr) or collagen XII knockdown (shColXII#1, shColXII#3) CAFs at day 12 as measured by unconfined compression analysis. Mean ± SD, n = 5 biologically independent experiments, ***p < 0.001, shScr vs. shColXII#1 p = 0.0006; shScr vs. shColXII#3 p = 0.0008; one-way ANOVA with a Dunnett’s multiple comparisons test. f Representative images of birefringence signal from picrosirius-red-stained organotypic matrices generated by control (shScr) or collagen XII knockdown (shColXII#1, shColXII#3) CAFs imaged under polarising light (scale bar = 100 µm) from n = 3 biologically independent experiments. g Quantification of the red birefringence signal area for picrosirius-red-stained organotypic matrices remodelled by control (shScr) or collagen XII knockdown (shColXII#1, shColXII#3) CAFs. Mean ± SD, n = 3 biologically independent experiments, *p = 0.014, **p = 0.0054, one-way ANOVA with a Dunnett’s multiple comparisons test, h Schematic representation of experimental set-up of cancer cell invasion into CAF-remodelled organotypic matrices. i Representative histological images (H&E) (n = 3) of PyMT cancer cell invasion into organotypic matrices remodelled by control (shScr) or collagen XII knockdown (shColXII#1, shColXII#3) CAFs (scale bar = 100 µm). j Quantification of PyMT cancer cell invasive index into organotypic matrices. Mean ± SD, n = 3 biologically independent experiments, *p = 0.020, **p = 0.0042, One-way ANOVA with a Tukey’s multiple comparison test. Source data are provided in the Source data file.
Fig. 7
Fig. 7. Collagen XII overexpression increases tumour stiffness and cancer cell invasion.
a Bulk modulus (stiffness) of organotypic matrices at day 12 remodelled by control (eGFP-VPR) or collagen XII overexpressing (ColXII-VPR1, ColXII-VPR2) CAFs as measured by unconfined compression analysis. Mean ± SD, n = 5 biologically independent experiments, *p = 0.032, **p = 0.0075, Kruskal–Wallis test with Dunn’s multiple comparison test. b Quantification of the red birefringence signal area for picrosirius-red-stained organotypic matrices generated by control (eGFP-VPR) or collagen XII overexpressing (ColXII-VPR1, ColXII-VPR2) CAFs. Mean ± SD, n = 3 biologically independent experiments, *p = 0.034, **p = 0.0078, one-way ANOVA with a Dunnett’s multiple comparisons test. c Representative histological images (H&E) (from n = 3 biologically independent experiments) of cancer cell invasion into organotypic matrices remodelled by control (eGFP-VPR) or collagen XII overexpressing (ColXII-VPR1, ColXII-VPR2) CAFs (scale bar = 100 µm). d Quantification of cancer cell invasive index into organotypic matrices remodelled by control (eGFP-VPR) or collagen XII overexpressing (ColXII-VPR1, ColXII-VPR2) CAFs. Mean ± SD, n = 3 biologically independent experiments, *p < 0.05, eGFP-VPR vs ColXII-VPR1 p = 0.032; eGFP-VPR vs ColXII-VPR2 p = 0.028; One-way ANOVA with a Dunnett’s multiple comparisons test. Source data are provided in the Source data file.
Fig. 8
Fig. 8. Collagen XII knockdown reduces metastasis in vivo.
a Schematic representation of orthotopic co-implantation of cancer cells and CAFs (knockdown study: shScr and shColXII; overexpression study eGFP-VPR and ColXII-VPR) injected in a 1:3 ratio respectively. b Bulk modulus as determined by unconfined compression analysis of excised primary tumours generated by co-implantation of cancer cells with control (shScr) and collagen XII knockdown (shColXII#1, shColXII#3) CAFs. Mean ± SD, n = 7 biologically independent samples, *p < 0.05, shScr vs shColXII#1 p = 0.036, shScr vs. shColXII#3 p = 0.045; Kruskal–Wallis test with Dunn’s multiple comparisons test. c Quantitation of the number of mice with or without observed metastases in H&E sections in the knockdown study (n = 7 mice per group). d Quantification of the mean number of metastases normalised to the total lung area in mice with metastases present in the knockdown study (n = 7 shScr, n = 4 shColXII#1 and n = 3 shColXII#3 mice with metastases present). *p = 0.0278, **p = 0.0062 two-sided t test with Welch’s correction. Data are presented as mean ± SD. e Representative images of (left) collagen XII IHC (scale bar = 50 µm) and (right) multi-photon second harmonic generation signal (scale bar = 40 µm) acquired from n = 7 primary tumours in the knockdown study. f Quantification of collagen XII-positive area in primary tumours from the knockdown study (n = 7 mice per group). **p < 0.01 One-way ANOVA with a Dunnett’s multiple comparisons test. Data are presented as mean ± SD. g Representative western blot of collagen XII expression in primary tumours at endpoint in the knockdown study of n = 2 biologically independent experiments. *Denotes non-specific band. Vinculin is a loading control. h Quantification of collagen I fibre bundle width in primary tumours from the knockdown study. Data are presented as mean ± SD, n = 7 biologically independent experiments, ****p < 0.0001, one-way ANOVA with Dunnett’s multiple comparisons test. i Quantification of pMLC2 staining positivity (% of tumour area) in primary tumours. Data are presented as mean ± SD, n = 7 mice per group; 3 fields of view per tumour, *p = 0.018, ***p = 0.0006, two-sided Mann-Whitney test. Source data are provided in the Source data file.
Fig. 9
Fig. 9. Collagen XII overexpression promotes metastasis in vivo.
a Bulk modulus as determined by unconfined compression analysis of excised primary tumours generated by co-implantation of cancer cells with control (eGFP-VPR) and collagen XII overexpressing (ColXII-VPR1, ColXII-VPR2) CAFs. Data are presented as mean ± SD, n = 7 eGFP-VPR mice, n = 7 ColXII-VPR1 and n = 8 ColXII-VPR2 mice, *p = 0.017, **p = 0.0066, Kruskal–Wallis test with Dunn’s multiple comparisons test. b Quantification of mean number of metastases normalised to the total lung area in mice with metastases present in the overexpression study (n = 6 eGFP-VPR mice, n = 6 ColXII-VPR1 and n = 4 ColXII-VPR2 mice with metastases present). Data are presented as mean ± SD. eGFP-VPR vs. ColXII-VPR1 p = 0.0087; eGFP-VPR vs. ColXII-VPR2 p = 0.0048, two-sided Mann–Whitney U-test. c Quantification of collagen XII-positive area in primary tumours from the overexpression study. n = 7 eGFP-VPR mice, n = 7 ColXII-VPR1 and n = 8 ColXII-VPR2 mice. **p < 0.01, eGFP-VPR vs. ColXII-VPR1 p = 0.0098; eGFP-VPR vs ColXII-VPR2 p = 0.025, two-sided Mann–Whitney U-test. One-way ANOVA with a Dunnett’s multiple comparisons test. Data are presented as mean ± SD. d Quantification of pMLC2 positive area in primary tumours from the overexpression study. n = 7 eGFP-VPR mice, n = 7 ColXII-VPR1 and n = 8 ColXII-VPR2 mice. *p = 0.04, two-sided Mann–Whitney U-test. Data are presented as mean ± SD. Source data are provided in the Source data file.

References

    1. Cox TR. The matrix in cancer. Nat. Rev. Cancer. 2021;21:217–238. doi: 10.1038/s41568-020-00329-7. - DOI - PubMed
    1. Kai F, Drain AP, Weaver VM. The extracellular matrix modulates the metastatic journey. Dev. Cell. 2019;49:332–346. doi: 10.1016/j.devcel.2019.03.026. - DOI - PMC - PubMed
    1. Tian C, et al. Cancer cell-derived matrisome proteins promote metastasis in pancreatic ductal adenocarcinoma. Cancer Res. 2020;80:1461–1474. doi: 10.1158/0008-5472.CAN-19-2578. - DOI - PMC - PubMed
    1. Hebert JD, et al. Proteomic profiling of the ECM of xenograft breast cancer metastases in different organs reveals distinct metastatic niches. Cancer Res. 2020;80:1475–1485. doi: 10.1158/0008-5472.CAN-19-2961. - DOI - PMC - PubMed
    1. Cox TR, Erler JT. Remodeling and homeostasis of the extracellular matrix: implications for fibrotic diseases and cancer. Dis. Model. Mech. 2011;4:165–178. doi: 10.1242/dmm.004077. - DOI - PMC - PubMed

Publication types