. 2022 Aug 6;13(1):4597.
doi: 10.1038/s41467-022-32357-2.

Whole blood DNA methylation analysis reveals respiratory environmental traits involved in COVID-19 severity following SARS-CoV-2 infection

Affiliations

Whole blood DNA methylation analysis reveals respiratory environmental traits involved in COVID-19 severity following SARS-CoV-2 infection

Guillermo Barturen et al. Nat Commun. .

Abstract

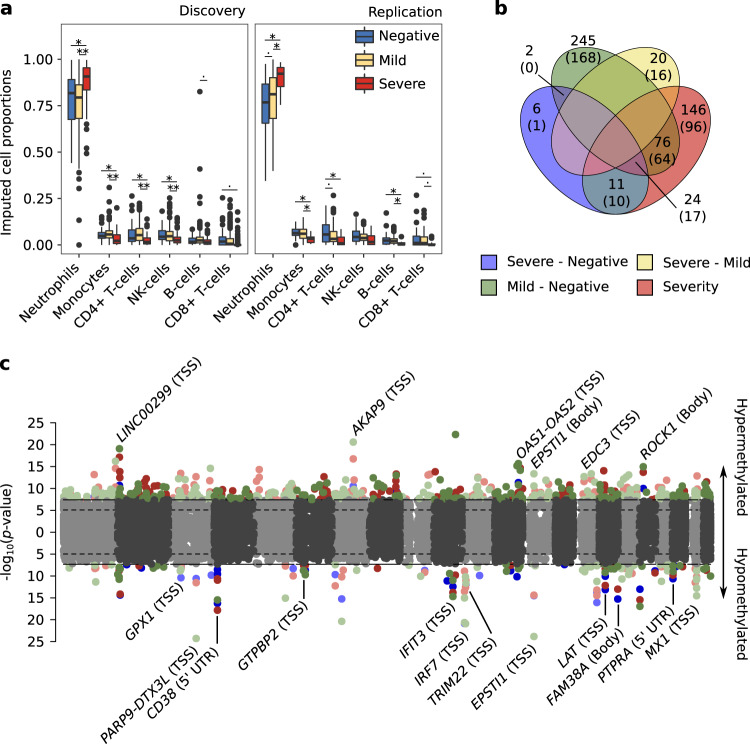
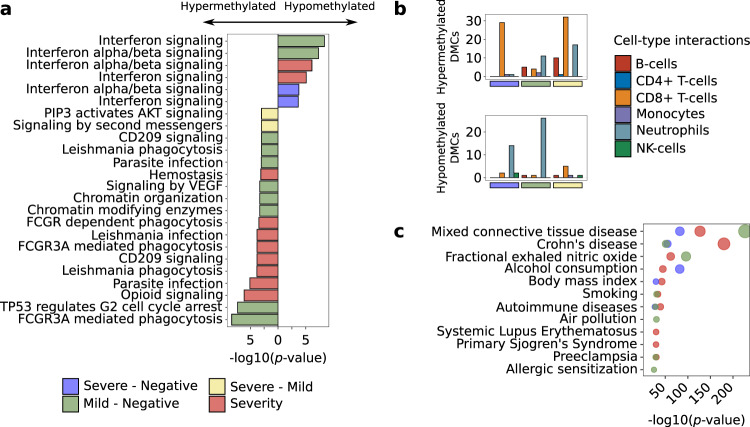
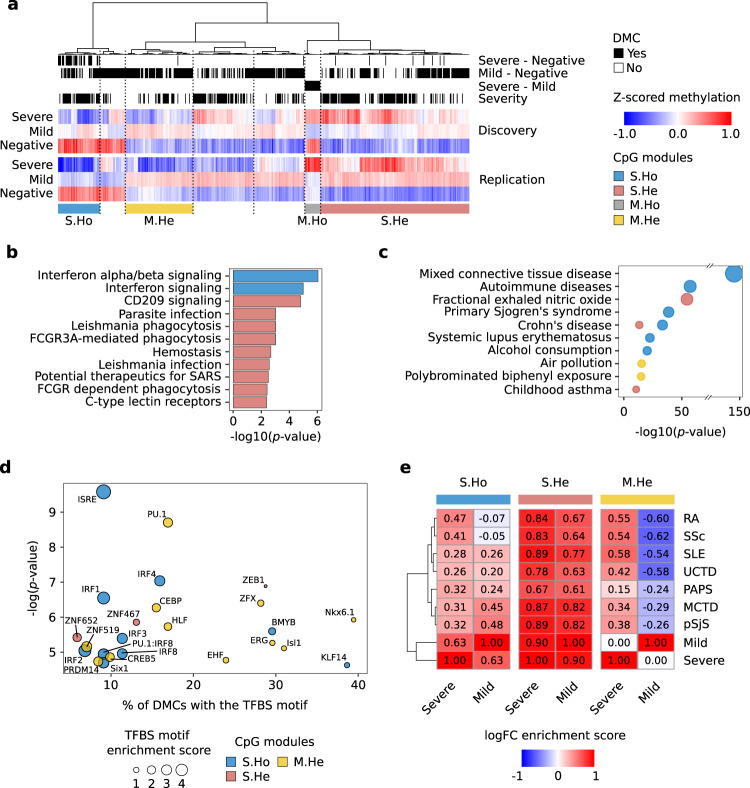
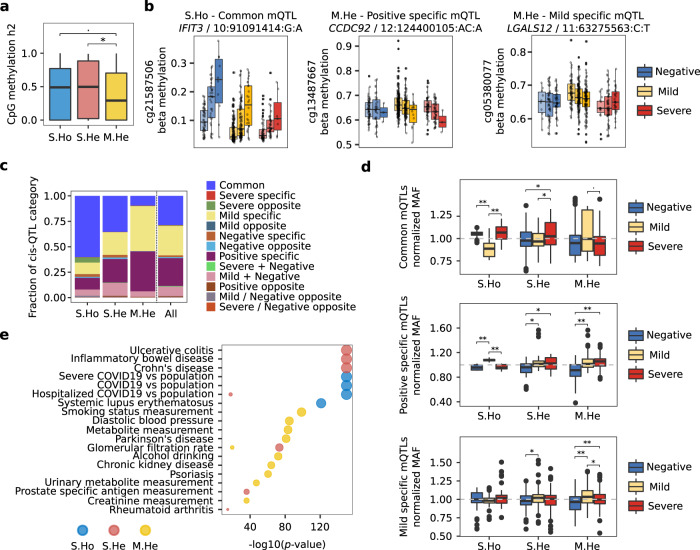
SARS-CoV-2 infection can cause an inflammatory syndrome (COVID-19) leading, in many cases, to bilateral pneumonia, severe dyspnea, and in ~5% of these, death. DNA methylation is known to play an important role in the regulation of the immune processes behind COVID-19 progression, however it has not been studied in depth. In this study, we aim to evaluate the implication of DNA methylation in COVID-19 progression by means of a genome-wide DNA methylation analysis combined with DNA genotyping. The results reveal the existence of epigenomic regulation of functional pathways associated with COVID-19 progression and mediated by genetic loci. We find an environmental trait-related signature that discriminates mild from severe cases and regulates, among other cytokines, IL-6 expression via the transcription factor CEBP. The analyses suggest that an interaction between environmental contribution, genetics, and epigenetics might be playing a role in triggering the cytokine storm described in the most severe cases.


Conflict of interest statement

The authors declare no competing interests.

Figures

Fig. 1
Fig. 1. COVID19 severity correlates with an increase in blood neutrophil proportion and epigenetic changes in genes related with the innate immune response.
a Methylome deconvoluted blood cell proportions are plotted by cohort (left panel discovery, right panel replication) and group (blue, 47 and 54 negative SARS-CoV2 lab tested individuals for discovery and replication; yellow, 269 and 91 positive individuals with mild symptoms for discovery and replication and red, 98 and 15 positive individuals with severe symptoms for discovery and validation). Paired differences were assessed by means of linear regression analysis (age and sex were included as covariates) and significance values plotted by pairs (.p-value < 0.05, *p-value < 0.01 and **p-value < 1e-5). The center line denotes the median value, the box contains 25th to 75th percentiles of the dataset and the whiskers extend up to ± 1.5*IQR. b Venn diagram with the number of significant shared DMCs across the differential analysis performed (the number of annotated genes are included in parentheses). c Combined manhattan plots are shown for the differential analysis that share DMCs, hypermethylated and hypomethylated DMCs are divided into upper and lower side of the manhattan plot respectively. Genes annotated for the shared DMCs are depicted, including, in parentheses their co-localization with the annotated gene (TSS, Transcription Start Site: Body, gene body). Severe vs negative (blue), mild vs negative (green), severe vs mild (yellow) and pseudotime longitudinal analysis (red).
Fig. 2
Fig. 2. COVID19 DNA methylation changes regulate autoimmune related functional pathways and associate with environmental respiratory related traits.
a Top 10 significant reactome database pathways (two-tailed hypergeometric p-value < 0.01) are shown by differential analysis. b Number of DMCs with significant interactions for each deconvoluted cell-type proportion (red, B-cells; blue, CD4 + T-cells; orange, CD8 + T-cells; purple, monocytes; blue, neutrophils and green, NK-cells) are split into hypermethylated (upper panels) and hypomethylated (lower panel) and divided into the differential analysis. c EWAS traits enrichments (two-tailed hypergeometric p-value < 1e-10) for each differential analysis are shown (MethBank database). Severe vs negative (blue), mild vs negative (green), severe vs mild (yellow) and pseudotime longitudinal analysis (red).
Fig. 3
Fig. 3. Epigenetic changes in CpGs associated with environmental respiratory traits differentiate COVID19 progression and mild cases from autoimmune disorders.
a Hierarchical clustering of methylation DMCs for both discovery and replication cohorts (Ward’s hierarchical agglomerative clustering with Pearson correlation as distance is used). Individual methylation values are averaged by severity from severe cases (top), mild cases (middle) to negative lab tested SARS-CoV2 (bottom). The annotations in the upper part of the plot refer to the analysis to which each CpG is differentially methylated (black). Four CpG modules highly replicated between cohorts, were selected from the hierarchical clustering: S.Ho (blue, hypomethylated with the severity), S.He (red, hypermethylated with the severity) and M.He (yellow, hypermethylated in mild compared with severe patients and healthy controls). b Reactome significant pathways by CpG module (two-tailed hypergeometric p-value < 0.01) are shown. c MethBank EWAS trait enrichment by CpG module (two-tailed hypergeometric p-value < 1e-10) are shown. d Significant overrepresentation of transcription factor binding site prediction (HOMER, two-tailed hypergeometric p-value < 0.001) is depicted by CpG module. e Average log2FC Pearson correlations between COVID19 severity groups and seven different systemic autoimmune conditions (SLE Systemic lupus erythematosus, RA Rheumatoid arthritis, pSjS Primary Sjögren’s syndrome, SSc Systemic sclerosis, MCTD Mixed connective tissue disease, PAPs Primary antiphospholipid syndrome, UCTD Undifferentiated connective tissue disease). DMCs are grouped by CpG modules.
Fig. 4
Fig. 4. Genetics contributes differentially to progressive and mild specific DNA methylation changes.
a Genetic contribution in terms of the fraction of the variance explained (heritability, h2) of individual CpG methylation changes is shown by DNA methylation module. Statistical differences are assessed by means of two-tailed Wilcoxon test p-values. b Three significant meQTLs regulating DNA methylation levels are shown divided by severity group and genotype. From left to right, a common meQTL for all three severity groups in the S.Ho module, a positive specific meQTL and a mild specific meQTL for M.He module are depicted. c Fraction of meQTL categories are plotted by module and for all significant DMCs together. d Normalized MAFs for the largest meQTL categories (common meQTLs, positive specific meQTLs and mild specific meQTLs) represented in at least three modules (S.Ho, S.He and M.He) are shown divided by severity group. Two-tailed Wilcoxon test p-values were calculated between severity groups. e Enrichment of GWAS catalog and COVID-19 Host Genetics Initiative associated SNPs are shown by CpG module (two-tailed hypergeometric p-value < 1e-10). MeQTL analyses were performed on 101 negative SARS-CoV2 lab tested individuals, 360 positive individuals with mild symptoms and 113 positive individuals with severe symptoms. In the boxplots, the center line denotes the median value, the box contains 25th to 75th percentiles of the dataset and the whiskers extend up to ± 1.5*IQR. S.Ho module is depicted blue, S.He in red and M.He in yellow. Severe, mild and negative individual groups are colored in red, yellow and blue respectively.

Similar articles

Cited by

References

    1. Guan WJ, et al. Clinical characteristics of coronavirus disease 2019 in China. N. Engl. J. Med. 2020;382:1708–1720. doi: 10.1056/NEJMoa2002032. - DOI - PMC - PubMed
    1. Huang C, et al. Clinical features of patients infected with 2019 novel coronavirus in Wuhan, China. Lancet. 2020;395:497–506. doi: 10.1016/S0140-6736(20)30183-5. - DOI - PMC - PubMed
    1. Bastard, P. et al. Autoantibodies against type I IFNs in patients with life-threatening COVID-19. Science370, 10.1126/science.abd4585 (2020). - PMC - PubMed
    1. Del Valle DM, et al. An inflammatory cytokine signature predicts COVID-19 severity and survival. Nat. Med. 2020;26:1636–1643. doi: 10.1038/s41591-020-1051-9. - DOI - PMC - PubMed
    1. Hadjadj J, et al. Impaired type I interferon activity and inflammatory responses in severe COVID-19 patients. Science. 2020;369:718–724. doi: 10.1126/science.abc6027. - DOI - PMC - PubMed

Publication types