. 2022 Aug 6;79(9):472.
doi: 10.1007/s00018-022-04504-x.

Unspliced XBP1 contributes to cholesterol biosynthesis and tumorigenesis by stabilizing SREBP2 in hepatocellular carcinoma

Affiliations

Unspliced XBP1 contributes to cholesterol biosynthesis and tumorigenesis by stabilizing SREBP2 in hepatocellular carcinoma

Mankun Wei et al. Cell Mol Life Sci. .

Abstract

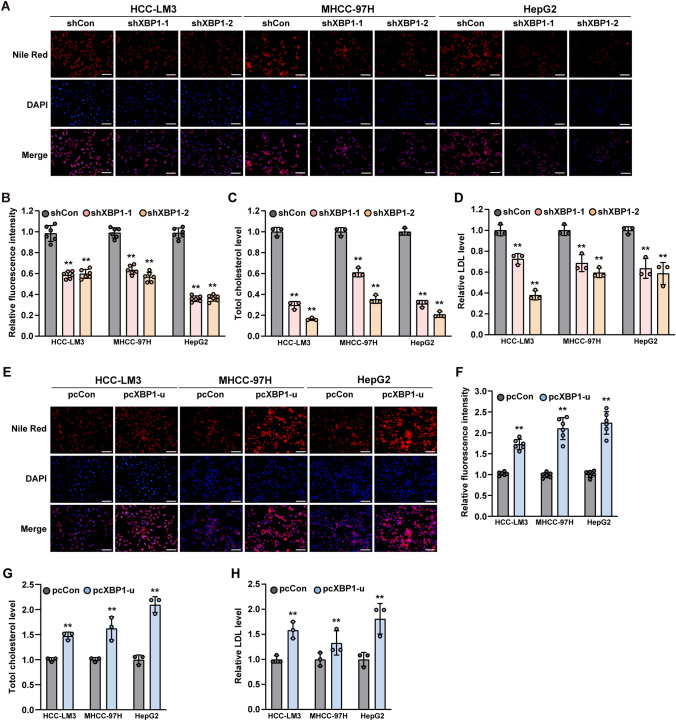
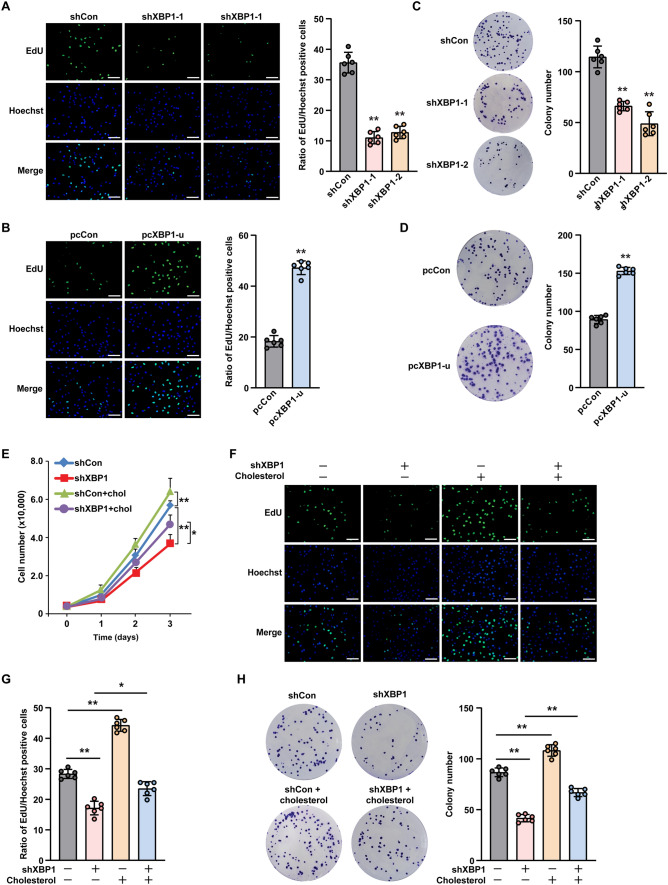
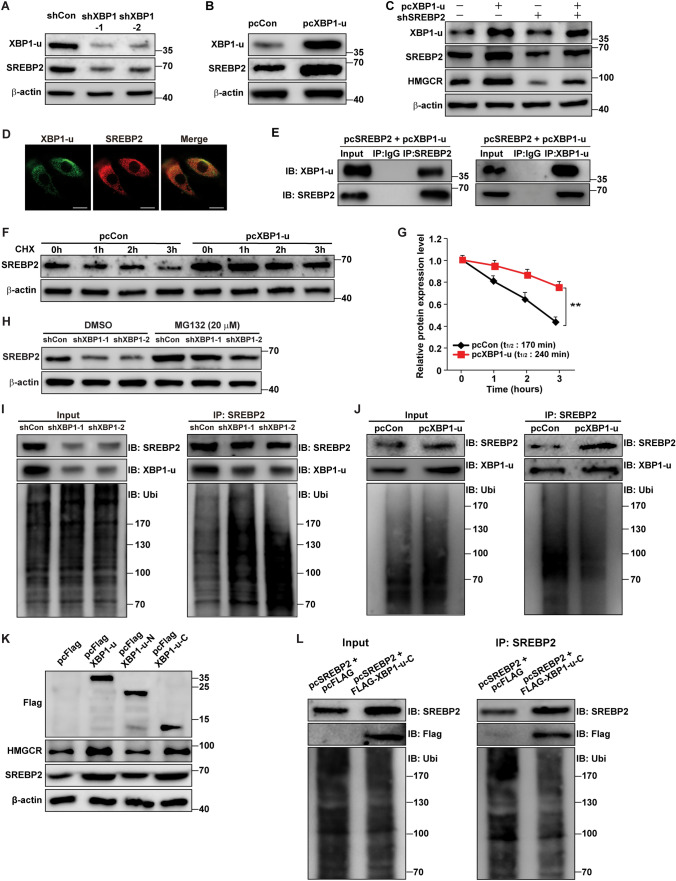
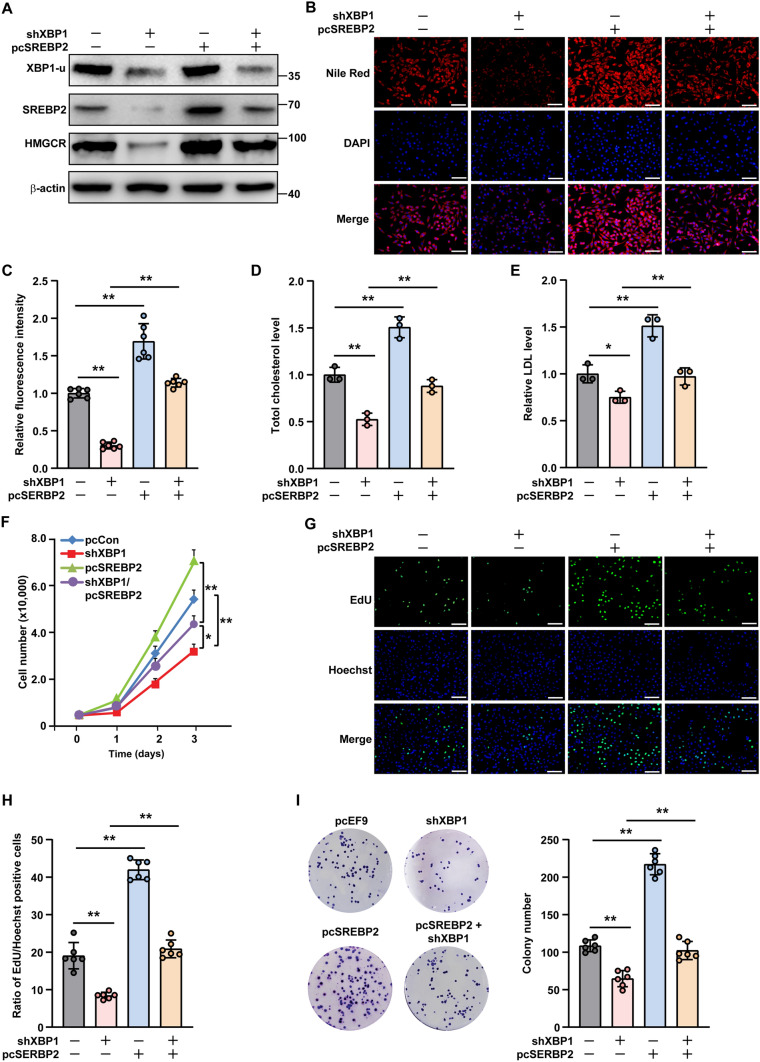
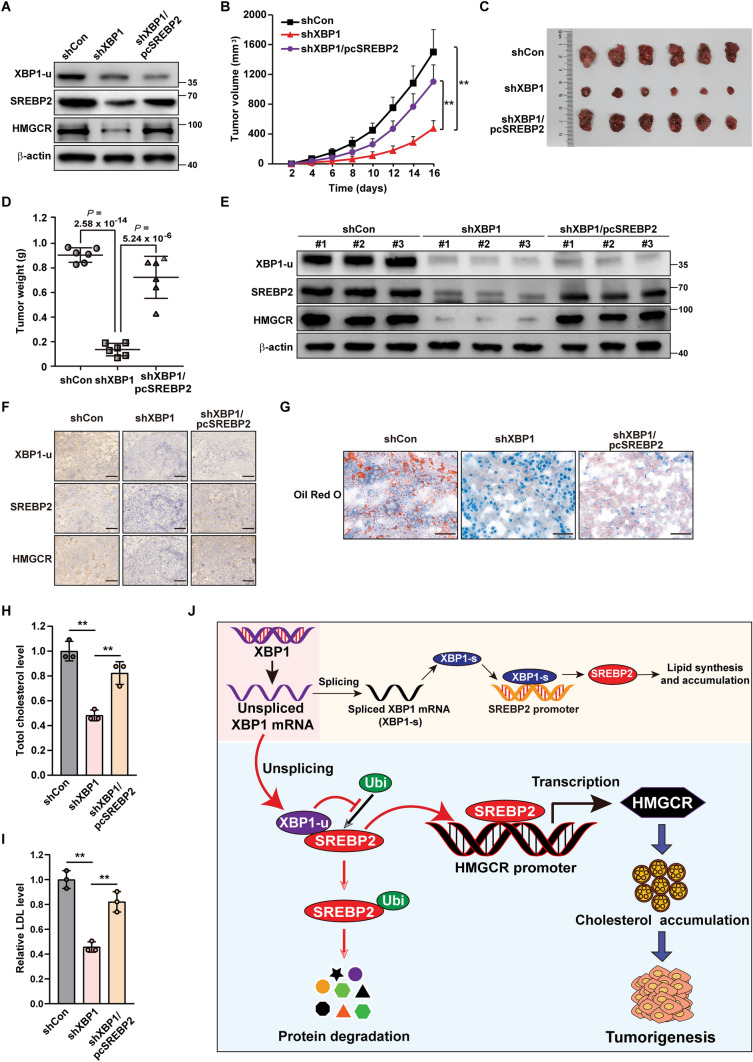
Cholesterol biosynthesis plays a critical role in rapidly proliferating tumor cells. X-box binding protein 1 (XBP1), which was first characterized as a basic leucine zipper-type transcription factor, exists in an unspliced (XBP1-u) and spliced (XBP1-s) form. Recent studies showed that unspliced XBP1 (XBP1-u) has unique biological functions independent from XBP1-s and could promote tumorigenesis; however, whether it is involved in tumor metabolic reprogramming remains unknown. Herein, we found that XBP1-u promotes tumor growth by enhancing cholesterol biosynthesis in hepatocellular carcinoma (HCC) cells. Specifically, XBP1-u colocalizes with sterol regulatory element-binding protein 2 (SREBP2) and inhibits its ubiquitination/proteasomal degradation. The ensuing stabilization of SREBP2 activates the transcription of 3-hydroxy-3-methylglutaryl-CoA reductase (HMGCR), a rate-limiting enzyme in cholesterol biosynthesis. We subsequently show that the XBP1-u/SREBP2/HMGCR axis is crucial for enhancing cholesterol biosynthesis and lipid accumulation as well as tumorigenesis in HCC cells. Taken together, these findings reveal a novel function of XBP1-u in promoting tumorigenesis through increased cholesterol biosynthesis in hepatocarcinoma cells. Hence, XBP1-u might be a potential target for anti-tumor therapeutic strategies that focus on cholesterol metabolism in HCC.

Keywords: Cholesterol biosynthesis; SREBP2; Tumorigenesis; Unspliced XBP1 (XBP1-u); XBP1.


Conflict of interest statement

The authors declare no potential conflicts of interest.

Figures

Fig. 1
Fig. 1
XBP1-u regulates HCC cell cholesterol level. A, B Accumulation of lipid droplets in XBP1-silenced HCC cells, as determined using Nile Red staining. Representative images (A; scale bars: 200 μm) and quantification results (B; n = 6) are shown. C Total cholesterol level in XBP1-silenced HCC-cells. D LDL level in XBP1-silenced HCC-cells. E–F Accumulation of lipid droplets in XBP1-u-overexpressed HCC-cells, as determined using Nile Red staining. Representative images (E; scale bars: 200 μm) and quantification results (F; n = 6) are shown. G. Total cholesterol level in XBP1-u-overexpressed HCC-cells. H LDL level in XBP1-u-overexpressed HCC-cells. Cells transfected with shCon or pcCon were used as controls. Total protein was used for normalization of total cholesterol and LDL levels. Quantification data are shown as mean ± SD (n = 3; unless further indicated). pcCon pcDNA3.1(+); **P < 0.01
Fig. 2
Fig. 2
Cholesterol is crucial for XBP1-u regulation on HCC cell tumorigenic potential. A, B Proliferation potential of XBP1-silenced (A) and XBP1-u-overexpressed (B) HCC-LM3 cells, as determined using EdU-incorporation assay. Representative images (left; scale bars: 200 μm) and ratio of proliferative cells (right; n = 6) are shown. C, D Colony formation potential of XBP1-silenced (C) and XBP1-u-overexpressed (D) HCC-LM3 cells. Representative images (left) and the number of the colonies formed (right; n = 6) are shown. E Viability of XBP1-silenced HCC-LM3 cells treated with cholesterol (final concentration: 10 μg/mL) at indicated time points (n = 3). F, G Proliferation potential of XBP1-silenced HCC-LM3 cells treated with cholesterol (final concentration: 10 μg/mL), as determined using EdU-incorporation assay. Representative images (F; scale bars: 200 μm) and ratio of proliferative cells (G; n = 6) are shown. H Colony formation potential of XBP1-silenced HCC-LM3 cells treated with cholesterol (final concentration: 10 μg/mL). Representative images (left) and the number of the colonies formed (right; n = 6) are shown. Cells transfected with shCon or pcCon were used as controls. Quantification data are shown as mean ± SD. pcCon, pcDNA3.1(+); *P < 0.05; **P < 0.01
Fig. 3
Fig. 3
Inhibition of cholesterol biosynthesis suppresses XBP1-u-mediated HCC cell tumorigenic potential. A Accumulation of lipid droplets in XBP1-u-overexpressed HCC-LM3 cells treated with statin (final concentration: 15 μM), as analyzed using Nile Red staining. Representative images (left; scale bars: 200 μm) and quantification results (right; n = 6) are shown. B, C Total cholesterol (B) and LDL (C) levels in XBP1-u-overexpressed HCC-LM3 cells treated with statin (final concentration: 15 μM). D Viability of XBP1-u-overexpressed HCC-LM3 cells treated with statin at indicated time points (final concentration: 15 μM). E, F Proliferation potential of XBP1-u-overexpressed HCC-LM3 cells treated with statin (final concentration: 15 μM), as determined using EdU-incorporation assay. Representative images (E; scale bars: 200 μm) and ratio of proliferative cells (F; n = 6) are shown. G Colony formation potential of XBP1-u-overexpressed HCC-LM3 cells treated with statin (final concentration: 15 μM). Representative images (left) and the number of the colonies formed (right; n = 6) are shown. Cells transfected with pcDNA3.1(+) and treated with DMSO were used as controls. Quantification data are shown as mean ± SD (n = 3, unless further indicated). *P < 0.05; **P < 0.01
Fig. 4
Fig. 4
XBP1-u regulates HMGCR expression in HCC cells at its transcriptional level. A, B HMGCR mRNA expression level in XBP1-silenced (A) and XBP1-u-overexpressed (B) HCC-LM3, MHCC-97H, and HepG2 cells, as analyzed using qRT-PCR. C, D HMGCR protein expression level in XBP1-silenced (C) and XBP1-u-overexpressed (D) HCC-LM3, MHCC-97H, and HepG2 cells, as analyzed using western blotting. Cells transfected with shCon or pcCon were used as controls. β-actin was used for qRT-PCR normalization and as western blotting loading control. Quantification data are shown as mean ± SD (n = 3). pcCon, pcDNA3.1(+); **P < 0.01
Fig. 5
Fig. 5
HMGCR is crucial for XBP1-u regulation on cholesterol biosynthesis and tumorigenic potential of HCC cells. A Protein expression level of HMGCR in XBP1-silenced, HMGCR-overexpressed HCC-LM3 cells, as analyzed using western blotting. B, C Accumulation of lipid droplets in XBP1-silenced, HMGCR-overexpressed HCC-LM3 cells, as analyzed using Nile Red staining. Representative images (B; scale bars: 200 μm) and quantification results (C; n = 6) are shown. D, E Total cholesterol and LDL levels in XBP1-silenced, HMGCR-overexpressed HCC-LM3 cells. F Viability of XBP1-silenced, HMGCR-overexpressed HCC-LM3 cells at indicated time points. G, H Proliferation potential of XBP1-silenced, HMGCR-overexpressed HCC-LM3 cells, as determined using EdU-incorporation assay. Representative images (G; scale bars: 200 μm) and ratio of proliferative cells (H; n = 6) are shown. I Colony formation potential of XBP1-silenced, HMGCR-overexpressed HCC-LM3 cells. Representative images (left) and the number of the colonies formed (right; n = 6) are shown. Cells transfected with shCon and pcEF9-Puro were used as controls. β-actin was used as western blotting loading control. Total protein was used for normalization of total cholesterol and LDL levels. Quantification data are shown as mean ± SD (n = 3, unless further indicated). *P < 0.05; **P < 0.01
Fig. 6
Fig. 6
XBP1-u stabilizes SREBP2 protein by inhibiting its ubiquitin-proteasomal degradation. A, B SREBP2 protein expression level in XBP1-silenced (A) and XBP1-u-overexpressed (B) HCC-LM3 cells, as analyzed using western blotting. C HMGCR and SREBP2 protein expression levels in SREBP2-silenced, XBP1-u-overexpressed HCC-LM3 cells, as analyzed using western blotting. D Colocalization of endogenous SREBP2 and XBP1-u, as determined by immunofluorescence staining using anti-SREBP2 and anti-XBP1-u antibodies (scale bars: 20 μm). E Physical interaction between XBP1-u and SREBP2, as determined using anti-XBP1-u immunoblotting of cell lysate immunoprecipitated with anti-SREBP2 antibody and vice versa. F, G Degradation rates of SREBP2 protein in XBP1-u-overexpressed HCC-LM3 cells, as analyzed using western blotting at indicated time points after the addition of cycloheximide (final concentration: 200 μg/ml). Western blotting result (F) and the half-life of SREBP2 protein (G) are shown. H SREBP2 protein expression level in XBP1-silenced HCC-LM3 cells treated with MG132 (final concentration: 20 μM) for 8 h, as analyzed using western blotting. I, J SREBP2 ubiquitination levels in HCC-LM3 cells transfected with pcSREBP2, pcUbi, and shXBP1 (I) or pcXBP1-u (J), as analyzed using anti-ubiquitin immunoblotting of cell lysates immunoprecipitated with anti-SREBP2 antibody. K SREBP2 and HMGCR protein expression levels in HCC-LM3 cells transfected with FLAG-XBP1-u, FLAG-XBP1-u-N and FLAG-XBP1-u-C, as determined using western blotting. L SREBP2 ubiquitination level in HCC-LM3 cells transfected with pcFLAG-XBP1-u-C, pcSREBP2, and pcUbi, as analyzed using anti-ubiquitin immunoblotting of cell lysates immunoprecipitated with anti-SREBP2 antibody. Cells transfected with shCon and/or pcCon, or pcFlag, were used as controls. β-actin was used as western blotting loading control. Quantification data are shown as mean ± SD (n = 3). pcCon, pcDNA3.1(+); pcSREBP2: full-length SREBP2 overexpression vector; IB immunoblotting; IP immunoprecipitation; Ubi ubiquitination; **P < 0.01
Fig. 7
Fig. 7
SREBP2 is critical for XBP1-u-induced cholesterol biosynthesis and tumorigenic potential of HCC cells. A Protein expression levels of SREBP2 and HMGCR in XBP1-silenced, SREBP2-overexpressed HCC-LM3 cells, as analyzed using western blotting. B, C Accumulation of lipid droplets in XBP1-silenced, SREBP2-overexpressed HCC-LM3 cells, as analyzed using Nile Red staining. Representative images (B; scale bars: 200 μm) and quantification results (C; n = 6) are shown. D, E Total cholesterol (D) and LDL (E) levels in XBP1-silenced, SREBP2-overexpressed HCC-LM3 cells overexpressing SREBP2. F Viability of XBP1-silenced, SREBP2-overexpressed HCC-LM3 cells at indicated time points. G, H Proliferation potential of XBP1-silenced, SREBP2-overexpressed HCC-LM3 cells, as determined using EdU-incorporation assay. Representative images (G; scale bars: 200 μm) and ratio of proliferative cells (H; n = 6) are shown. I Colony formation potential of XBP1-silenced, SREBP2-overexpressed HCC-LM3 cells. Representative images (left) and numbers of the colonies formed (right; n = 6) are shown. Cells transfected with shCon and pcEF9-Puro were used as controls. β-actin was used as western blotting loading control. Total protein was used for normalization of total cholesterol and LDL levels. Quantification data are shown as mean ± SD (n = 3, unless further indicated). pcSREBP2 full-length SREBP2 overexpression vector; *P < 0.05; **P < 0.01
Fig. 8
Fig. 8
XBP1-u mediates hepatocarcinogenesis potential by positively regulates SREBP2. A Protein expression levels of SREBP2 and HMGCR in HCC-LM3/shCon (shCon), HCC-LM3/shXBP1 (shXBP1) and HCC/shXBP1/pcSREBP2 (shXBP1/pcSREBP2) cells, as analyzed using western blotting. B–D Tumorigenesis potentials of HCC-LM3/shCon, HCC-LM3/shXBP1, and HCC-LM3/shXBP1/pcSREBP2 cells, as determined in vivo by subcutaneous injection of these cells into Balb/c-nu/nu mice (n = 6). Tumor volumes at the indicated time points (B), morphological images (C) and tumor weight (D) at day 16 after transplantation are shown. E XBP1-u, SREBP2, and HMGCR protein expression levels in the xenografted tumors formed by the indicated cells, as determined using western blotting. F Immunohistochemistry staining using anti-SREBP2, anti-XBP1-u, and anti-HMGCR antibodies showing the expression levels of SREBP2, XBP1-u, and HMGCR in tissue sections of xenografted tumors in BALB/c-nu/nu mice injected with the indicated cell lines (scale bars: 50 μm). G Accumulation of lipid droplets in the tissue section of xenografted tumors in BALB/c-nu/nu mice injected with the indicated cell lines (scale bars: 50 μm). H, I Total cholesterol (H) and LDL (I) levels in the xenografted tumors in BALB/c-nu/nu mice injected with the indicated cell lines (n = 3). J Schematic diagram showing the mechanism of XBP1-u regulation on the SREBP2/HMGCR axis. β-actin was used as western blotting loading control. Quantification data are shown as mean ± SD. **P < 0.01

Similar articles

Cited by

References

    1. Hanahan D, Weinberg RA. The hallmarks of cancer. Cell. 2000;100(1):57–70. doi: 10.1016/S0092-8674(00)81683-9. - DOI - PubMed
    1. Hanahan D, Weinberg RA. Hallmarks of cancer: the next generation. Cell. 2011;144(5):646–674. doi: 10.1016/j.cell.2011.02.013. - DOI - PubMed
    1. Li Y, Kasim V, Yan X, Li L, Meliala ITS, Huang C, Li Z, Lei K, Song G, Zheng XJT. Yin Yang 1 facilitates hepatocellular carcinoma cell lipid metabolism and tumor progression by inhibiting PGC-1β-induced fatty acid oxidation. Theranostics. 2019;9(25):7599. doi: 10.7150/thno.34931. - DOI - PMC - PubMed
    1. Huang B, Song BL, Xu C. Cholesterol metabolism in cancer: mechanisms and therapeutic opportunities. Nat metab. 2020;2(2):132–141. doi: 10.1038/s42255-020-0174-0. - DOI - PubMed
    1. Russell DW. Nuclear orphan receptors control cholesterol catabolism. Cell. 1999;97(5):539–542. doi: 10.1016/S0092-8674(00)80763-1. - DOI - PubMed

MeSH terms