. 2022 Aug 6;8(1):27.
doi: 10.1038/s41540-022-00238-5.

Unraveling the effect of intra- and intercellular processes on acetaminophen-induced liver injury

Affiliations

Unraveling the effect of intra- and intercellular processes on acetaminophen-induced liver injury

M M Heldring et al. NPJ Syst Biol Appl. .

Abstract

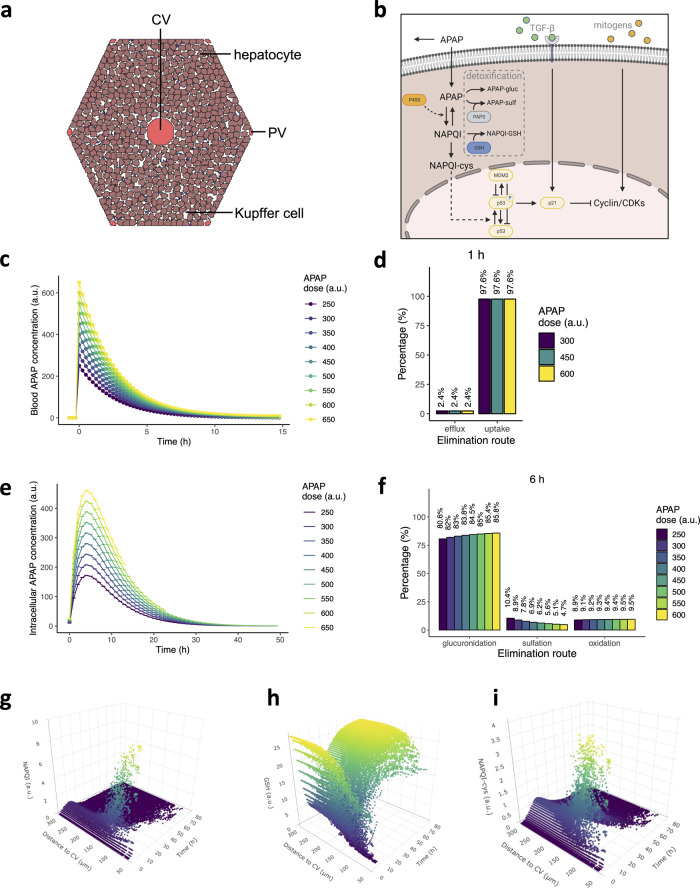
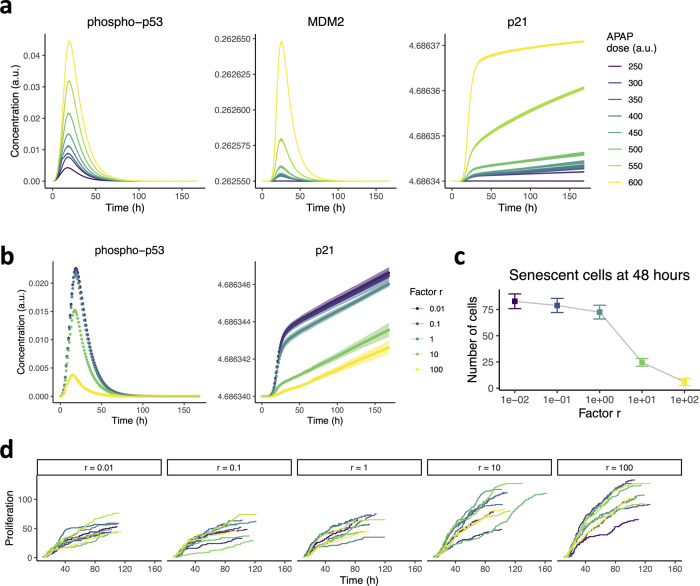
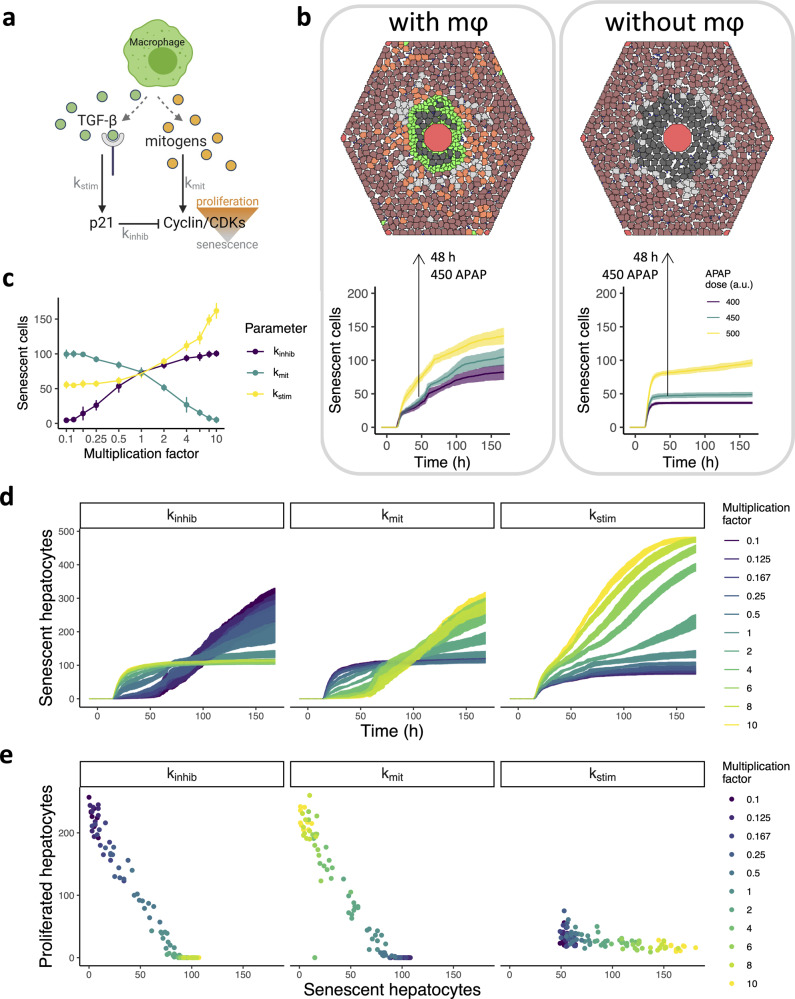
In high dosages, acetaminophen (APAP) can cause severe liver damage, but susceptibility to liver failure varies across individuals and is influenced by factors such as health status. Because APAP-induced liver injury and recovery is regulated by an intricate system of intra- and extracellular molecular signaling, we here aim to quantify the importance of specific modules in determining the outcome after an APAP insult and of potential targets for therapies that mitigate adversity. For this purpose, we integrated hepatocellular acetaminophen metabolism, DNA damage response induction and cell fate into a multiscale mechanistic liver lobule model which involves various cell types, such as hepatocytes, residential Kupffer cells and macrophages. Our model simulations show that zonal differences in metabolism and detoxification efficiency are essential determinants of necrotic damage. Moreover, the extent of senescence, which is regulated by intracellular processes and triggered by extracellular signaling, influences the potential to recover. In silico therapies at early and late time points after APAP insult indicated that prevention of necrotic damage is most beneficial for recovery, whereas interference with regulation of senescence promotes regeneration in a less pronounced way.


Conflict of interest statement

The authors declare no competing interests.

Figures

Fig. 1
Fig. 1. In silico simulations of one liver lobule that accurately describe APAP metabolism in hepatocytes.
a Initial state of the spatial model structure of one lobule, with the central vein (CV) and six portal veins (PVs). The brown cells are hepatocytes, and the small blue cells represent Kupffer cells (KCs). Empty, white space represents other non-parenchymal cells, such as sinusoidal epithelial cells and stellate cells, and intercellular spaces. b Representation of modeled APAP metabolism, DNA damage response activation mediated by p53, and regulation of cyclin/cyclin-dependent kinases (CDKs) through p21 and mitogenic signaling. Note that we did not explicitly include all components involved in the modeled interactions; for example, we omitted mitochondrial damage inflicted by NAPQI-cys and consequent release of endonucleases, leading to DNA fragmentation. Figure created with BioRender. c APAP concentration in the blood plasma over time for different starting concentrations. d Percentage of APAP that is excreted as unmodified compound or taken up by hepatocytes at t = 1 h after exposure. e Hepatocellular APAP concentration over time for different initial APAP concentrations. f Percentages of APAP in each elimination route at 6 h after exposure. g–i NAPQI (g), GSH (h) and NAPQI-cys (i) concentration as function of distance from the central vein and time after exposure for an initial APAP concentration of 450. Pericentral necrotic cell death and recovery is noticeable from the absence and reappearance of data points in the area with low distance from the CV. Note that simulations were performed at different starting APAP concentrations with ten repeats per condition (represented as mean ± sd), yet in cf there is no variability between simulations per condition due to the deterministic character of the intracellular dynamics. a.u., arbitrary units.
Fig. 2
Fig. 2. In silico simulations match experimental observations of damage and recovery and predict a threshold concentration beyond which recovery does not occur.
a Representation of hepatic cell state transitions and intercellular signaling in our model. Healthy hepatocytes can proliferate, become senescent or necrotic. Necrotic hepatocytes activate resident Kupffer cells (KCs) through production of DAMPs. KCs excrete MCP-1 to recruit macrophages that produce TGF-β and mitogens to stimulate senescence or proliferation of healthy hepatocytes, respectively. Figure created with BioRender. b Reference timeline for key processes in liver tissue following exposure to an intermediate APAP concentration (~400 mg/kg), based on indicated literature. Figure created with BioRender. c Timing of necrosis onset, defined as the time point at which the first necrotic hepatocytes appeared, after exposure to different APAP concentrations. Due to the deterministic character of the intracellular dynamics, there is no variation between different simulations per condition. d Counts of healthy (purple), necrotic (green) and senescent (yellow) hepatocytes and macrophages (blue) over time after exposure to different APAP concentrations. The gray dashed line represents the total number of alive hepatocytes, i.e., the sum of healthy and senescent hepatocytes. e Proportion of healthy or senescent cells and the total of healthy and senescent cells, at day 7 after exposure to different APAP concentrations. f Stills of model simulation at different time points in hours (columns) and initial APAP concentrations (rows). Brown, healthy hepatocytes; red, CV and PVs; black, necrotic hepatocytes; gray, senescent hepatocytes; green, macrophages; orange, proliferated hepatocytes; blue, Kupffer cells. Results are based on 10 simulations per condition represented as mean ± sd. a.u., arbitrary units.
Fig. 3
Fig. 3. The effect of zonal expression of GSH and P450 on adverse outcome.
a Illustration of four different in silico zonation scenarios. Figure created with BioRender. bd The dependence of the number of necrotic hepatocytes at 14 h after exposure (b), of the number of senescent hepatocytes at 48 h after exposure (c), and of the number of necrotic hepatocytes at 168 h (7 days) after exposure (d) on applied APAP concentration. Results are based on ten simulations per condition represented as mean ± sd.
Fig. 4
Fig. 4. Suppression of DNA damage signaling increases regeneration capacity after APAP insult.
a Protein expression of phospho-p53, MDM2 and p21 over time after exposure to various APAP concentrations. Due to the deterministic character of the intracellular dynamics, there is very little variation between different simulations per condition. b Protein expression of phospho-p53 and p21 over time under different feedback strengths of MDM2 on p53 after exposure to 500 APAP. Factor r is the multiplication factor used to scale the MDM2 feedback on p53 and phospho-p53 up or down. Due to the deterministic character of the intracellular dynamics, there is only little variation between different simulations per condition. c, d The number of senescent cells at 48 h (c) and cumulative hepatocyte proliferation events (d) after 500 APAP exposure at different MDM2-p53 feedback strengths. Results are based on ten simulations per condition represented as mean ± sd. a.u., arbitrary units.
Fig. 5
Fig. 5. The effect of macrophage-related parameters on senescence and proliferation.
a Illustration of the reactions and relevant parameters of our model that regulate senescence or proliferation through the cyclin/CDK complex concentration. Macrophages produce TGF-β that stimulate p21 with strength kstim. The strength of cyclin/CDK inhibition by p21 is regulated by kinhib. Macrophage-derived mitogens stimulate cyclin/CDKs with strength kmit. Figure created with BioRender. b Bottom panels: The number of senescent cells over time in simulations with and without macrophages after exposure to three APAP concentrations. Top panels: Two stills taken from representative simulations are shown for time point 48 h. Brown, healthy hepatocytes; blue, KCs; red, CV and PVs; black, necrotic hepatocytes; gray, senescent hepatocytes; green, macrophages. c The effect of changes in parameter values on the number of senescent cells at time point 48 h after 500 APAP exposure. Multiplication factors were used to scale the strength of the indicated regulatory reactions up or down. d Temporal dynamics of the number of senescent hepatocytes following changes in parameter values through multiplication with different scalars after 500 APAP exposure. e Relation between the amount of proliferation and senescence events following changes in parameter values through multiplication with different scalars after 500 APAP exposure. Results are based on 10 simulations per condition represented as mean ± sd.
Fig. 6
Fig. 6. In silico predictions for the effect of four therapies administered at 3, 6, 12, 18, 24, or 48 h on APAP-induced liver injury and recovery.
ad Graphical representation (top panels) and simulations (bottom panels) of the intracellular effect of (a) NAC on GSH concentration, (b) 4MP on NAPQI-cys abundance, (c) pifithrin-α on phospho-p53 concentration and (d) of the effect of KC depletion by clodronate on the number of macrophages. Top panels created with BioRender. eh Effect of (e) NAC, (f) 4MP, (g) pifithrin-α and (h) clodronate therapies on the healthy, necrotic and senescent cell populations measured at 24 h (top panels) or 168 h (bottom panels). Dotted colored lines indicate simulation results without treatment. Results are based on ten simulations per condition represented as mean ± sd. a.u., arbitrary units.

Similar articles

Cited by

References

    1. Rubin JB, et al. Acetaminophen-induced Acute Liver Failure Is More Common and More Severe in Women. Clin. Gastroenterol. Hepatol. 2018;16:936–946. doi: 10.1016/j.cgh.2017.11.042. - DOI - PMC - PubMed
    1. Mohar I, et al. Acetaminophen-induced liver damage in mice is associated with gender-specific adduction of peroxiredoxin-6. Redox Biol. 2014;2:377–387. doi: 10.1016/j.redox.2014.01.008. - DOI - PMC - PubMed
    1. Sheng Y, Liang Q, Deng Z, Ji L, Wang Z. Acetaminophen induced gender-dependent liver injury and the involvement of GCL and GPx. Drug Discov. Ther. 2013;7:78–83. - PubMed
    1. Kane AE, et al. Acetaminophen hepatotoxicity in mice: Effect of age, frailty and exposure type. Exp. Gerontol. 2016;73:95–106. doi: 10.1016/j.exger.2015.11.013. - DOI - PMC - PubMed
    1. Mitchell SJ, Kane AE, Hilmer SN. Age-related changes in the hepatic pharmacology and toxicology of paracetamol. Curr. Gerontol. Geriatr. Res. 2011;2011:624156. doi: 10.1155/2011/624156. - DOI - PMC - PubMed

Publication types