. 2022 Aug 6;8(1):99.
doi: 10.1038/s41531-022-00363-2.

Elevation of gangliosides in four brain regions from Parkinson's disease patients with a GBA mutation

Affiliations

Elevation of gangliosides in four brain regions from Parkinson's disease patients with a GBA mutation

Shani Blumenreich et al. NPJ Parkinsons Dis. .

Abstract

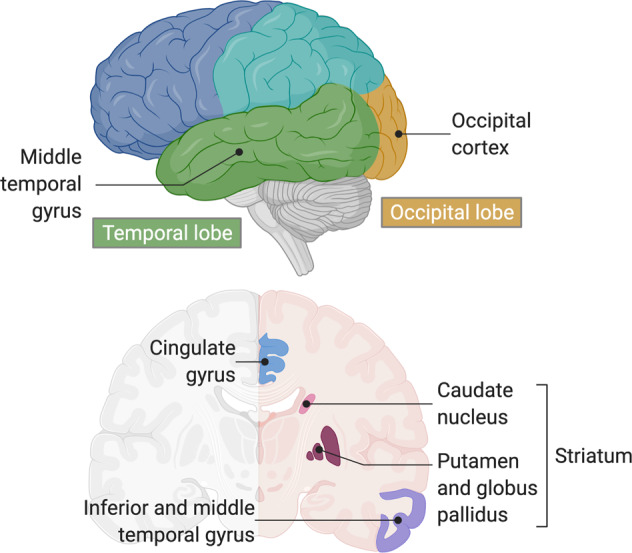
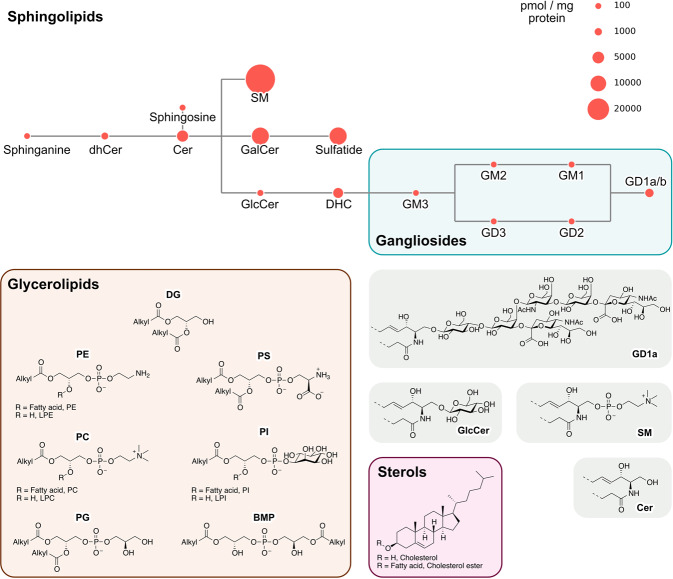
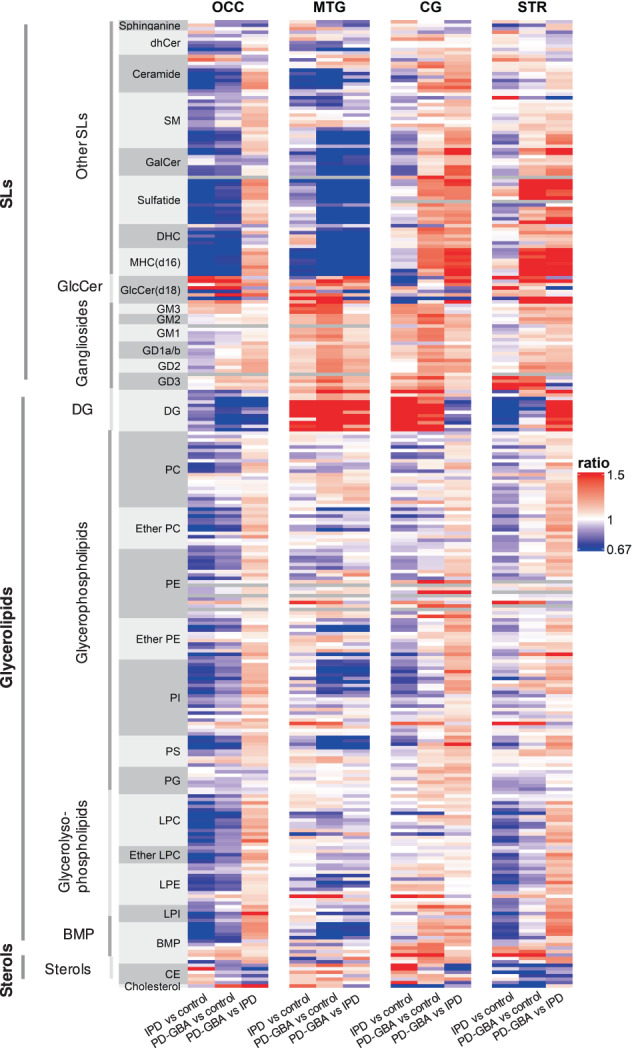
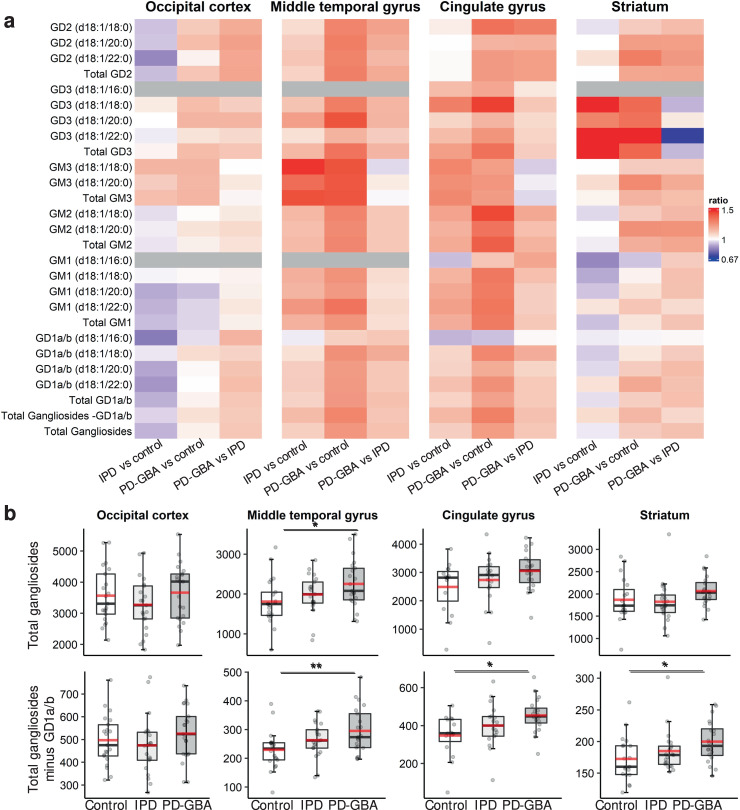
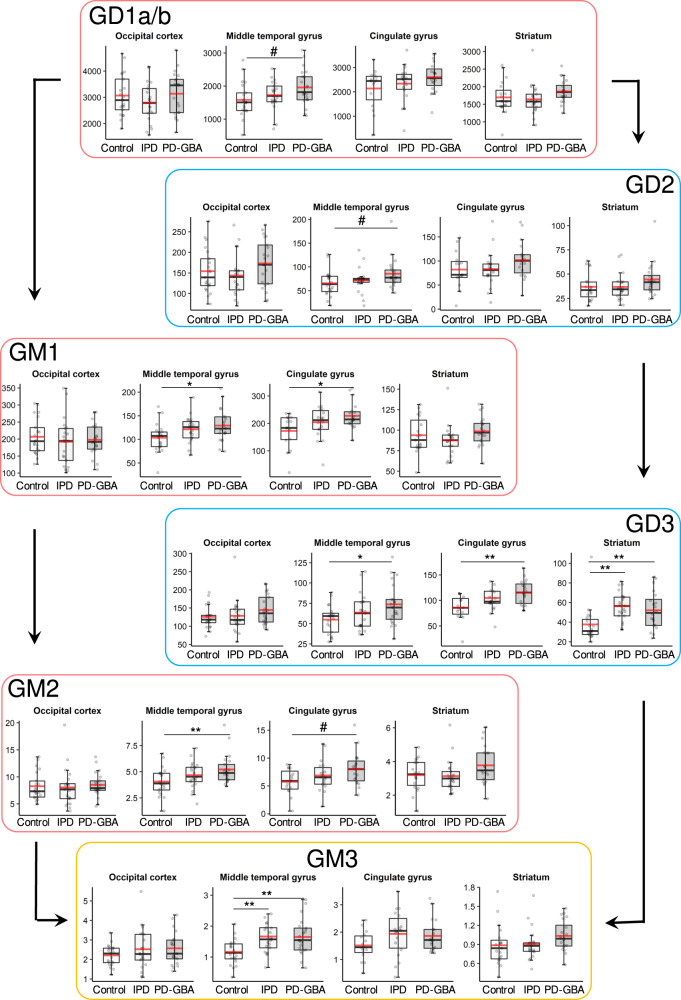
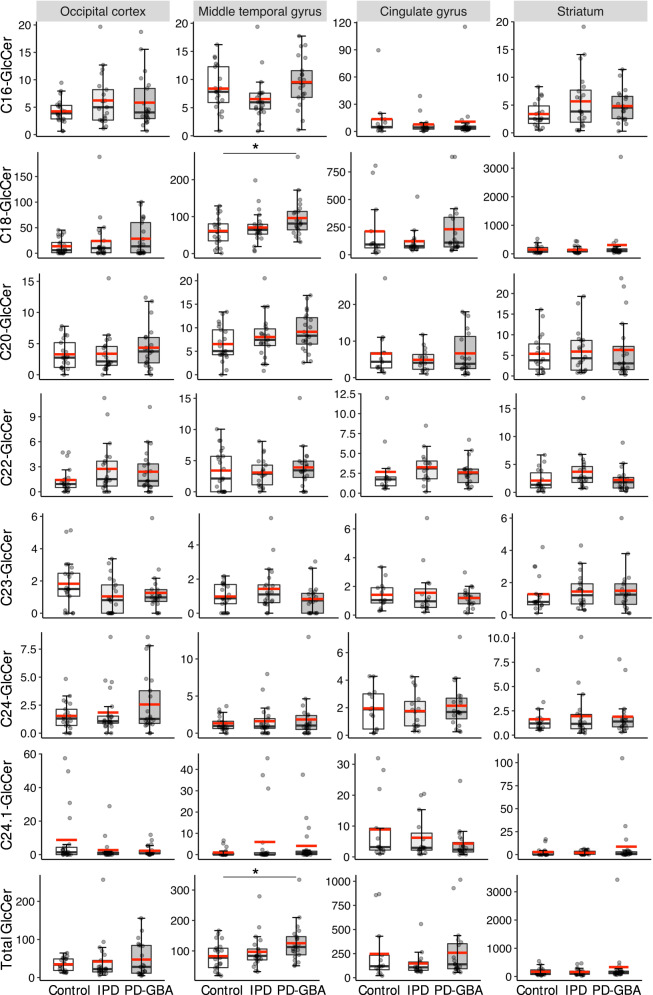
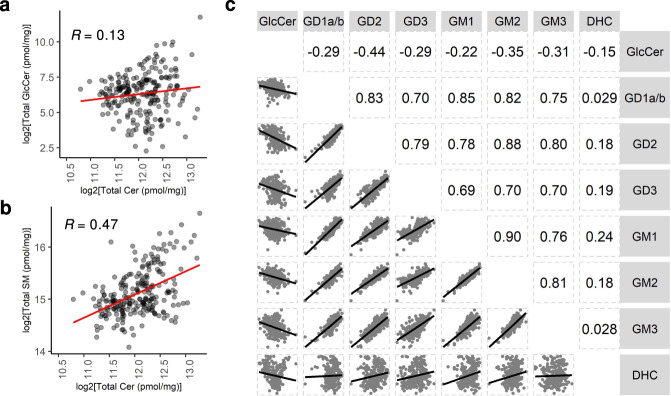
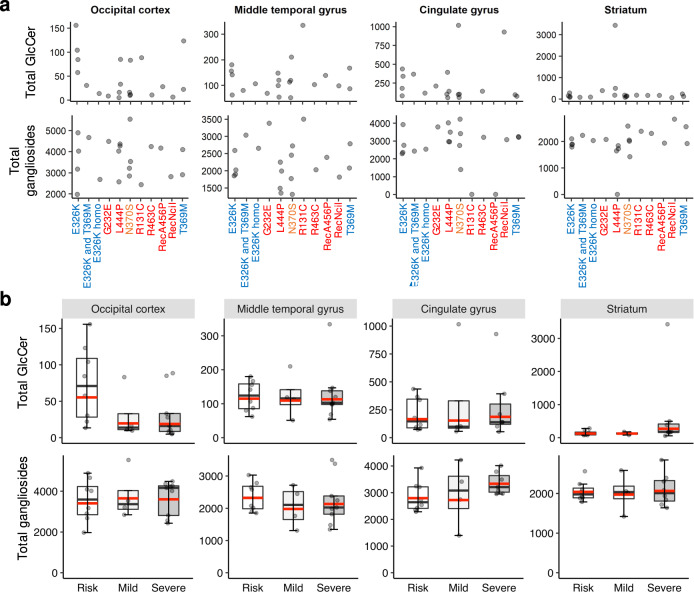
A number of genetic risk factors have been identified over the past decade for Parkinson's Disease (PD), with variants in GBA prominent among them. GBA encodes the lysosomal enzyme that degrades the glycosphingolipid, glucosylceramide (GlcCer), with the activity of this enzyme defective in Gaucher disease. Based on the ill-defined relationship between glycosphingolipid metabolism and PD, we now analyze levels of various lipids by liquid chromatography/electrospray ionization-tandem mass spectrometry in four brain regions from age- and sex-matched patient samples, including idiopathic PD, PD patients with a GBA mutation and compare both to control brains (n = 21 for each group) obtained from individuals who died from a cause unrelated to PD. Of all the glycerolipids, sterols, and (glyco)sphingolipids (251 lipids in total), the only lipid class which showed significant differences were the gangliosides (sialic acid-containing complex glycosphingolipids), which were elevated in 3 of the 4 PD-GBA brain regions. There was no clear correlation between levels of individual gangliosides and the genetic variant in Gaucher disease [9 samples of severe (neuronopathic), 4 samples of mild (non-neuronopathic) GBA variants, and 8 samples with low pathogenicity variants which have a higher risk for development of PD]. Most brain regions, i.e. occipital cortex, cingulate gyrus, and striatum, did not show a statistically significant elevation of GlcCer in PD-GBA. Only one region, the middle temporal gyrus, showed a small, but significant elevation in GlcCer concentration in PD-GBA. We conclude that changes in ganglioside, but not in GlcCer levels, may contribute to the association between PD and GBA mutations.


Conflict of interest statement

The authors declare no competing interests.

Figures

Fig. 1
Fig. 1. Brain regions used in the study.
Schematic illustration of the brain regions used in this study. Created with BioRender.com.
Fig. 2
Fig. 2. Lipid classes measured in the study.
The upper portion of the figure shows the SLs that were measured, with the size of each circle (red) representing the average concentration (pmol/mg protein) of each lipid in control brains, averaged across three brain regions (MTG, CG, and STR). For instance, SM is the most abundant SL in the brain (37,695 pmol/mg protein) and gangliosides GD1a/b are the most abundant gangliosides (1803 pmol/mg protein). The lower panel shows the structures of some of the SLs, along with the structures of the glycerophospholipids and lysoglycerophospholipids, which vary between their head group, along with cholesterol and cholesterol ester. Abbreviations: CE cholesterol ester; DG diacylglycerol; PC phosphatidylcholine; PE phosphatidylethanolamine; PG phosphatidylglycerol; PI phosphatidylinositol; PS phosphatidylserine; LPC lysophosphatidylcholine; LPE lysophosphatidylethanolamine; LPI lysophosphatidylinositol; BMP bis(monoacylglycero)phosphate; Cer ceramide; dhCer dihydroceramide; SM sphingomyelin; GalCer galactosylceramide; GlcCer glucosylceramide; DHC dihexosylceramide.
Fig. 3
Fig. 3. Lipid concentrations in IPD and PD-GBA compared to control brain samples.
Data are shown as a heatmap for each individual lipid class in each brain region, with each of the 251 rows corresponding to a lipid species with different chain lengths. Ratios of lipid concentrations are shown for IPD versus control, PD-GBA versus control, and PD-GBA versus IPD. Blue indicates a ratio of <1 and red a ratio of >1, as indicated in the key; grey indicates not detected.
Fig. 4
Fig. 4. Ganglioside concentrations in IPD and PD-GBA brain.
a Heatmap displaying ratio of concentrations of ganglioside species in the four different brain regions, along with the ratio of their total concentrations (i.e. the sum of all individual species). Blue indicates a ratio of <1 and red a ratio of >1; grey indicates not detected. b Boxplots of total ganglioside concentrations (pmol/mg protein) with (upper panel) and without (lower panel) GD1a/b (major gangliosides in human brain, see Fig. 2). The box represents lower quartile, median and upper quartile (black). The whiskers represent the minimum and maximum values, up to 1.5 times the interquartile range from the bottom or the top of the box to the furthest data point within that distance, thus excluding outliers. The mean is shown in red. *p ≤ 0.05; **p ≤ 0.01; ***p ≤ 0.001.
Fig. 5
Fig. 5. Individual ganglioside concentrations in IPD and PD-GBA brain.
Boxplots of total ganglioside concentrations (pmol/mg protein) expressed according to the order of their lysosomal degradation. The box represents lower quartile, median, and upper quartile (black). The whiskers represent the minimum and maximum values, up to 1.5 times the interquartile range from the bottom or the top of the box to the furthest data point within that distance, thus excluding outliers. The mean is in red. #p ≤ 0.1 *p ≤ 0.05; **p ≤ 0.01; ***p ≤ 0.001.
Fig. 6
Fig. 6. GlcCer concentrations in IPD and PD-GBA brain.
Boxplots of concentrations of individual GlcCer species (pmol/mg protein) along with the sum of all species (Total). The box represents lower quartile, median and upper quartile (black). The whiskers represent the minimum and maximum values, up to 1.5 times the interquartile range from the bottom or the top of the box to the furthest data point within that distance, thus excluding outliers. No outliers were removed from the data, including sample PG6 which had concentrations of C18-GlcCer ~10-fold higher than most other samples in the striatum of PD-GBA; there is no experimental justification for removing this sample from the analysis although it is assumed to be due to an unidentified technical issue since concentrations of other lipids were not abnormal for PG6 in other brain regions. The mean is in red. *p ≤ 0.05; **p ≤ 0.01; ***p ≤ 0.001.
Fig. 7
Fig. 7. Correlation between GlcCer, gangliosides, and ceramide.
Matrices were generated using combined data from all four brain regions and all sample groups (i.e. control, IPD, and PD-GBA). Pearson correlation matrices of a GlcCer versus ceramide, b ceramide versus SM, and c GlcCer, and DHC versus total gangliosides. Correlation coefficient values are indicated. Axes represent log2 scale of lipid concentrations.
Fig. 8
Fig. 8. Correlations between GlcCer and ganglioside concentrations and the GBA variant.
a GlcCer (upper panel) and total ganglioside (lower panel) concentrations shown according to the different GBA mutations [severe mutations, i.e. G232E, R131C, L444P, R463C, RecA456P, RecNciI (red), mild mutations, i.e. N370S (orange) and risk factors E326K, T369M (blue)]. Each point indicates GlcCer or ganglioside concentrations in an individual patient. b Boxplots of total GlcCer (upper panel) and total ganglioside concentrations (lower panel) in the PD-GBA group according to mutation severity. The box represents lower quartile, median, and upper quartile (black). The whiskers represent the minimum and maximum values, up to 1.5 times the interquartile range from the bottom or the top of the box to the furthest data point within that distance, thus excluding outliers. The mean is in red. No statistical significance was reached using the t-test.

Similar articles

Cited by

References

    1. Robak LA, et al. Excessive burden of lysosomal storage disorder gene variants in Parkinson’s disease. Brain. 2017;140:3191–3203. doi: 10.1093/brain/awx285. - DOI - PMC - PubMed
    1. Blumenreich S, Barav OB, Jenkins BJ, Futerman AH. Lysosomal storage disorders shed light on lysosomal dysfunction in Parkinson’s disease. Int. J. Mol. Sci. 2020;21:1–12. doi: 10.3390/ijms21144966. - DOI - PMC - PubMed
    1. Balestrino R, Schapira AHV. Parkinson disease. Eur. J. Neurol. 2020;27:27–42. doi: 10.1111/ene.14108. - DOI - PubMed
    1. Futerman AH, Hardy J. Finding common ground. Nature. 2016;537:6–7. doi: 10.1038/537S160a. - DOI - PubMed
    1. Balestrino R, Schapira AHV. Glucocerebrosidase and Parkinson disease: Molecular, clinical, and therapeutic implications. Neuroscientist. 2018;24:540–559. doi: 10.1177/1073858417748875. - DOI - PubMed