. 2022 Sep:55:102419.
doi: 10.1016/j.redox.2022.102419. Epub 2022 Jul 31.

The loss of pancreatic islet NADPH oxidase (NOX)2 improves islet transplantation

Affiliations

The loss of pancreatic islet NADPH oxidase (NOX)2 improves islet transplantation

Selina Wrublewsky et al. Redox Biol. 2022 Sep.

Abstract

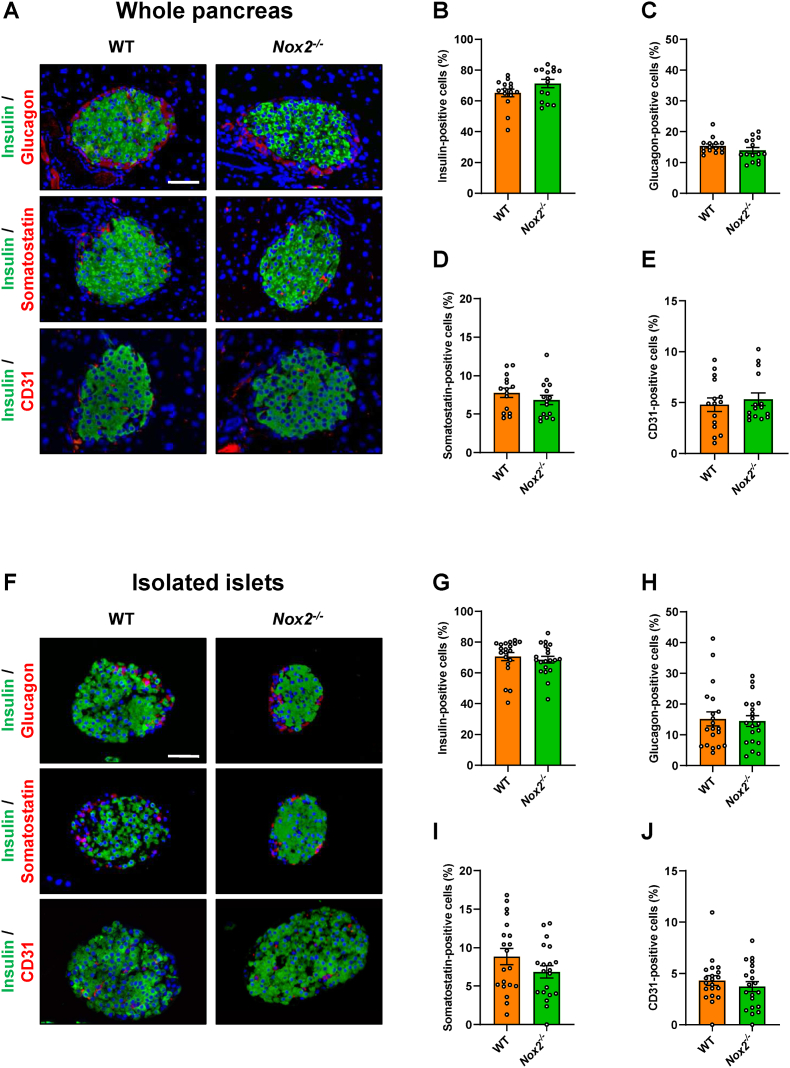
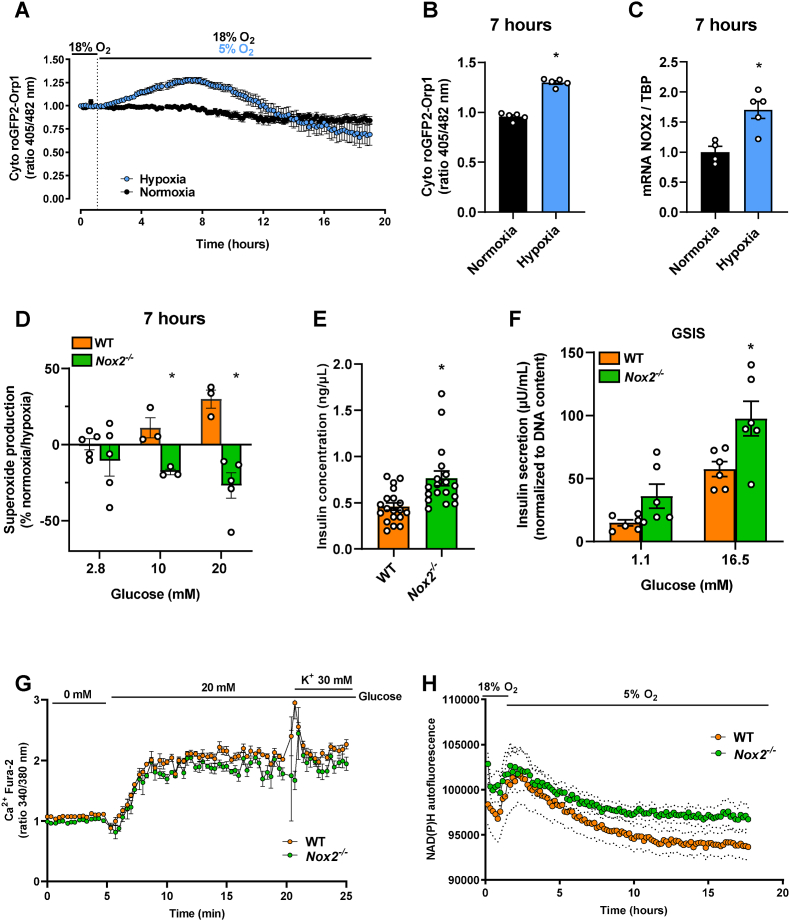
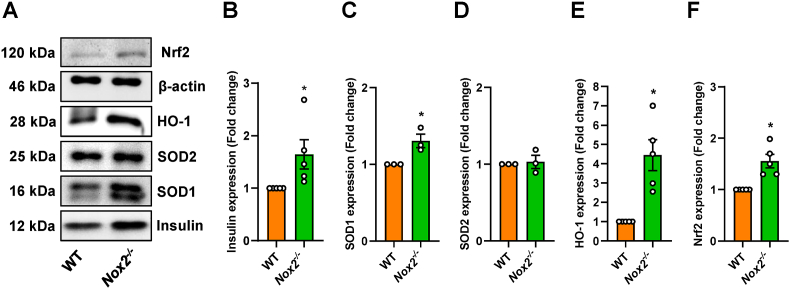
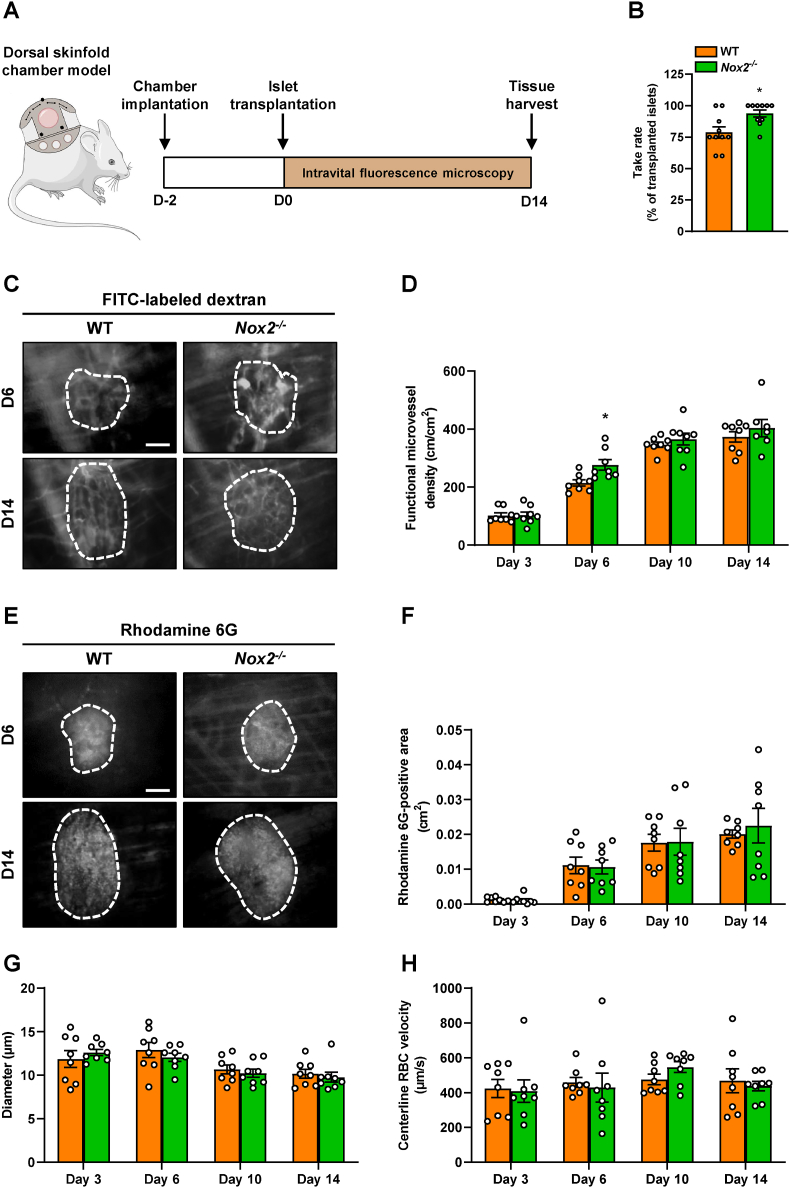
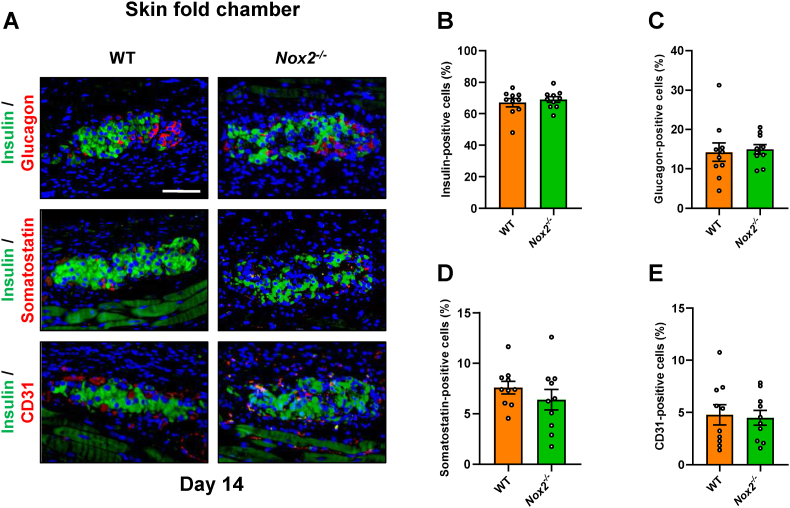
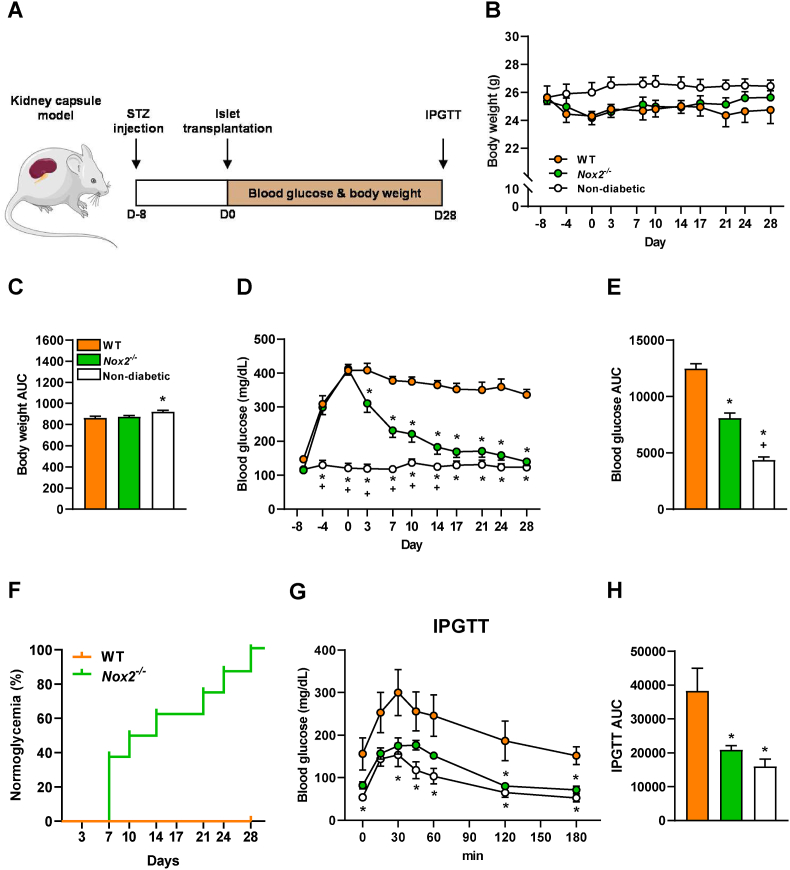
Islet transplantation is a promising treatment strategy for type 1 diabetes mellitus (T1DM) patients. However, oxidative stress-induced graft failure due to an insufficient revascularization is a major problem of this therapeutic approach. NADPH oxidase (NOX)2 is an important producer of reactive oxygen species (ROS) and several studies have already reported that this enzyme plays a crucial role in the endocrine function and viability of β-cells. Therefore, we hypothesized that targeting islet NOX2 improves the outcome of islet transplantation. To test this, we analyzed the cellular composition and viability of isolated wild-type (WT) and Nox2-/- islets by immunohistochemistry as well as different viability assays. Ex vivo, the effect of Nox2 deficiency on superoxide production, endocrine function and anti-oxidant protein expression was studied under hypoxic conditions. In vivo, we transplanted WT and Nox2-/- islets into mouse dorsal skinfold chambers and under the kidney capsule of diabetic mice to assess their revascularization and endocrine function, respectively. We found that the loss of NOX2 does not affect the cellular composition and viability of isolated islets. However, decreased superoxide production, higher glucose-stimulated insulin secretion as well as expression of nuclear factor erythroid 2-related factor (Nrf)2, heme oxygenase (HO)-1 and superoxide dismutase 1 (SOD1) was detected in hypoxic Nox2-/- islets when compared to WT islets. Moreover, we detected an early revascularization, a higher take rate and restoration of normoglycemia in diabetic mice transplanted with Nox2-/- islets. These findings indicate that the suppression of NOX2 activity represents a promising therapeutic strategy to improve engraftment and function of isolated islets.

Keywords: Diabetes; HO-1; Insulin secretion; Islet transplantation; NADPH oxidase; NOX2; Nrf2; ROS; Revascularization; β-cells.


Conflict of interest statement

The authors declare that they have no competing interests.

Figures

Fig. 1
Fig. 1
Loss of NOX2 does not affect the cellular composition of islets. (A) Representative immunofluorescence stainings of insulin/glucagon, insulin/somatostatin and insulin/CD31 in WT and Nox2−/− islets within the pancreas. Cell nuclei were stained with Hoechst 33,342 (blue). Scale bar: 50 μm. (B-E) Quantitative analysis of insulin- (B), glucagon- (C), somatostatin- (D) and CD31-positive cells (E) in WT and Nox2−/− islets within the pancreas in % of all islet cells (n = 15 each). Mean ± SEM. (F) Representative immunofluorescence stainings of insulin/glucagon, insulin/somatostatin and insulin/CD31 in isolated WT and Nox2−/− islets. Cell nuclei were stained with Hoechst 33,342 (blue). Scale bar: 50 μm. (G-J) Quantitative analysis of insulin- (G), glucagon- (H), somatostatin- (I) and CD31-positive cells (J) in isolated WT and Nox2−/− islets in % of all islet cells (n = 20 each). Mean ± SEM. (For interpretation of the references to colour in this figure legend, the reader is referred to the Web version of this article.)
Fig. 2
Fig. 2
Loss of NOX2 decreases superoxide production and improves the function of hypoxic islets. (A) Dynamic measurements of H2O2 levels in isolated islets from cyto-roGFP2-Orp1 mice during 19 h of normoxia or 1 h normoxia followed by 18 h hypoxia analyzed by the ratio (405/482 nm) (n = 5 each). Mean ± SEM. (B) 405/482 nm ratio after 7 h of hypoxia (peak of (A)) (n = 5 each). Mean ± SEM. *P < 0.05 vs. normoxia. (C) Analysis of NOX2/TBP mRNA expression in isolated WT islets cultivated in the presence of normoxia or hypoxia for 7 h. Data is presented as fold change, and WT for each experimental day was considered 1 (n = 5 each). Mean ± SEM. *P < 0.05 vs. normoxia. (D) Superoxide production measurement of various glucose concentrations (2.8, 10 and 20 mM) using EPR spectroscopy with CMH. Data are displayed as percentual change of normoxia compared to hypoxia (n = 3–5 each). Mean ± SEM. *P < 0.05 vs. WT. (E) Quantitative analysis of insulin concentration in the cultivation medium (ng/μL) from isolated hypoxic WT and Nox2−/− islets (n = 20 each). Mean ± SEM. *P < 0.05 vs. WT. (F) Quantitative analysis of GSIS (μU/mL) from hypoxic WT and Nox2−/− islets exposed to 1.1 mM and 16.5 mM glucose (n = 6 each), normalized by total DNA content. Mean ± SEM. *P < 0.05 vs. WT. (G) Dynamic measurements of cytosolic Ca2+ influx using Fura 2-AM in isolated WT and Nox2−/− islets after 18 h of hypoxia (n = 4 each). Mean ± SEM. (H) Dynamic measurements of NAD(P)H autofluorescence in isolated WT and Nox2−/− islets during 18 h of hypoxia (n = 9 each). Mean ± SEM.
Fig. 3
Fig. 3
The loss of NOX2 increases the expression of insulin and antioxidative proteins in hypoxic islets. (A) Representative Western blot analysis of (from top to bottom) Nrf2, β-actin, HO-1, SOD2, SOD1 and insulin from whole cell extracts of isolated hypoxic WT and Nox2−/− islets. (B) Quantitative analysis of insulin expression (Fold change) (n = 5 each). Mean ± SEM. *P < 0.05 vs. WT. (C) Quantitative analysis of SOD1 expression (Fold change) (n = 3 each). Mean ± SEM. *P < 0.05 vs. WT. (D) Quantitative analysis of SOD2 expression (Fold change) (n = 3 each). Mean ± SEM. *P < 0.05 vs. WT. (E) Quantitative analysis of HO-1 expression (Fold change) (n = 5 each). Mean ± SEM. *P < 0.05 vs. WT. (F) Quantitative analysis of Nrf2 expression (Fold change) (n = 5 each). Mean ± SEM. *P < 0.05 vs. WT.
Fig. 4
Fig. 4
Loss of NOX2 accelerates revascularization of transplanted islets. (A) Schematic illustration of the experimental setting. Dorsal skinfold chambers were implanted on day −2 followed by transplantation of WT and Nox2−/− islets on day 0. Intravital fluorescence microscopy was performed on days 3, 6, 10 and 14 after islet transplantation. On day 14, the tissue was harvested for immunohistochemical stainings. (B) Take rate of WT and Nox2−/− islets (% of transplanted islets) on day 14 after islet transplantation onto the exposed striated muscle tissue (n = 10 each). Mean ± SEM. *P < 0.05 vs. WT. (C) Representative intravital fluorescent microscopic images of transplanted WT and Nox2−/− islets within the dorsal skinfold chamber on day 14. The plasma marker FITC-labeled dextran 150,000 was used for the visualization of blood-perfused microvessels. The border of the grafts is marked by white broken lines. Scale bar: 50 μm. (D) Quantitative analysis of the functional microvessel density (cm/cm2) of WT and Nox2−/− islets (n = 8 each). Mean ± SEM. *P < 0.05 vs. WT. (E) Representative intravital fluorescent microscopic images of transplanted WT and Nox2−/− islets within the dorsal skinfold chamber on day 14. Rhodamine 6G was used to visualize endocrine tissue perfusion (bright signals). The border of the grafts is marked by broken lines. Scale bar: 50 μm. (F–H) Quantitative analysis of the rhodamine 6G-positive area (cm2) (F), the microvessel diameters (μm) (G) and the microvessel centerline RBC velocities (μm/s) (H) within transplanted WT and Nox2−/− islets (n = 8 each). Mean ± SEM.
Fig. 5
Fig. 5
Immunohistochemical stainings of grafted WT and Nox2−/−islets (A) Representative immunofluorescence stainings of insulin, glucagon, somatostatin and CD31 in WT and Nox2−/− islets on day 14 after transplantation. Cell nuclei were stained with Hoechst 33,342 (blue). Scale bar: 100 μm. (B-E) Quantitative analysis of insulin- (B), glucagon- (C), somatostatin- (D) and CD31-positive cells (E) in WT and Nox2−/− islets in % of all islet cells (n = 10 each). Mean ± SEM. (For interpretation of the references to colour in this figure legend, the reader is referred to the Web version of this article.)
Fig. 6
Fig. 6
Loss of NOX2 in transplanted islets restores normoglycemia in diabetic mice. (A) Schematic illustration of the experimental setting. A diabetic phenotype was induced by a single injection of STZ (180 mg/kg) 8 days prior to islet transplantation. On day 0, 300 islets were transplanted under the left kidney capsule of diabetic mice. Blood glucose levels and body weights were measured from day −8 to day 28 twice a week. On day 28, an IPGTT was performed. (B) Body weights (g) of mice transplanted with WT and Nox2−/− islets (n = 8 each). Non-diabetic mice served as negative control (n = 8 each). Mean ± SEM. (C) Area under the curve (AUC) of the body weights from (B) (n = 8 each). Mean ± SEM. *P < 0.05 vs. WT. (D) Blood glucose levels (mg/mL) of diabetic mice transplanted with WT and Nox2−/− islets from day −8 to day 28 (n = 8 each). Non-diabetic animals served as negative control (n = 8 each). Mean ± SEM. *P < 0.05 vs. WT; +P < 0.05 vs. Nox2−/−. (E) AUC of the blood glucose levels from (D) (n = 8 each). Mean ± SEM. *P < 0.05 vs. WT; +P < 0.05 vs. Nox2−/−. (F) The proportion of mice (%) that achieved normoglycemia after transplantation with WT or Nox2−/− islets (n = 8 each). (G) Blood glucose levels (mg/dL) according to the IPGTT of diabetic mice transplanted with WT and Nox2−/− islets (n = 8 each). Non-diabetic animals served as negative control (n = 8 each). Mean ± SEM. *P < 0.05 vs. WT. (H) AUC of IPGTT from (G) (n = 8 each). Mean ± SEM. *P < 0.05 vs. WT.

Similar articles

Cited by

References

    1. Kobayashi N. The current status of islet transplantation and its perspectives. Rev. Diabet. Stud. 2008;5(3):136–143. - PMC - PubMed
    1. Nyqvist D., et al. Donor islet endothelial cells in pancreatic islet revascularization. Diabetes. 2011;60(10):2571–2577. - PMC - PubMed
    1. Brissova M., et al. Intraislet endothelial cells contribute to revascularization of transplanted pancreatic islets. Diabetes. 2004;53(5):1318–1325. - PubMed
    1. Emamaullee J.A., Shapiro A.M.J. Factors influencing the loss of beta-cell mass in islet transplantation. Cell Transplant. 2007;16(1):1–8. - PubMed
    1. Kim G., et al. Am J Transplant; 2020. Protective Effect of a Novel Clinical-Grade Small Molecule Necrosis Inhibitor against Oxidative Stress and Inflammation during Islet Transplantation. - PubMed

LinkOut - more resources