. 2022 Aug 17;13(8):665-681.e4.
doi: 10.1016/j.cels.2022.06.006. Epub 2022 Jul 8.

Multi-omics personalized network analyses highlight progressive disruption of central metabolism associated with COVID-19 severity

Affiliations

Multi-omics personalized network analyses highlight progressive disruption of central metabolism associated with COVID-19 severity

Anoop T Ambikan et al. Cell Syst. .

Abstract

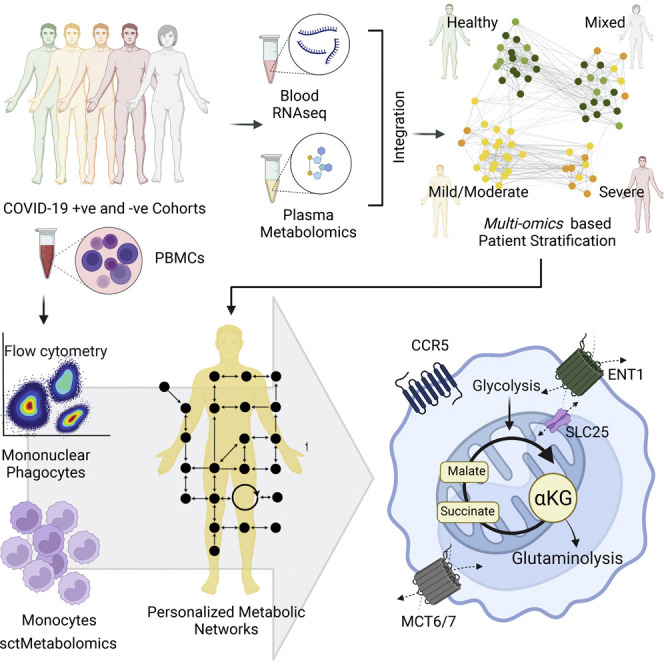
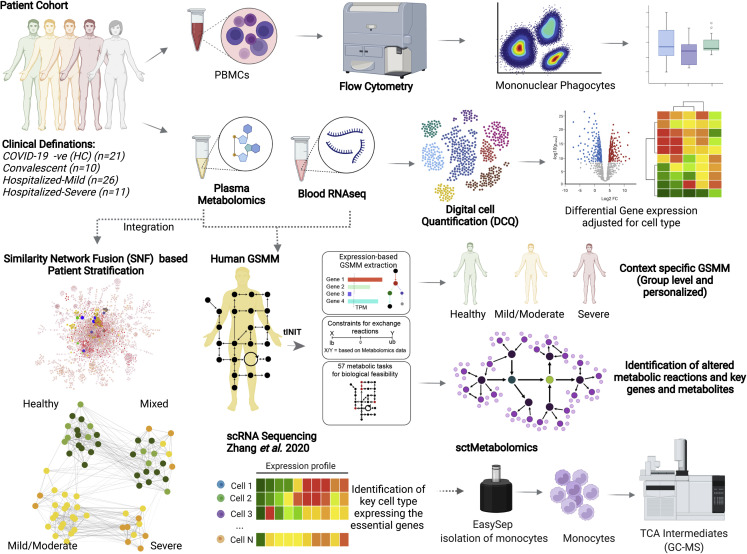
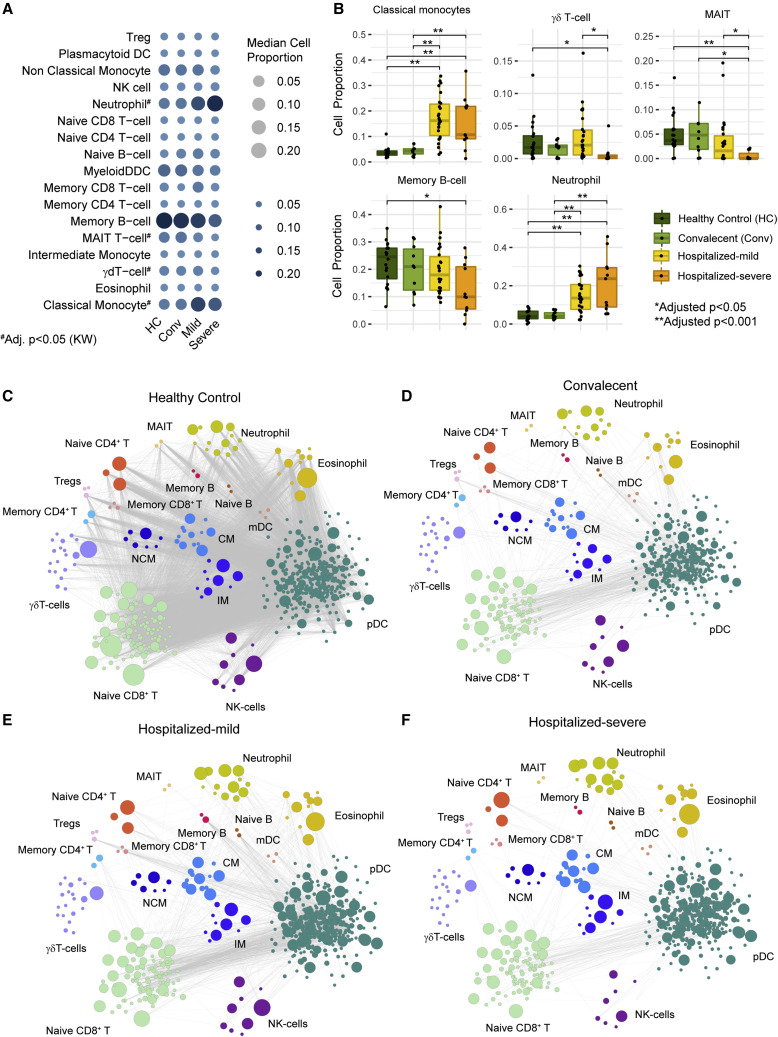
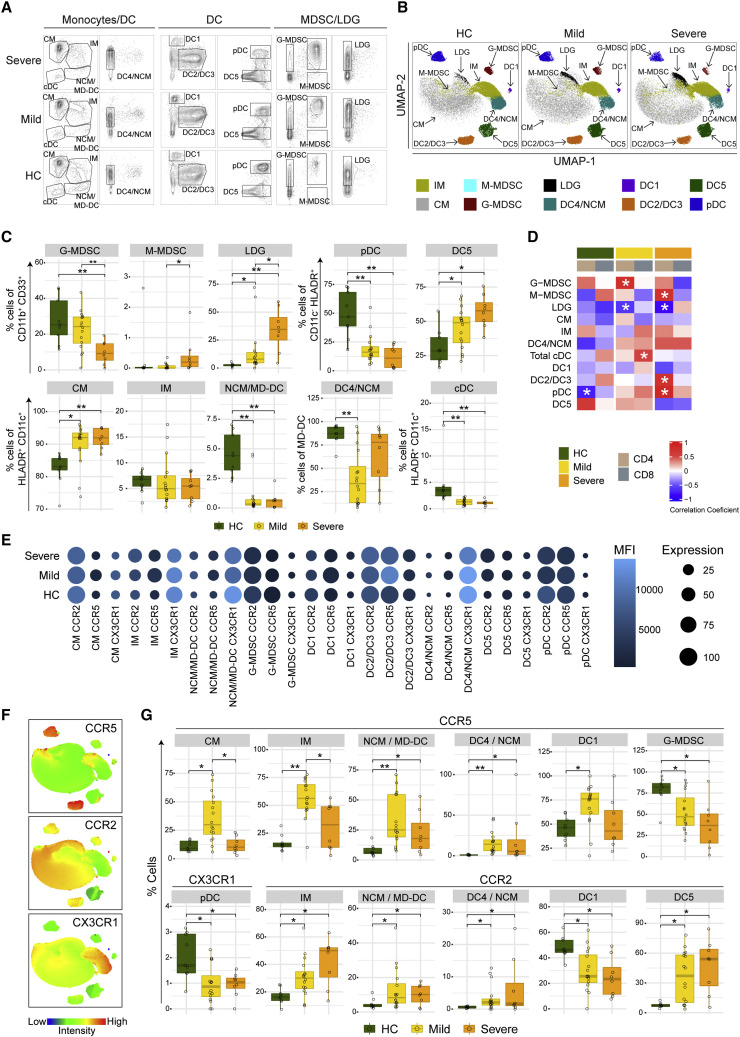
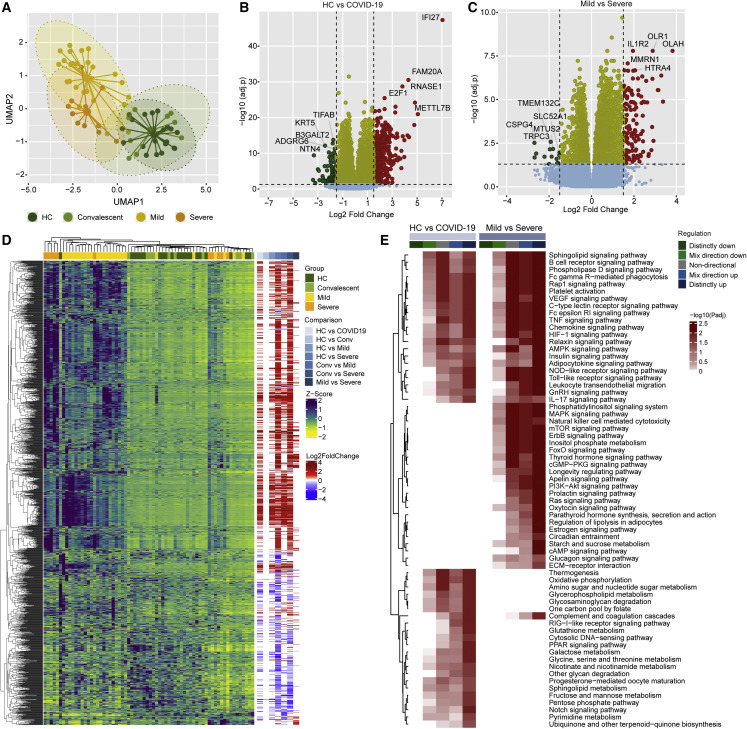
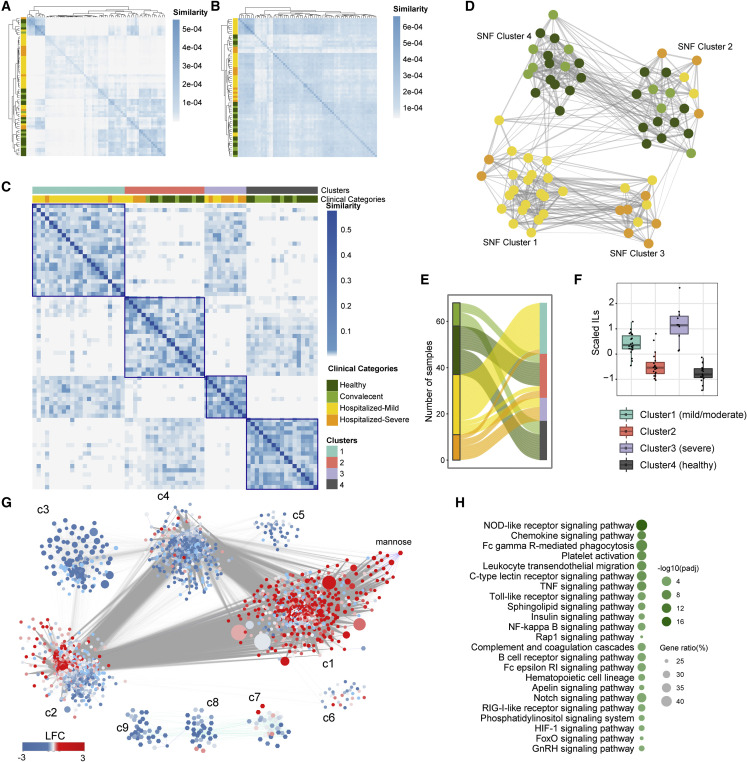
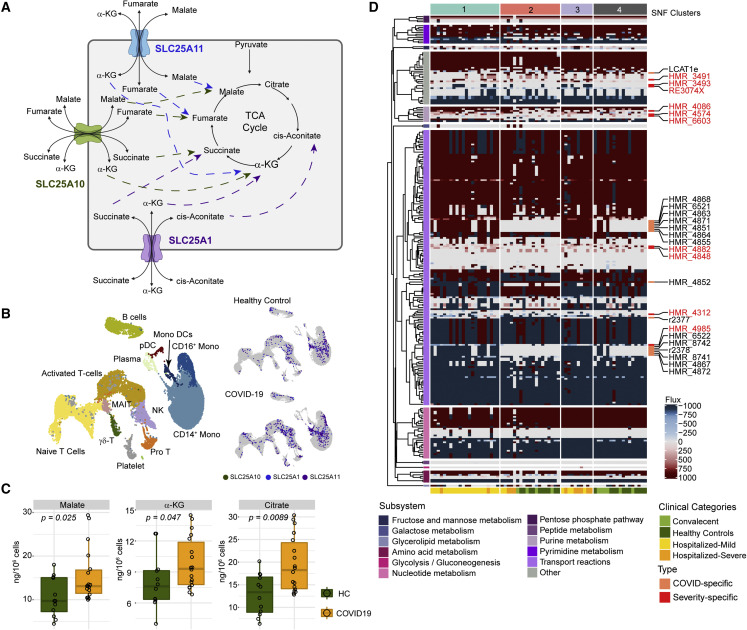
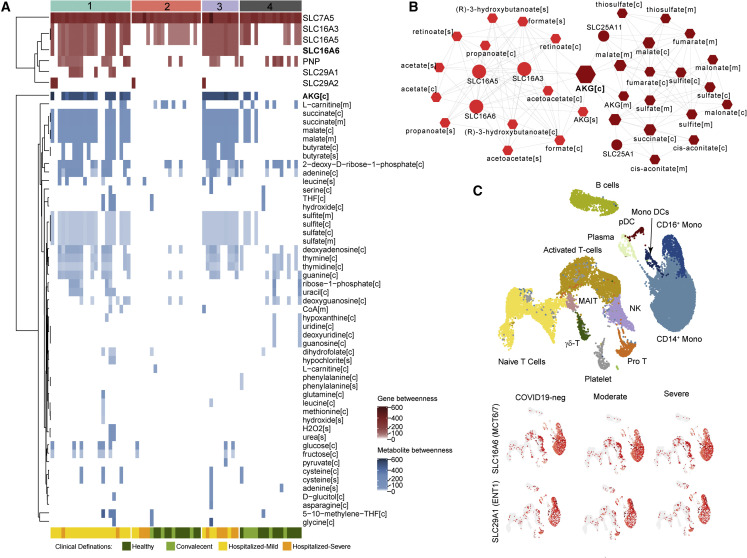
The clinical outcome and disease severity in coronavirus disease 2019 (COVID-19) are heterogeneous, and the progression or fatality of the disease cannot be explained by a single factor like age or comorbidities. In this study, we used system-wide network-based system biology analysis using whole blood RNA sequencing, immunophenotyping by flow cytometry, plasma metabolomics, and single-cell-type metabolomics of monocytes to identify the potential determinants of COVID-19 severity at personalized and group levels. Digital cell quantification and immunophenotyping of the mononuclear phagocytes indicated a substantial role in coordinating the immune cells that mediate COVID-19 severity. Stratum-specific and personalized genome-scale metabolic modeling indicated monocarboxylate transporter family genes (e.g., SLC16A6), nucleoside transporter genes (e.g., SLC29A1), and metabolites such as α-ketoglutarate, succinate, malate, and butyrate could play a crucial role in COVID-19 severity. Metabolic perturbations targeting the central metabolic pathway (TCA cycle) can be an alternate treatment strategy in severe COVID-19.

Keywords: COVID-19; personalized genome-scale metabolic model; similarity network fusion.


Conflict of interest statement

Declaration of interests The authors declare no competing interests.

Figures

None
Graphical abstract
Figure 1
Figure 1
The study design and project description The key methods are marked with bold texts. The dotted arrow indicates the leading experiments. The figure is created with biorender.com.
Figure 2
Figure 2
Digital cell quantification (DCQ) identified severity-specific signature in COVID-19 (A) Bubble plot describing DCQ results of all samples in each patient cohorts (HC [n = 21], convalescent [n = 10], hospitalized-mild [n = 26], and hospitalized-severe [n = 11]). Bubble size and color gradient are relative to median cell proportions calculated in each cohort for various cell types. Kruskal-Wallis test results between the cohorts are labeled by asterisks (adj. p < 0.05). (B) Boxplot of cell proportion estimated in all cohort samples represented in (A). Asterisks represent a significant change between cohorts computed by the Mann-Whitney U test (adj. p < 0.05). (C–F) Network visualization of co-expression among marker genes of various cell types in samples of healthy control (HC) cohort (C), convalescent cohort (D), hospitalized-mild cohort (E), and hospitalized-severe cohort (F). Each node in the network represents marker genes of the corresponding cell type, and node size is relative to the mean expression value (TPM). Edge denotes a significant Spearman correlation (adj. p < 0.001) between marker genes in HC, convalescent, and hospitalized-mild cohorts while adjusted p < 0.2 in hospitalized-severe.
Figure 3
Figure 3
Immunophenotyping of blood MNPs associated with COVID-19 severity (A) Contour plots of the different MNP populations in HC (n = 9), mild (n = 16), and severe (n = 8) COVID-19 patients. (B) UMAPs on concatenated files of MNPs in HC, mild, and severe COVID-19 patients. (C) Boxplots showing the relative frequencies of MNP populations in HC, mild, and severe COVID-19 patients. p values determined by Mann-Whitney U test, p < 0.05, ∗∗ p < 0.001. (D) Spearman correlation analysis between the myeloid cells and CD4+/CD8+ T cells ( p < 0.05). (E) Bubble plots of the different chemokine receptor expressions in MNP. The bubble size denotes cells expressing the receptor, whereas the color denotes the median fluorescence intensity (MFI). (F) MFI of chemokine receptors CCR5, CCR2, and CX3CR1 in the UMAP described in (B). (G) Boxplots showing relative frequencies of MNPs expressing the chemokine receptors. p values were determined by the Mann-Whitney U test, p < 0.05, ∗∗ p < 0.001.
Figure 4
Figure 4
System-wide transcriptomics profile in COVID-19 patients identified dysregulated immune and metabolic pathways (A) Sample distribution using normalized transcriptomics data (log2 counts per million) of all protein-coding genes through UMAP, colored by cohort. (B) Volcano plot visualizing gene expression changes in SARS-CoV-2-infected individuals (mild [n = 26] and severe [n = 11] in comparison with healthy individuals [HC, n = 21]). The top five significantly regulated genes are labeled. (C) Volcano plot visualizing gene expression changes in SARS-CoV-2-infected individuals with severe COVID-19 (n = 11) in comparison with mild disease (n = 26). The top five significantly regulated genes are labeled. (D) Heatmap visualizing expression pattern (Z score transformed log2 counts per million) and log2 scaled fold change values of significantly regulated genes in pairwise comparisons (adj. p < 0.05 and log2-fold change > 1.5). Column annotation represents patient groups, and pairwise differential expression comparisons and rows represent genes. (E) Heatmap visualizing significantly regulated Kyoto Encyclopedia of Genes and Genomes (KEGG) pathways (adj. p < 0.05) in SARS-CoV-2-infected individuals (mild [n = 26] and severe [n = 11] in comparison with healthy individuals [HC, n = 21]) and COVID-19 patients with severe disease (n = 11) in comparison with patients with mild disease (n = 26). The color scale represents negative log10 scaled adjusted p values of different directionality regulation classes. The non-directional p values are computed from the gene statistics disregarding the direction of expression. Mix-direction down and mix-direction up p values were computed by considering the segment of the gene statistics that are downregulated and upregulated, respectively. Distinct-directional p values were calculated using expression direction along with gene statistics. The distinct-direction up p values is exclusively influenced by the upregulation of genes. By contrast, distinct-direction down p values is influenced by downregulation of genes and not influenced by upregulation and downregulation together.
Figure 5
Figure 5
Integrated clustering of transcriptomics and metabolomics using similarity network fusion (SNF) shows novel stratifications for patients based on molecular data (A) Heatmap showing sample to sample similarity between all samples in each patient cohorts (HC [n = 21], convalescent [n = 10], hospitalized-mild [n = 26], and hospitalized-severe [n = 11]) for transcriptomics data. Row annotation denotes patient cohort. (B) Heatmap showing sample to sample similarity between all samples used in (A) for metabolomics data. Row annotation denotes patient cohort. (C) Sample to sample similarity of SNF-derived patient clusters. Column annotation denotes SNF clusters and associated clinical categories. (D) Network fusion diagram of the four integrated patient clusters. Node color indicates the clinical category of the samples; edges indicate a similarity >0.01. (HC [dark green], convalescent [light green], hospitalized-mild [yellow], and hospitalized-severe [orange]) (E) Sankey plot depicting association of clinical categories, and new clusters defined based on molecular data for each sample. (F) Mean-scaled interleukins (IL) of plasma inflammation profile identified by the IL6, IL7, IL8, IL10, IL15, and IL18 to define the severity of the data-driven clusters. (G) Community characterization results obtained from topology analysis of the association network between genes and metabolites among samples of SNF-1, 3, and 4. Node size is relative to the centrality (degree) of the feature (gene/metabolite). Node colors denote log2-fold change values of the feature in SNF-3 (severe, n = 10) compared with SNF-1 (mild/moderate, n = 22). Each edge denotes a significant Spearman correlation (adj. p < 0.00001). (H) Significantly enriched pathways (adj. p < 0.01) in the most central community found in (F) (community 1) based on average node centrality (degree).
Figure 6
Figure 6
Flux balance analysis (FBA) and sctMetabolomics identified COVID-19 and severity-specific dysregulated metabolic reaction (A) Representative diagram of selected transport reactions found to have different flux in SNF-1 (mild/moderate, n = 22) and SNF-3 (severe, n = 10) than SNF-4 (healthy, n = 17). The diagram shows the cellular location of the responses, transporter genes, and the transported metabolic products. (B) UMAP clustering of cells and their associated cell types generated from the scRNA-seq data published by Zhang et al. (2020). Expression (log expression > 2) of SLC25A1, SLC25A10, and SLC25A11 in various cell types is shown in subsequent UMAPs. (C) Single-cell-type metabolomics (sctMetabolomics) of the monocyte population identified increased α-ketoglutarate (α-KG), citrate, and malate (HC [n = 12] and COVID-19 [n = 18]). (D) Heatmap of metabolic reactions showed different flux among all the samples identified from individual genome-scale modeling and flux balance analysis. The color scale represents the metabolic flux measurements (mmol/h/gDCW) derived from FBA. Severity-specific (reactions having different flux in more than half of the samples in SNF-3 [severe, n = 10] compared with more than half of the samples in SNF-1 [mild/moderate, n = 22]; labeled in red) and COVID-19-specific (reactions having different flux in more than half of the samples in SNF-1 [mild/moderate, n = 22] and SNF-3 [severe, n = 10] compared with more than half of the samples in SNF-4 [healthy, n = 17]) reactions are labeled.
Figure 7
Figure 7
Network-based essential gene and metabolite analysis reveal the role of transporter genes and TCA-cycle intermediates in COVID-19 (A) The essential genes and metabolites are identified based on topology analysis of the network created using metabolites and associated genes of selected reactions in each sample. The heatmap visualizes the centrality measurements (betweenness) of genes and metabolites in each sample network. Top column annotation denotes sample classification by SNF clustering. The bottom column annotation denotes original cohorts. (B) Topology analysis results of the network created using metabolites and associated genes of selected reactions in SNF cluster 3 (severe, n = 10). The figure shows two communities identified. The color gradient denotes the centrality of the communities (betweenness). Node size is relative to the centrality (betweenness) of each feature. (C) UMAP clustering of cells and their associated cell types generated from scRNA-seq data published by Zhang et al. (2020). Expression of top essential genes identified in (A), in various cell types, is shown in subsequent UMAPs.

References

    1. Agrati C., Sacchi A., Bordoni V., Cimini E., Notari S., Grassi G., Casetti R., Tartaglia E., Lalle E., D’Abramo A., et al. Expansion of myeloid-derived suppressor cells in patients with severe coronavirus disease (COVID-19) Cell Death Differ. 2020;27:3196–3207. - PMC - PubMed
    1. Agren R., Bordel S., Mardinoglu A., Pornputtapong N., Nookaew I., Nielsen J. Reconstruction of genome-scale active metabolic networks for 69 human cell types and 16 cancer types using INIT. PLoS Comput. Biol. 2012;8:e1002518. - PMC - PubMed
    1. Agren R., Mardinoglu A., Asplund A., Kampf C., Uhlen M., Nielsen J. Identification of anticancer drugs for hepatocellular carcinoma through personalized genome-scale metabolic modeling. Mol. Syst. Biol. 2014;10:721. - PMC - PubMed
    1. Albrich W.C., Ghosh T.S., Ahearn-Ford S., Mikaeloff F., Lunjani N., Forde B., Suh N., Kleger G.R., Pietsch U., Frischknecht M., et al. A high-risk gut microbiota configuration associates with fatal hyperinflammatory immune and metabolic responses to SARS-CoV-2. Gut Microbes. 2022;14:2073131. - PMC - PubMed
    1. Aller S., Scott A., Sarkar-Tyson M., Soyer O.S. Integrated human-virus metabolic stoichiometric modelling predicts host-based antiviral targets against Chikungunya, Dengue and Zika viruses. J. R. Soc. Interface. 2018;15 - PMC - PubMed

Publication types