. 2022 Aug 8;41(1):238.
doi: 10.1186/s13046-022-02448-5.

Acylglycerol kinase promotes ovarian cancer progression and regulates mitochondria function by interacting with ribosomal protein L39

Affiliations

Acylglycerol kinase promotes ovarian cancer progression and regulates mitochondria function by interacting with ribosomal protein L39

Fei Sun et al. J Exp Clin Cancer Res. .

Abstract

Background: Epithelial ovarian cancer (EOC) is the leading cause of deaths among patients with gynecologic malignancies. In recent years, cancer stem cells (CSCs) have attracted great attention, which have been regarded as new biomarkers and targets in cancer diagnoses as well as therapies. However, therapeutic failure caused by chemotherapy resistance in late-stage EOC occurs frequently. The 5-year survival rate of patients with EOC remains at about 30%.

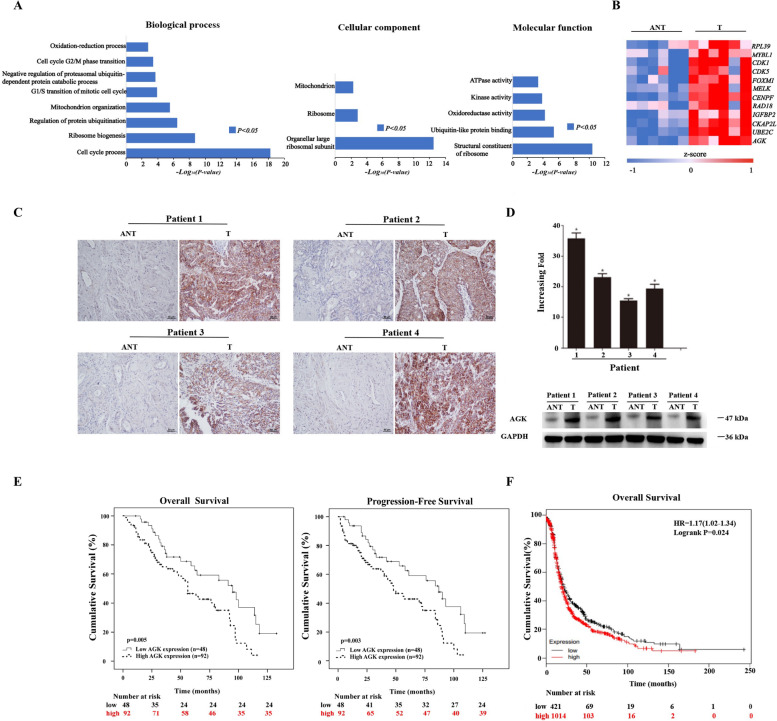
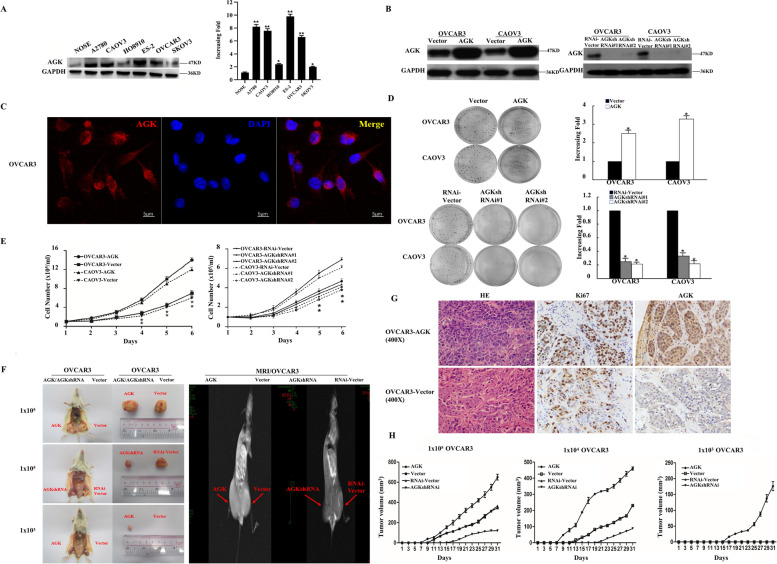
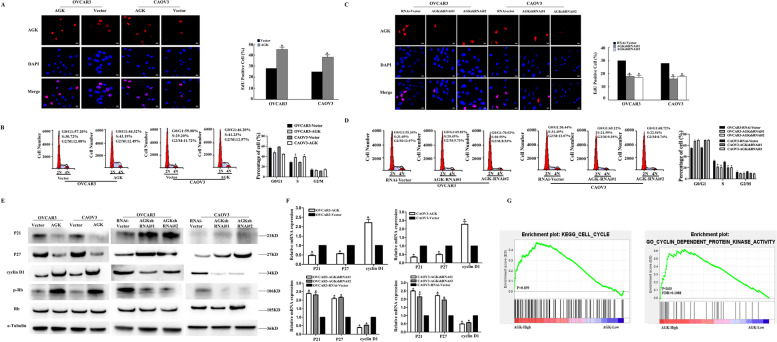
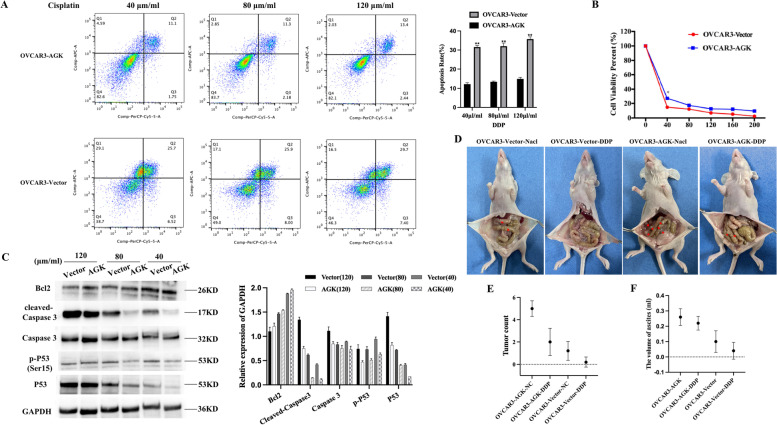
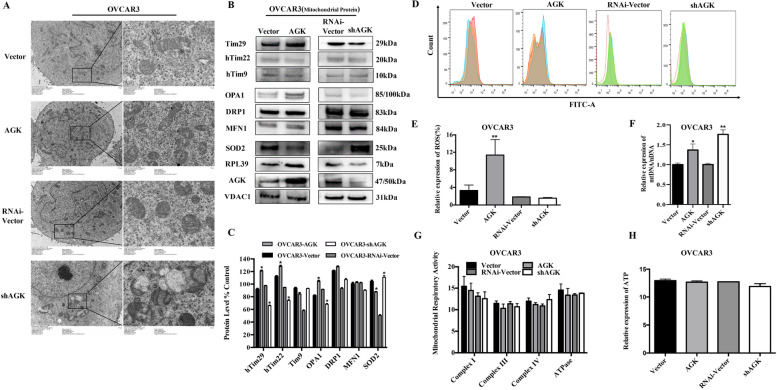
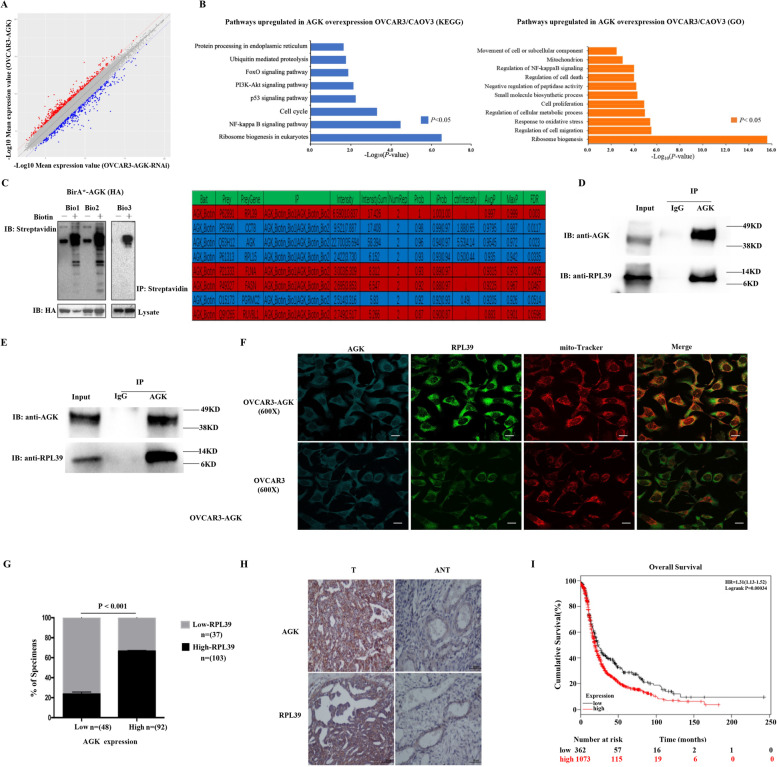
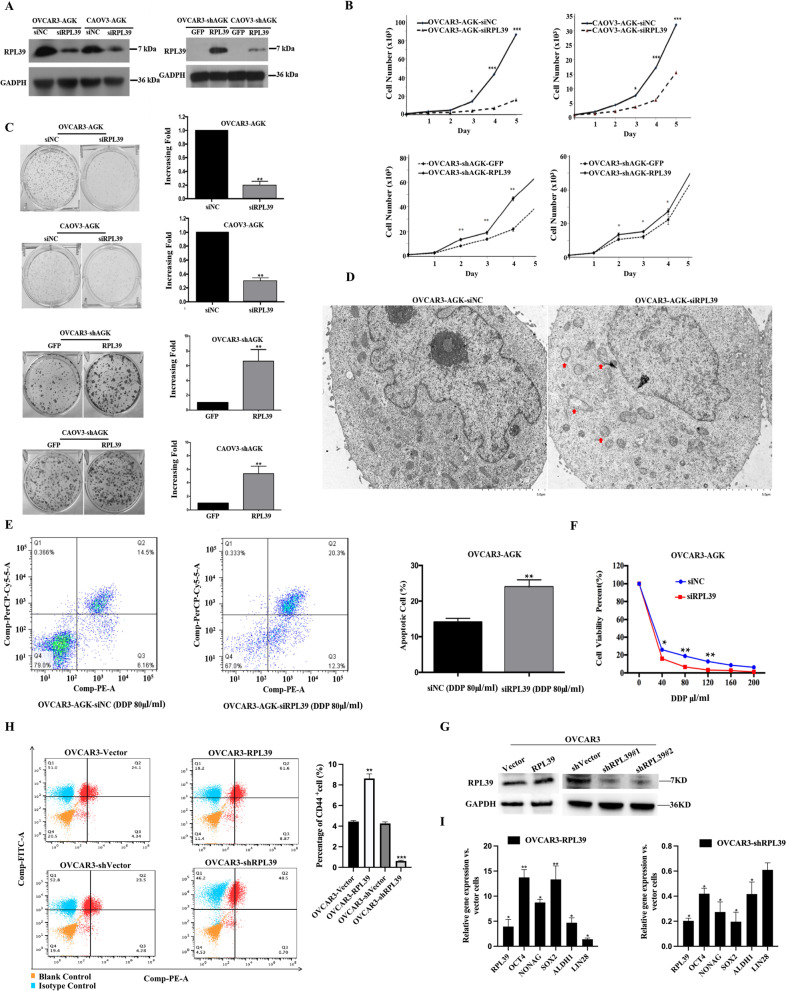
Methods: In this study, the expression of acylglycerol kinase (AGK) was analyzed among patients with EOC. The effect of AGK on EOC cell proliferation and tumorigenicity was studied using Western blotting, flow cytometry, EdU assay and in vivo xenotransplantation assays. Furthermore, AGK induced CSC-like properties and was resistant to cisplatin chemotherapy in the EOC cells, which were investigated through sphere formation assays and the in vivo model of chemoresistance. Finally, the relationship between AGK and RPL39 (Ribosomal protein L39) in mitochondria as well as their effect on the mitochondrial function was analyzed through methods including transmission electron microscopy, microarray, biotin identification and immunoprecipitation.

Results: AGK showed a markedly upregulated expression in EOC, which was significantly associated with the poor survival of patients with EOC, the expression of AGK-promoted EOC cell proliferation and tumorigenicity. AGK also induced CSC-like properties in the EOC cells and was resistant to cisplatin chemotherapy. Furthermore, the results indicated that AGK not only maintained mitochondrial cristae morphogenesis, but also increased the production of reactive oxygen species and Δψm of EOC cells in a kinase-independent manner. Finally, our results revealed that AGK played its biological function by directly interacting with RPL39.

Conclusions: We demonstrated that AGK was a novel CSC biomarker for EOC, which the stemness of EOC was promoted and chemotherapy resistance was developed through physical as well as functional interaction with RPL39.

Keywords: Acylglycerol kinase; Epithelial ovarian cancer; Mitochondrial; Ribosomal protein L39; cancer stem cell.


Conflict of interest statement

The authors declare that they have no competing interests.

Figures

Fig. 1
Fig. 1
High expression of AGK correlated with EOC progression. A GO functional and pathway enrichment analysis of EOC specimens (T) compared to the adjacent noncancerous tissue samples (ANT). B A heatmap representing the genes upregulated in T compared to the adjacent ANT. 1 column represents 1 sample in different conditions. C Specimens derived from human EOC (T) were analyzed through IHC compared to the adjacent noncancerous tissue samples (ANT). AGK was upregulated in human EOC tissues. D RT-PCR and Western blotting were performed to analyze 4 matched pairs of EOC specimens (T) and adjacent noncancerous tissue samples (ANT). N = 3 independent experiments. E Kaplan-Meier overall survival curves (left panel), progression-free survival (right panel) and univariate analyses (log-rank) comparing patients with EOC with low (n = 48) and high (n = 92) AGK-expressing tumors. F The prognostic value of AGK in ovarian cancer series from publicly available datasets. Kaplan–Meier curves through a univariate analysis (log-rank) of patients with EOC and a high AGK expression (n = 1014) versus those with a low AGK expression (n = 421) for the overall survival (http://kmplot.com/analysis/index.php?p=service&cancer=ovar)
Fig. 2
Fig. 2
AGK promotes EOC cell proliferation in vitro and in vivo. A The level of AGK protein and mRNA in NOSE cells and 6 EOC cell lines was examined through Western blotting and quantitative real-time PCR (qPCR). GAPDH was used as an internal control. B Stably overexpressed and knocked-down AGK EOC cell lines (OVCAR3 and CAOV3) were detected by WB. C Immunofluorescence staining showed the expression of AGK (red) in EOC cells. Colony formation assay (D) and cell growth curve (E) indicated that the growth rate increased in cells with AGK overexpression and decreased in those with AGK knockdown. The number of cells on Day 2–6 was normalized to that of the cells on Day 1 as a control. The number of colonies was quantified through a colony formation assay. Each bar represents the mean ± SD of 3 independent experiments. *P < 0.05. F The generation of the xenograft model in NOD/SCID mice. OVCAR3-AGK, OVCAR3-AGK-RNAi and the respective control cells were inoculated into NOD/SCID mice (n = 5/group). Representative images of tumor-bearing mice (left panel) and the MRI images of tumors (right panel). G H&E staining of representative samples derived from mouse xenograft. The trend of the expression of AGK and Ki67 is consistent with that of staining using IHC. H The tumor volume of different groups was measured on the indicated days. Each bar represents the mean ± SD of 3 independent experiments. *P < 0.05. N = 3 independent experiments
Fig. 3
Fig. 3
AGK regulates the G1-S-phase transition in EOC cells. A Representative micrographs (left panel) and the quantification (right panel) of EdU incorporation in the OVCAR3/CAOV3-AGK as well as vector control cells. B Cell cycle flow cytometric analysis of AGK-overexpressing and vector control cells. C Representative micrographs (left panel) and the quantification (right panel) of EdU incorporation in the OVCAR3/CAOV3-AGK-RNAi as well as vector control cells. D Cell cycle flow cytometric analysis of OVCAR3/CAOV3-AGK-RNAi and vector control cells. AGK altered the expression of G1-S-phase cell-cycle regulators. Western blotting (E) and real-time PCR (F) analysis of the expression of p21Cip1, p27Kip1, cyclin D1, p-Rb and the total Rb protein in the OVCAR3/CAOV3-AGK as well as OVCAR3/CAOV3-AGK-RNAi cells; α-Tubulin was used as a loading control. Each bar represents the mean ± SD of 3 independent experiments. *P < 0.05. N = 3 independent experiments. G GSEA plot analysis showed that the expression of AGK was positively correlated with cell cycle and cell-cycle-dependent protein kinase based on the published gene expression profiles of patients with EOC (the Cancer Genome Atlas TCGA, https://cancergenome.nih.gov/, GSE102180). All experiments were repeated at least three times independently
Fig. 4
Fig. 4
AGK increases the population of EOC CSC and induces chemoresistant in vitro. A A real-time PCR analysis of the expression of pluripotency-associated markers, ALDH1, Sox2, Oct4, Nanog and Lin28 in the indicated cells. B Representative images (left panel) of spheres formed by the indicated cells. Histograms (right panel) showed the mean number of spheres formed by the indicated cells. C Single-AGK-overexpressing and control cells were performed for their sphere-forming potential in 96-well plates. Tertiary and quaternary spheres were generated in cells dissociated from 1 previous individual generation sphere in each 96-well plate. Data was compiled from 3 independent biologic experiments. D Hoechst-stained side population (SP) assay showed that the overexpression of AGK was promoted, whereas AGK knockdown attenuated the SP cells in the indicated cells. E Histograms show the mean percent of SP+ cell numbers. F Flow cytometry analysis of CD44+ cells (left panel). Histograms (right panel) show the mean percent of CD44+ cells
Fig. 5
Fig. 5
AGK increases the population of EOC CSC and induces chemoresistant in vivo. A Flow cytometry analysis of annexin V+/PI ¯ cells after the indicated cells were treated with cisplatin (40 μm/ml, 80 μm/ml, 120 μm/ml) for 24 h. Results were expressed as percentages of total cells. B The dose-dependent curve of cisplatin treatment for OVCAR3-AGK and OVCAR3-Vector cells. C Cleaved caspase 3, caspase 3, Bcl-2, p-P53, and P53 were apoptosis markers tested by WB. D Cisplatin chemoresistance of AGK on EOC in vivo. AGK-overexpressing (OVCAR3-AGK) or AGK-knockdown (OVCAR3-AGKshRNA) cells (5 × 106) were injected subcutaneously into the subcutaneous and intraperitoneal inguinal folds of NOD/SCID mice. 3 days later, cisplatin (5 mg/kg) was injected intraperitoneally into nude mice 3 times per week. On Day 25, mice were euthanized and the tumors as well as ascites were excised and weighed. A chemiluminescent imaging system (Sacecreation) was used to evaluate the tumors in the mice. Error bars represent the means ± SD of 3 independent experiments. *P < 0.05. **P < 0.001. N = 3 independent experiments
Fig. 6
Fig. 6
AGK maintains the mitochondrial morphology and function of EOC cells. A Transmission electron microscopic analysis of OVCAR3-AGK and OVCAR3-shAGK cells. Scale bar was 1 μm. B Western blotting analysis of indicated cell lines using antibodies against Tim29, hTim22, hTim9, OPA1, DRP1, MFN1, SOD2, RPL39, AGK and VDAC1. (C) Analysis of differential expressions of Tim29, Tim22, Tim9, OPA1, DRP1, MFN1 and SOD2 in Image J. Error bars represent the means ± SD of 3 independent experiments. *P < 0.05. D, E Flow cytometer analysis of the cellular ROS production of OVCAR3-AGK and OVCAR3-shAGK cells through DCFDA/H2DCDA-cellular ROS Assay. Error bars represent the means ± SD of 3 independent experiments. *P < 0.05. F mtDNA (G) Mitochondrial respiration and (H) ATP were analyzed using a mtDNA monitoring primer set, a mitochondrial respiration assay kit and an ATP assay kit respectively. N = 3 independent experiments
Fig. 7
Fig. 7
AGK directly interacts with RPL39. A Scatter plot comparing with global gene-expression profiles of OVCAR3-AGK and OVCAR3-AGK-RNAi cells. B A functional enrichment analysis of KEGG pathways and GO upregulated in OVCAR3-AGK cells compared to OVCAR3-AGK-RNAi. C Streptavidin immunoblot analysis (left panel). A mass spectrometry analysis of Bio-ID assay (right panel). D Co-immunoprecipitation assay revealed that AGK interacted with RPL39 (total protein). E Co-immunoprecipitation assay revealed that AGK interacted with RPL39 in mitochondria (mitochondria protein). F Confocal images for AGK and RPL39 in mitochondria through Mito-Tracker. G, H The correlation between the expression of AGK and RPL39 in patients with EOC through IHC. The expression of AGK was positively correlated with the expression level of RPL39, P < 0.001. I The prognostic value of RPL39 in ovarian cancer series from the same publicly available datasets (http://kmplot.com/analysis/index.php?p= service&cancer = ovar). Kaplan–Meier curves through a univariate analysis (log-rank) of patients with EOC and a high expression of RPL39 (n = 1073) versus those with a low expression of RPL39 (n = 362) for the overall survival
Fig. 8
Fig. 8
RPL39 cooperates with AGK in function. A The silencing of RPL39 in OVCAR3-AGK cells was determined through Western blotting and real-time PCR. The overexpression of RPL39 in OVCAR3-AGK-RNAi cells was confirmed through Western blotting. Cell growth curve (B) and colony formation assay (C) indicated that the growth rate decreased in OVCAR3-AGK-siRPL39 cells and increased in OVCAR3-shAGK-siRPL39 cells. The number of cells on Day 2–6 was normalized to those on Day 1 as a control. The number of colonies was quantified through the colony formation assay. D Transmission electron microscopic analysis of OVCAR3-AGK-siNC and OVCAR3-AGK-siRPL39 cells. Scale bar was 1 μm. G Stably overexpressed and knocked-down RPL39 EOC cell lines (OVCAR3) were detected by WB. H Flow cytometry analysis of annexin V+/PI ¯ cells after the indicated cells were treated with cisplatin (80 μm/ml) for 24 h. Results were expressed as a percentage of total cells. I The dose-dependent curve of cisplatin treatment for OVCAR3-AGK-siNC and OVCAR3-AGK-siRPL39 cells. Error bars represent the means ± SD of 3 independent experiments. *P < 0.05. **P < 0.001. N = 3 independent experiments

Similar articles

Cited by

References

    1. Elsherif SB, Bhosale PR, Lall C, Menias CO, Itani M, Butler KA, et al. Current update on malignant epithelial ovarian tumors. Abdom Radiol (NY) 2021;46:2264–2280. doi: 10.1007/s00261-021-03081-0. - DOI - PubMed
    1. Fessart D, Robert J, Hartog C, Chevet E, Delom F, Babin G. The anterior GRadient (AGR) family proteins in epithelial ovarian cancer. J Exp Clin Cancer Res. 2021;40:271. doi: 10.1186/s13046-021-02060-z. - DOI - PMC - PubMed
    1. Lucidi A, Buca D, Ronsini C, Tinari S, Bologna G, Buca D, et al. Role of extracellular vesicles in epithelial ovarian cancer: a systematic review. Int J Mol Sci. 2020;21:8762. doi: 10.3390/ijms21228762. - DOI - PMC - PubMed
    1. Wu JL, Zhao J, Zhang HB, Zuo WW, Li Y, Kang S. Genetic variants and expression of the TIM-3 gene are associated with clinical prognosis in patients with epithelial ovarian cancer. Gynecol Oncol. 2020;159:270–276. doi: 10.1016/j.ygyno.2020.07.012. - DOI - PubMed
    1. Dzobo K, Senthebane DA, Ganz C, Thomford NE, Wonkam A, Dandara C. Advances in therapeutic targeting of cancer stem cells within the tumor microenvironment: an updated review. Cells. 2020;9:1896. doi: 10.3390/cells9081896. - DOI - PMC - PubMed

MeSH terms