. 2022 Oct;12(10):1814-1827.
doi: 10.1002/2211-5463.13469. Epub 2022 Aug 7.

ERCC5, HES6 and RORA are potential diagnostic markers of coronary artery disease

Affiliations

ERCC5, HES6 and RORA are potential diagnostic markers of coronary artery disease

Zhifeng Bai et al. FEBS Open Bio. 2022 Oct.

Abstract

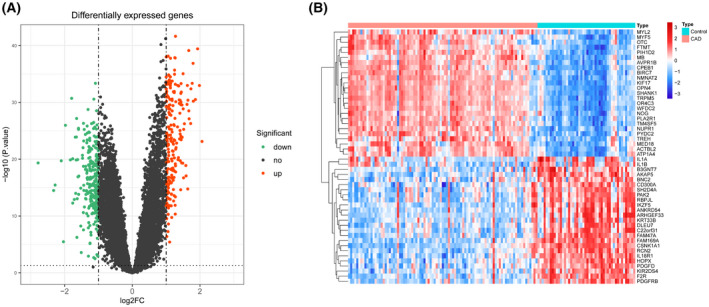
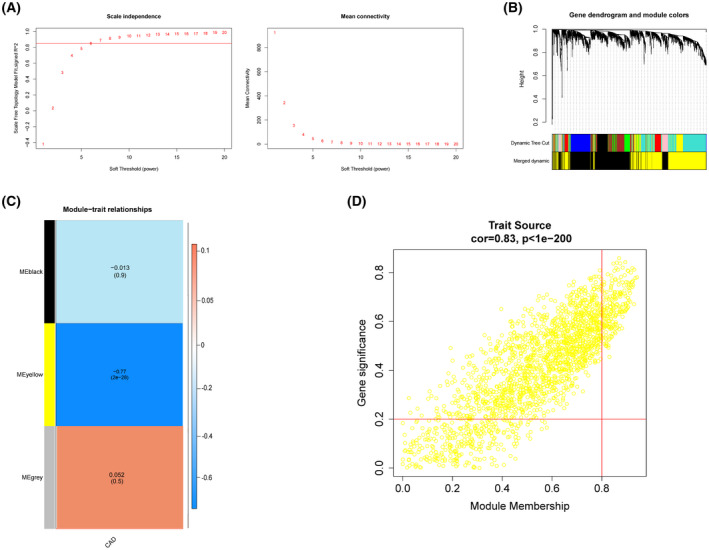
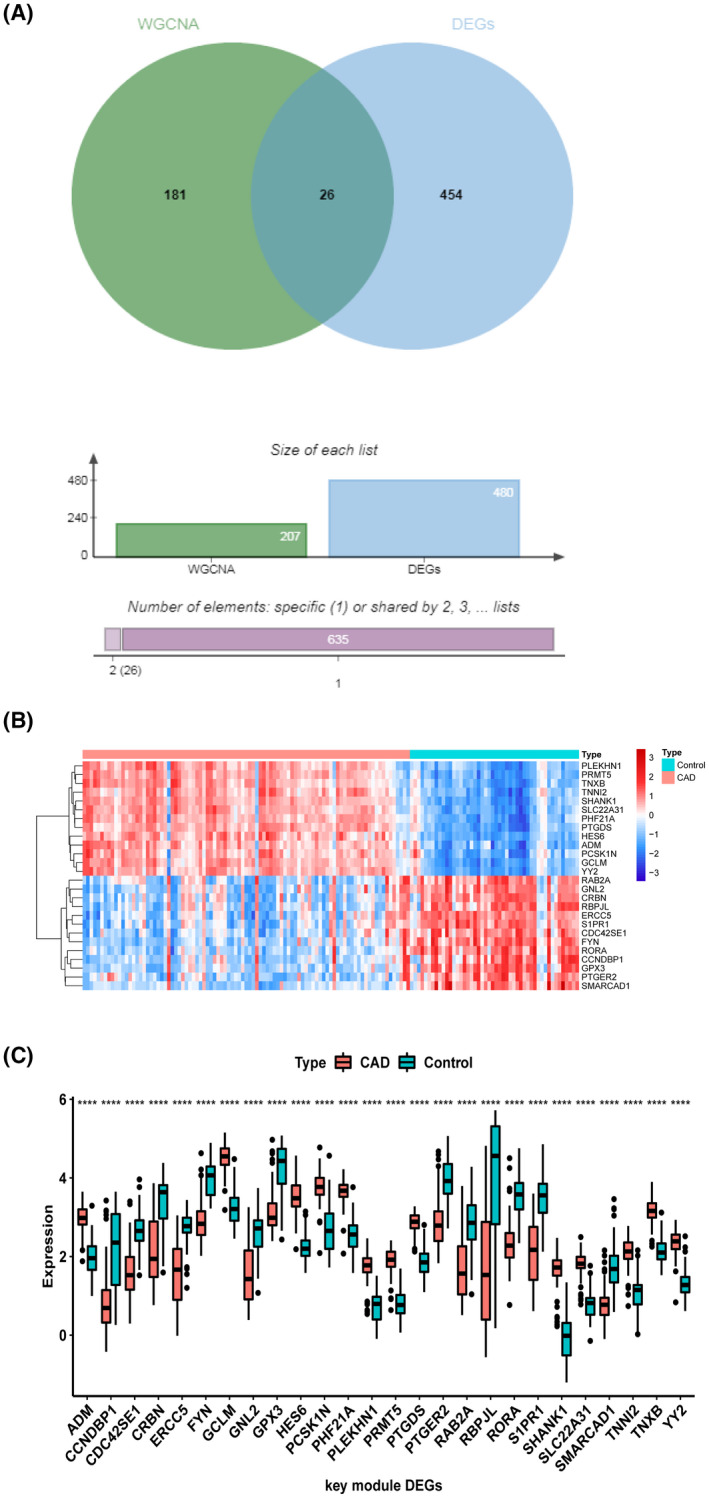
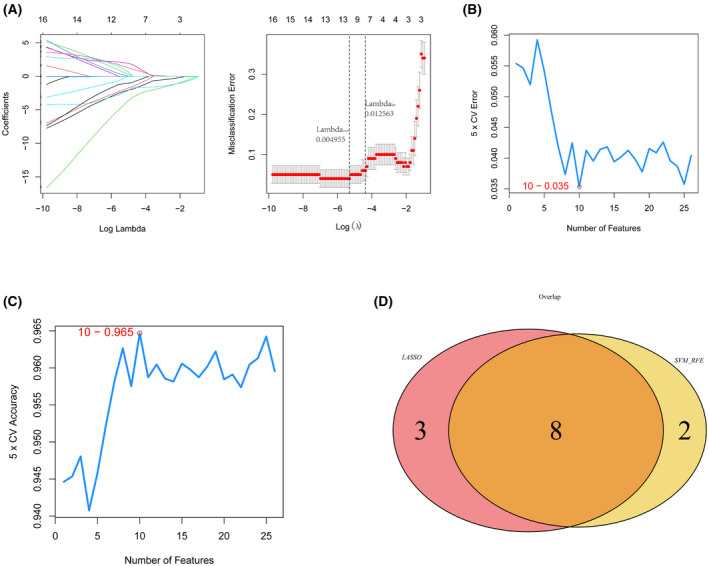
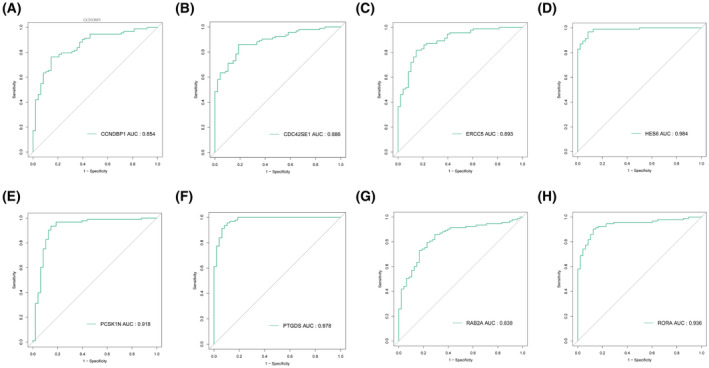
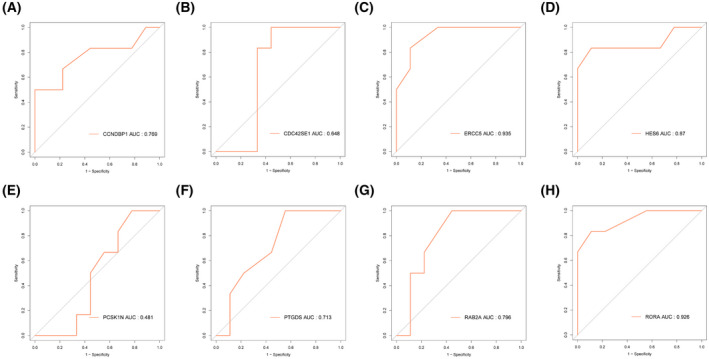
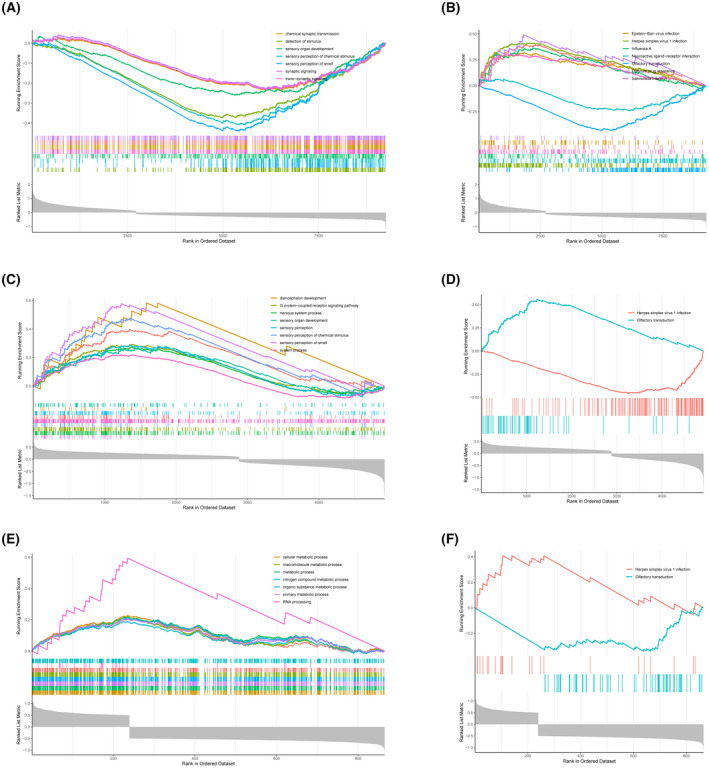
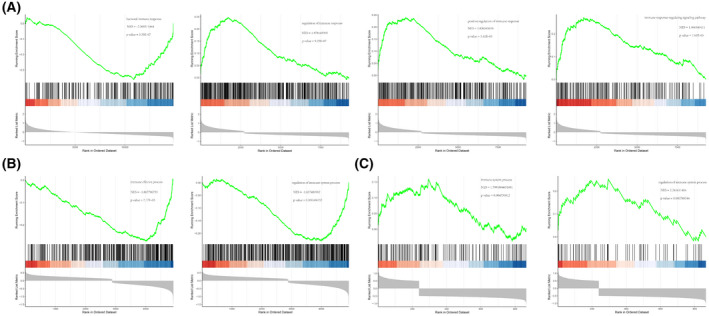
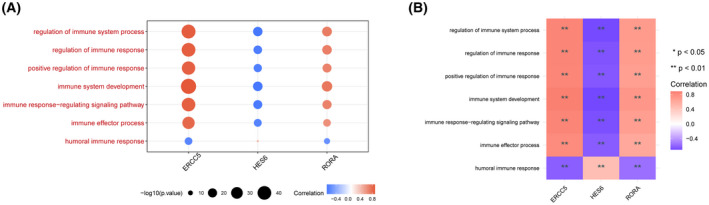
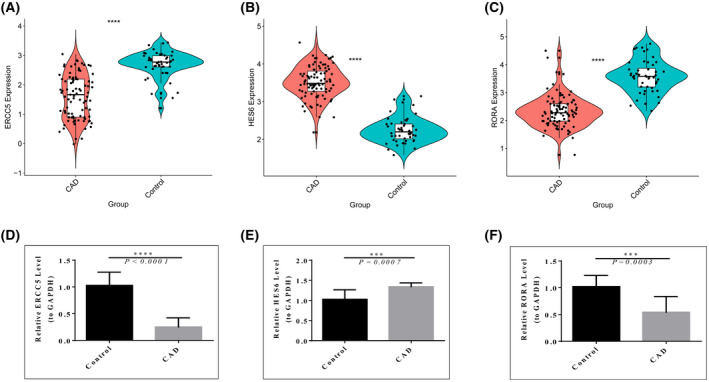
The mortality rate of patients with coronary artery disease (CAD) increases year by year, and the age of onset is decreasing, primarily because of the lack of an efficient and convenient diagnostic method for CAD. In the present study, we aimed to detect CAD-correlated biomarkers and the regulatory pathways involved through weighted co-expression network analysis. The microarray data originated from 93 CAD patients and 48 controls within the Gene Expression Omnibus (GEO) database. The gene network was implemented by weighted gene co-expression network analysis, and the genes were observed to fall into a range of modules. We took the intersection of genes in the modules most correlated with CAD with the differentially expressed genes of CAD, which were identified by applying the limma package. Lasso regression and support vector machine recursive feature elimination algorithms were used to determine CAD candidate signature genes. The biomarkers for diagnosing CAD were detected by validating candidate signature gene diagnostic capabilities (receiver operating characteristic curves) based on data sets from GEO. Three modules were selected, and 26 vital genes were identified. Eight of these genes were reported as the optimal candidate features in terms of CAD diagnosis. Through receiver operating characteristic curve analysis, we identified three genes (ERCC5, HES6 and RORA; area under the curve > 0.8) capable of distinguishing CAD from the control, and observed that these genes are correlated with the immune response. In summary, ERCC5, HES6 and RORA may have potential for diagnosis of CAD.

Keywords: ERCC5; HES6; RORA; bioinformatics; coronary heart disease; diagnostic marker.


Conflict of interest statement

The authors declare that they have no conflicts of interest.

Figures

Fig. 1
Fig. 1
(A) Volcano plot of differentially expressed genes (dots in green and red represent genes with significant differential expression; dots in red indicate that their gene expression was up‐regulated in the CAD samples and dots in green indicate that the gene was down‐regulated in the CAD samples). (B) Differentially expressed gene heatmap (the top 25 up‐ and the top 25 down‐regulated genes) (each small square indicates a gene, with red indicating up‐regulated and blue indicating down‐regulated).
Fig. 2
Fig. 2
CAD highly relevant critical modules. (A) Soft threshold screening [the longitudinal axis of the left figure is scale‐freefitindex (i.e. signedR2) and the square of the correlation coefficient, indicating how close the network is to the scale‐free distribution; the longitudinal axis of the right figure represents all gene adjacency functions in the corresponding gene module]. (B) Merge plots of modules. (C) Heat map of modules versus traits. (D) Correlation analysis between module genes and traits.
Fig. 3
Fig. 3
Vital genes for CAD. (A) Module key gene screen (blue represents genes differentially expressed between CAD/control and green represents WGCNA acquisition of CAD vital module genes). (B) Heat map of expression patterns of module vital genes between CAD patients and controls. (C) Box plots of key gene expression of modules (blue represents control samples and red represents CAD samples). *P < 0.0001.
Fig. 4
Fig. 4
Diagnostic markers of CAD. (A) LASSO regression analysis was conducted to screen the characteristic genes [abscissa deviance indicates the proportion of residual error explained by the model, indicating the correlation between the number of characteristic genes and the proportion of residual error explained (dev), ordinate is the coefficient of the gene (left); abscissa is log (λ), ordinate represents the error of cross‐validation (right)]. (B, C) SVM feature number with error rate and precision rate. (D) The intersection of LASSO feature genes with SVM feature genes.
Fig. 5
Fig. 5
ROC curve validation of candidate diagnostic genes (AUC refers to the surface area under the ROC curve). (A) CCNDBP1, (B) CDC42SE1, (C) ERCC5, (D) HES6, (E) PCSK1N, (F) PTGDS, (G) RAB2A and (H) RORA.
Fig. 6
Fig. 6
ROC curve validation of candidate diagnostic genes in validation set GSE23561. (A) CCNDBP1, (B) CDC42SE1, (C) ERCC5, (D) HES6, (E) PCSK1N, (F) PTGDS, (G) RAB2A and (H) RORA.
Fig. 7
Fig. 7
Functional enrichment of diagnostic genes. (A, B) Single‐gene GSEA of ERCC5 enriched for Gene Ontology‐Biological Process (GO‐BP) and Kyoto Encyclopedia of Genes and Genomes (KEGG) results. (C, D) Single‐gene GSEA of HES6 enriched for GO‐BP and KEGG results. (E, F) Single‐gene GSEA enrichment of GO‐BP and KEGG results for RORA.
Fig. 8
Fig. 8
Immune‐correlated pathways of diagnostic genes. (A) Immune‐correlated pathways of single‐gene GSEA of ERCC5. (B) Immune‐correlated pathways by single‐gene GSEA of HES6. (C) Immune‐correlated pathways of single‐gene GSEA for RORA.
Fig. 9
Fig. 9
Correlations analysis among immune‐related pathways and three diagnostic genes. (A) Bubble plot. (B) Heatmap. Blue indicates positive correlations and red represents negative correlations; a larger circle size reflects a smaller P value, **P < 0.01.
Fig. 10
Fig. 10
Diagnostic gene expression assays. (A–C) The expression of diagnostic genes between CAD and control samples in the GEO data. (D–F) Expression of diagnostic genes between clinical CAD and control samples. Error bars indicate the SEM (n = 10). There was statistical significance in the intergroup rank‐sum test, ***P < 0.001, ****P < 0.0001.

Similar articles

Cited by

References

    1. Madhavan Mahesh V, Gersh Bernard J, Alexander Karen P, Granger Christopher B, Stone Gregg W. Coronary artery disease in patients ≥80 years of age. J Am Coll Cardiol. 2018;71:2015–40. 10.1016/j.jacc.2017.12.068 - DOI - PubMed
    1. Neumann F‐J, Sousa‐Uva M, Ahlsson A, Alfonso F, Banning AP, Benedetto U, et al. 2018 ESC/EACTS guidelines on myocardial revascularization. Eur Heart J. 2019;40:87–165. 10.1093/eurheartj/ehy394 - DOI - PubMed
    1. Koganti S, Eleftheriou D, Brogan PA, Kotecha T, Hong Y, Rakhit RD. Microparticles and their role in coronary artery disease. Int J Cardiol. 2017;230:339–45. 10.1016/j.ijcard.2016.12.108 - DOI - PubMed
    1. Shao C, Wang J, Tian J, Tang Y‐D. Coronary artery disease: from mechanism to clinical practice. In: Wang M, editor. Coronary artery disease: therapeutics and drug discovery. Singapore: Springer Singapore; 2020. p. 1–36. - PubMed
    1. Shimada K. Immune system and atherosclerotic disease heterogeneity of leukocyte subsets participating in the pathogenesis of atherosclerosis. Circ Res. 2009;73:994–1001. - PubMed

MeSH terms