

On the relevance of prognostic information for clinical trials: A theoretical quantification
- PMID: 35934915
- PMCID: PMC10087947
- DOI: 10.1002/bimj.202100349
On the relevance of prognostic information for clinical trials: A theoretical quantification
Abstract
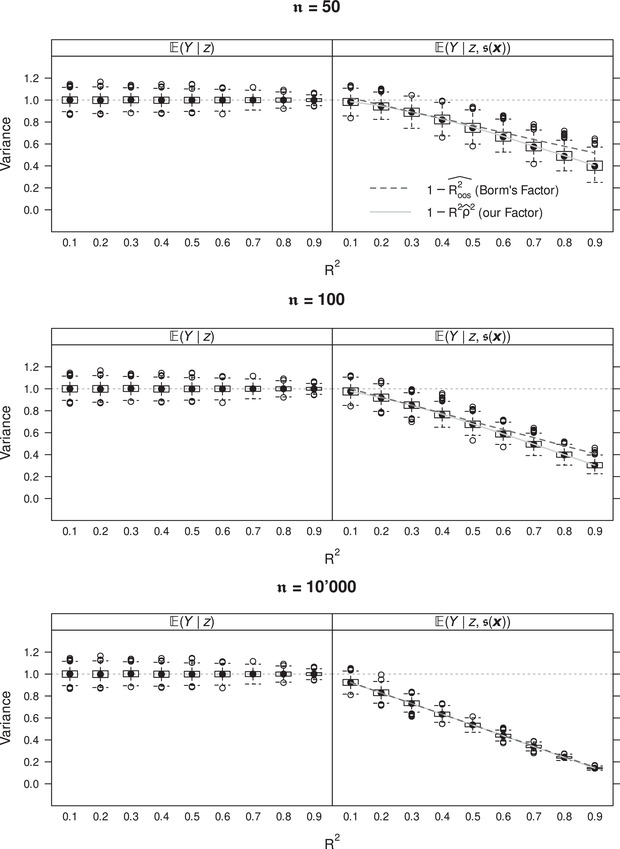
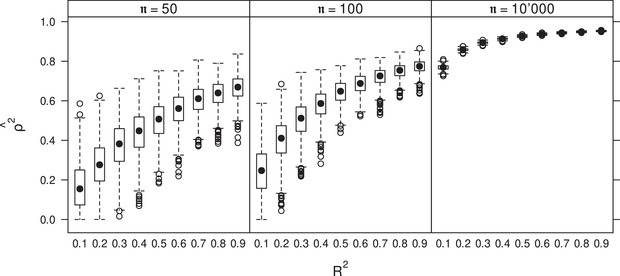
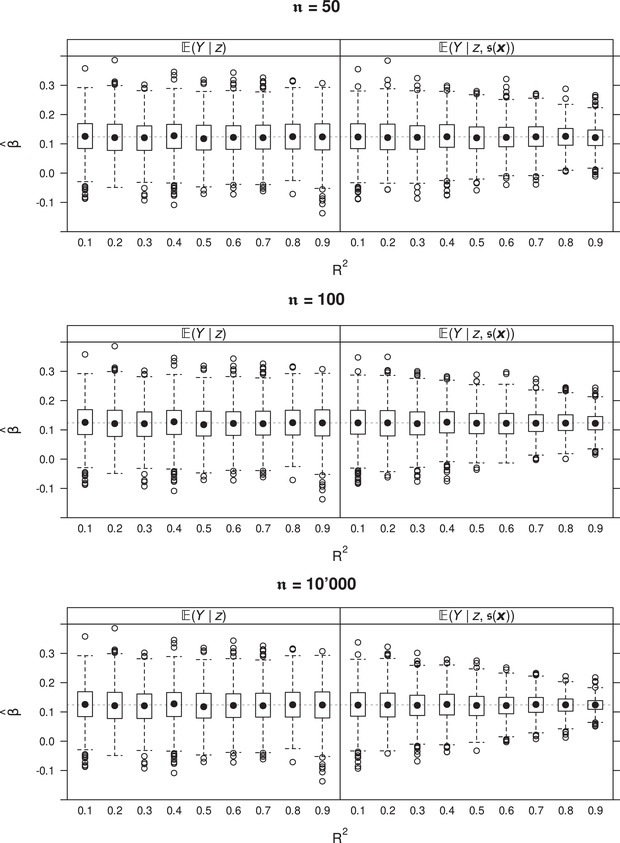
The question of how individual patient data from cohort studies or historical clinical trials can be leveraged for designing more powerful, or smaller yet equally powerful, clinical trials becomes increasingly important in the era of digitalization. Today, the traditional statistical analyses approaches may seem questionable to practitioners in light of ubiquitous historical prognostic information. Several methodological developments aim at incorporating historical information in the design and analysis of future clinical trials, most importantly Bayesian information borrowing, propensity score methods, stratification, and covariate adjustment. Adjusting the analysis with respect to a prognostic score, which was obtained from some model applied to historical data, received renewed interest from a machine learning perspective, and we study the potential of this approach for randomized clinical trials. In an idealized situation of a normal outcome in a two-arm trial with 1:1 allocation, we derive a simple sample size reduction formula as a function of two criteria characterizing the prognostic score: (1) the coefficient of determination R2 on historical data and (2) the correlation ρ between the estimated and the true unknown prognostic scores. While maintaining the same power, the original total sample size n planned for the unadjusted analysis reduces to in an adjusted analysis. Robustness in less ideal situations was assessed empirically. We conclude that there is potential for substantially more powerful or smaller trials, but only when prognostic scores can be accurately estimated.
Keywords: clinical trials; covariate adjustment; machine learning; prognostic covariates; sample size reduction.
© 2022 The Authors. Biometrical Journal published by Wiley-VCH GmbH.
Conflict of interest statement
The authors have declared no conflict of interest.
Figures
Similar articles
-
Bayesian adaptive randomization design incorporating propensity score-matched historical controls.Pharm Stat. 2022 Sep;21(5):1074-1089. doi: 10.1002/pst.2203. Epub 2022 Mar 12. Pharm Stat. 2022. PMID: 35278032
-
Leveraging historical data into oncology development programs: Two case studies of phase 2 Bayesian augmented control trial designs.Pharm Stat. 2020 May;19(3):276-290. doi: 10.1002/pst.1990. Epub 2020 Jan 5. Pharm Stat. 2020. PMID: 31903699
-
Propensity score-integrated Bayesian prior approaches for augmented control designs: a simulation study.J Biopharm Stat. 2022 Jan 2;32(1):170-190. doi: 10.1080/10543406.2021.2011743. Epub 2021 Dec 23. J Biopharm Stat. 2022. PMID: 34939894
-
Use of historical control data for assessing treatment effects in clinical trials.Pharm Stat. 2014 Jan-Feb;13(1):41-54. doi: 10.1002/pst.1589. Epub 2013 Aug 5. Pharm Stat. 2014. PMID: 23913901 Free PMC article. Review.
-
Comparative Study of Bayesian Information Borrowing Methods in Oncology Clinical Trials.JCO Precis Oncol. 2022 Mar;6:e2100394. doi: 10.1200/PO.21.00394. JCO Precis Oncol. 2022. PMID: 35263169 Free PMC article. Review.
Cited by
-
Predicted natural progression as an Alzheimer's prognostic covariate improves the precision of lecanemab efficacy assessments and clinical trial efficiency.Alzheimers Dement. 2025 Mar;21(3):e70045. doi: 10.1002/alz.70045. Alzheimers Dement. 2025. PMID: 40042496 Free PMC article.
-
The analysis of continuous data from n-of-1 trials using paired cycles: a simple tutorial.Trials. 2024 Feb 16;25(1):128. doi: 10.1186/s13063-024-07964-7. Trials. 2024. PMID: 38365817 Free PMC article.
-
Development and validation of a clinical prognosis prediction model for malignant intestinal obstruction: A retrospective cohort study.Sci Rep. 2025 Apr 4;15(1):11550. doi: 10.1038/s41598-025-96593-4. Sci Rep. 2025. PMID: 40185941 Free PMC article.
-
Increasing Power in Phase III Oncology Trials With Multivariable Regression: An Empirical Assessment of 535 Primary End Point Analyses.JCO Clin Cancer Inform. 2024 Sep;8:e2400102. doi: 10.1200/CCI.24.00102. JCO Clin Cancer Inform. 2024. PMID: 39213473
References
-
- Anonymous (2022). Draft qualification opinion for prognostic covariate adjustment (PROCOVA ) . EMA/SA/0000059571, European Medicines Agency. https://www.ema.europa.eu
-
- Athey, S. , & Imbens, G. (2017). The econometrics of randomized experiments. In Banerjee A. V., and Duflo E., (Eds.), Handbook of economic field experiments, (Vol. 1, pp. 73–140). North‐Holland. 10.1016/bs.hefe.2016.10.003 - DOI
Publication types
MeSH terms
Grants and funding
LinkOut - more resources
Full Text Sources
Other Literature Sources
