

Study of CD27, CD38, HLA-DR and Ki-67 immune profiles for the characterization of active tuberculosis, latent infection and end of treatment
- PMID: 35935194
- PMCID: PMC9354672
- DOI: 10.3389/fmicb.2022.885312
Study of CD27, CD38, HLA-DR and Ki-67 immune profiles for the characterization of active tuberculosis, latent infection and end of treatment
Abstract
Background: Current blood-based diagnostic tools for TB are insufficient to properly characterize the distinct stages of TB, from the latent infection (LTBI) to its active form (aTB); nor can they assess treatment efficacy. Several immune cell biomarkers have been proposed as potential candidates for the development of improved diagnostic tools.
Objective: To compare the capacity of CD27, HLA-DR, CD38 and Ki-67 markers to characterize LTBI, active TB and patients who ended treatment and resolved TB.
Methods: Blood was collected from 45 patients defined according to clinical and microbiological criteria as: LTBI, aTB with less than 1 month of treatment and aTB after completing treatment. Peripheral blood mononuclear cells were stimulated with ESAT-6/CFP-10 or PPD antigens and acquired for flow cytometry after labelling with conjugated antibodies against CD3, CD4, CD8, CD27, IFN-γ, TNF-α, CD38, HLA-DR, and Ki-67. Conventional and multiparametric analyses were done with FlowJo and OMIQ, respectively.
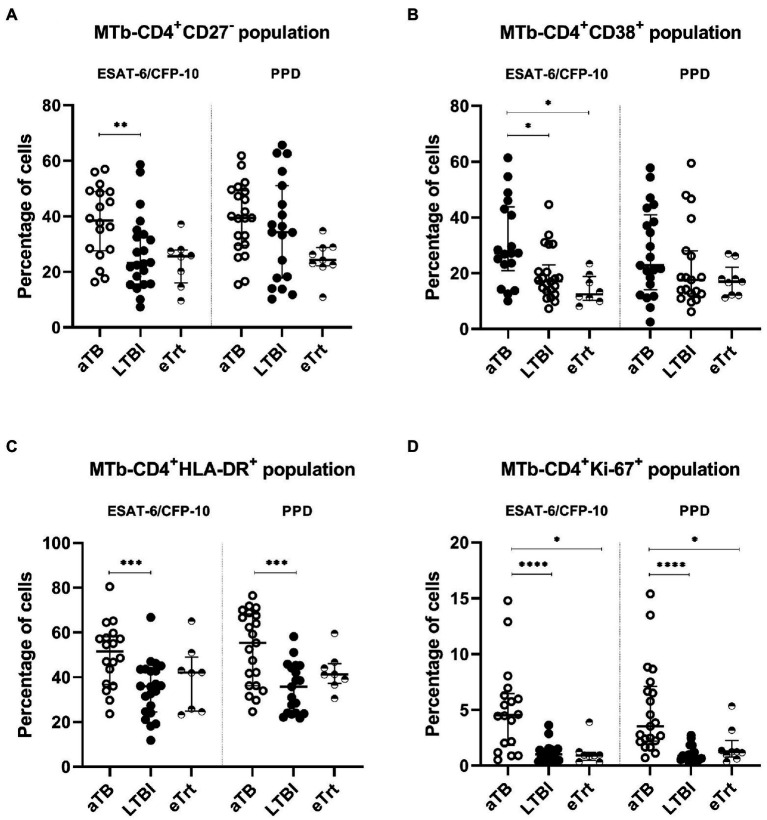
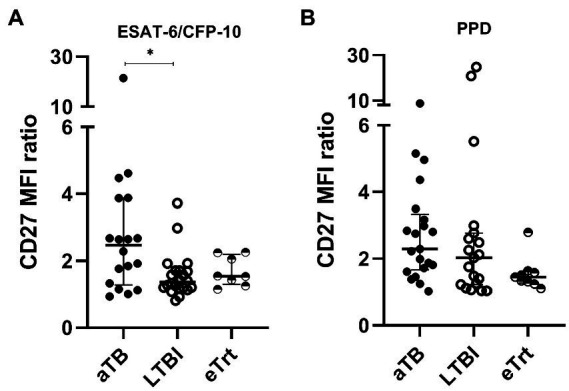
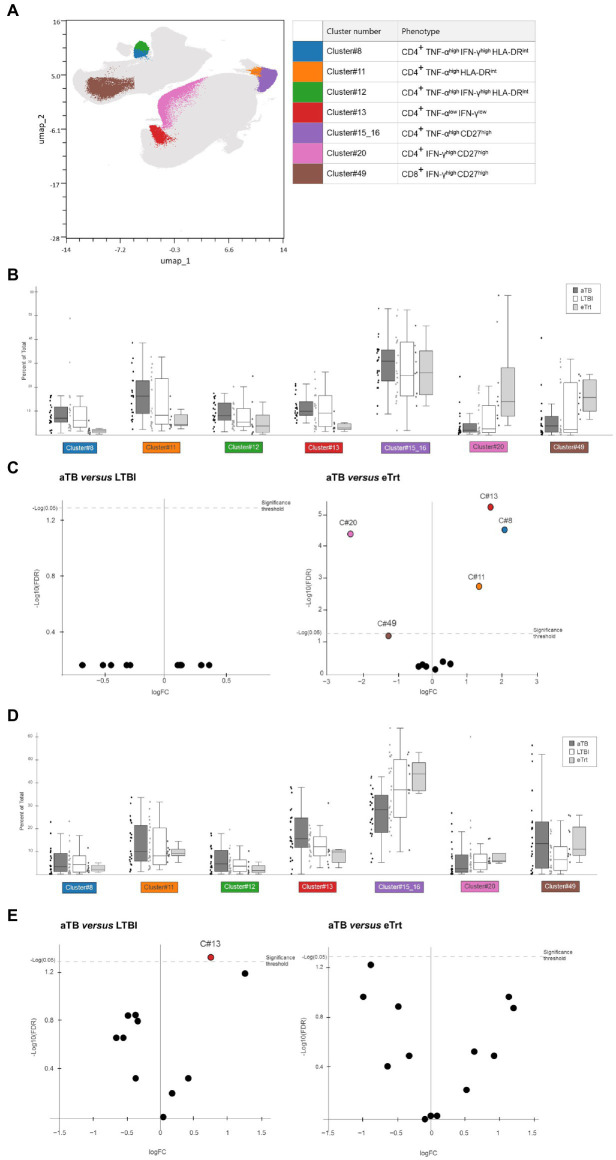
Results: The expression of CD27, CD38, HLA-DR and Ki-67 markers was analyzed in CD4+ T-cells producing IFN-γ and/or TNF-α cytokines after ESAT-6/CFP-10 or PPD stimulation. Within antigen-responsive CD4+ T-cells, CD27- and CD38+ (ESAT-6/CFP-10-specific), and HLA-DR+ and Ki-67+ (PPD- and ESAT-6/CFP-10-specific) populations were significantly increased in aTB compared to LTBI. Ki-67 demonstrated the best discriminative performance as evaluated by ROC analyses (AUC > 0.9 after PPD stimulation). Data also points to a significant change in the expression of CD38 (ESAT-6/CFP-10-specific) and Ki-67 (PPD- and ESAT-6/CFP-10-specific) after ending the anti-TB treatment regimen. Furthermore, ratio based on the CD27 median fluorescence intensity in CD4+ T-cells over Mtb-specific CD4+ T-cells showed a positive association with aTB over LTBI (ESAT-6/CFP-10-specific). Additionally, multiparametric FlowSOM analyses revealed an increase in CD27 cell clusters and a decrease in HLA-DR cell clusters within Mtb-specific populations after the end of treatment.
Conclusion: Our study independently confirms that CD27-, CD38+, HLA-DR+ and Ki-67+ populations on Mtb-specific CD4+ T-cells are increased during active TB disease. Multiparametric analyses unbiasedly identify clusters based on CD27 or HLA-DR whose abundance can be related to treatment efficacy. Further studies are necessary to pinpoint the convergence between conventional and multiparametric approaches.
Keywords: Mycobacterium tuberculosis; T-cells; activation markers; cluster; flow cytometry; immune response; multiparametric analysis; treatment.
Copyright © 2022 Díaz-Fernández, Villar-Hernández, Stojanovic, Fernández, Galvão, Tolosa, Sánchez-Montalva, Abad, Jiménez-Fuentes, Safont, Romero, Sabrià, Prat, Domínguez and Latorre.
Conflict of interest statement
The authors declare that the research was conducted in the absence of any commercial or financial relationships that could be construed as a potential conflict of interest.
Figures
Similar articles
-
Study of CD27 and CCR4 Markers on Specific CD4+ T-Cells as Immune Tools for Active and Latent Tuberculosis Management.Front Immunol. 2019 Jan 9;9:3094. doi: 10.3389/fimmu.2018.03094. eCollection 2018. Front Immunol. 2019. PMID: 30687314 Free PMC article.
-
Activation Phenotype of Mycobacterium tuberculosis-Specific CD4+ T Cells Promoting the Discrimination Between Active Tuberculosis and Latent Tuberculosis Infection.Front Immunol. 2021 Aug 26;12:721013. doi: 10.3389/fimmu.2021.721013. eCollection 2021. Front Immunol. 2021. PMID: 34512645 Free PMC article.
-
Changes of Mycobacterium tuberculosis specific antigen-stimulated CD27-CD38+IFN-γ+CD4+ T cells before and after anti-tuberculosis treatment.Eur J Med Res. 2024 Mar 1;29(1):147. doi: 10.1186/s40001-024-01713-x. Eur J Med Res. 2024. PMID: 38429734 Free PMC article.
-
[Evolution of IGRA researches].Kekkaku. 2008 Sep;83(9):641-52. Kekkaku. 2008. PMID: 18979999 Review. Japanese.
-
[Characteristics of a diagnostic method for tuberculosis infection based on whole blood interferon-gamma assay].Kekkaku. 2006 Nov;81(11):681-6. Kekkaku. 2006. PMID: 17154047 Review. Japanese.
Cited by
-
In Experimental Tuberculosis Infection, the Bacteriostatic Function of Macrophages Is Activated by Th1 CD4+ T-Effectors in a Nitrite-Independent Manner.Int J Mol Sci. 2025 Jul 8;26(14):6573. doi: 10.3390/ijms26146573. Int J Mol Sci. 2025. PMID: 40724823 Free PMC article.
-
Circulating CD8 T cells from patients with mild-to-moderate psoriasis are functionally impaired.Front Immunol. 2025 May 5;16:1585378. doi: 10.3389/fimmu.2025.1585378. eCollection 2025. Front Immunol. 2025. PMID: 40391222 Free PMC article.
-
Active tuberculosis patients have high systemic IgG levels and B-cell fingerprinting, characterized by a reduced capacity to produce IFN-γ or IL-10 as a response to M.tb antigens.Front Immunol. 2023 Oct 26;14:1263458. doi: 10.3389/fimmu.2023.1263458. eCollection 2023. Front Immunol. 2023. PMID: 38022616 Free PMC article.
References
-
- Ahmed M. I. M., Ntinginya N. E., Kibiki G., Mtafya B. A., Semvua H., Mpagama S., et al. . (2018). Phenotypic changes on mycobacterium tuberculosis-specific CD4 T cells as surrogate markers for tuberculosis treatment efficacy. Front. Immunol. 9:2247. doi: 10.3389/fimmu.2018.02247, PMID: - DOI - PMC - PubMed
-
- Amiano N. O., Morelli M. P., Pellegrini J. M., Tateosian N. L., Rolandelli A., Seery V., et al. . (2020). IFN-γ and IgG responses to Mycobacterium tuberculosis latency antigen Rv2626c differentiate remote from recent tuberculosis infection. Sci. Rep. 10:7472. doi: 10.1038/s41598-020-64428-z - DOI - PMC - PubMed
LinkOut - more resources
Full Text Sources
Research Materials
Miscellaneous