. 2022 Jul 22:13:957158.
doi: 10.3389/fmicb.2022.957158. eCollection 2022.

Biomarker enrichment medium: A defined medium for metabolomic analysis of microbial pathogens

Affiliations

Biomarker enrichment medium: A defined medium for metabolomic analysis of microbial pathogens

Maryam Mapar et al. Front Microbiol. .

Abstract

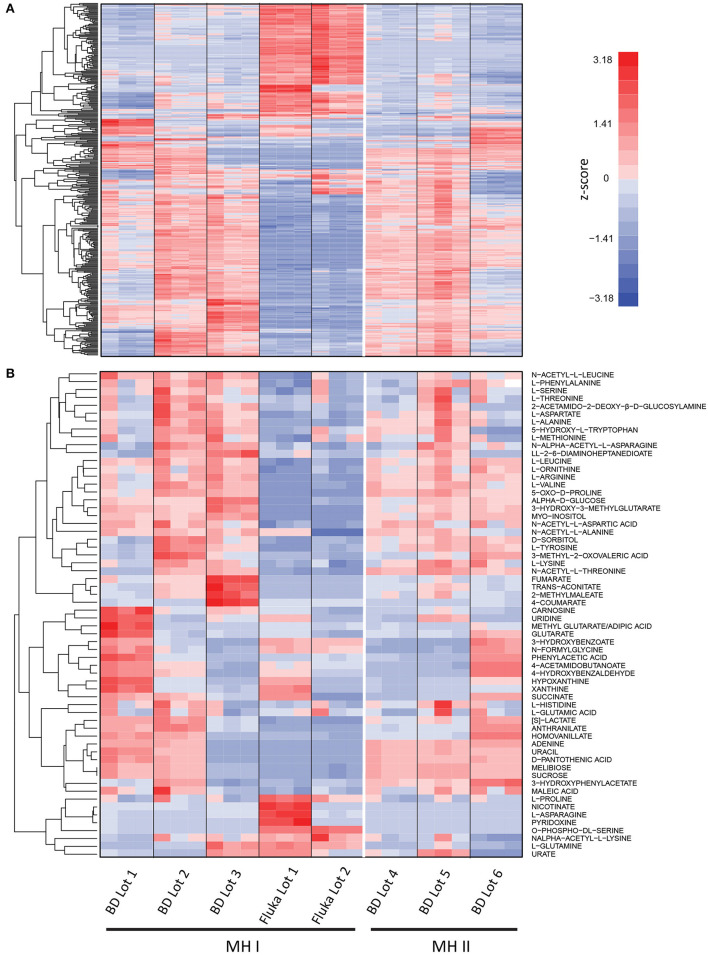
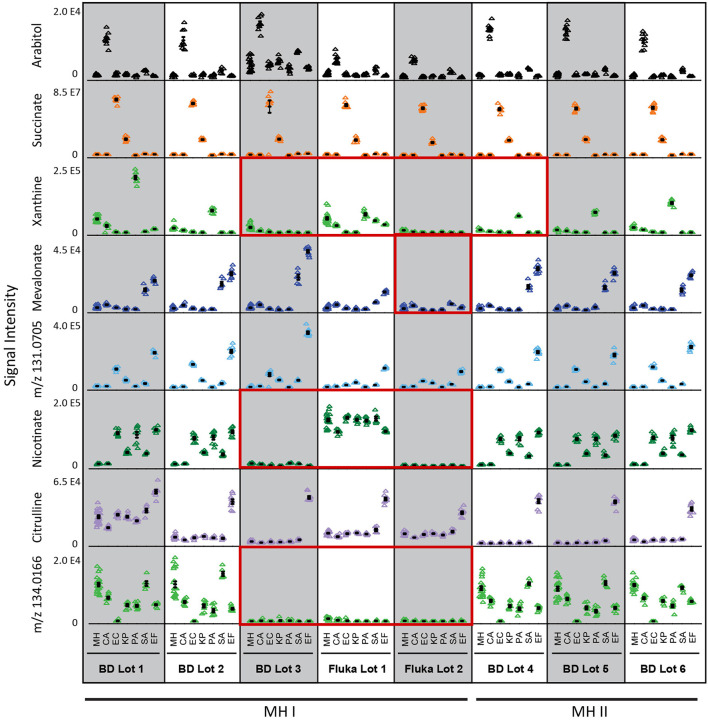
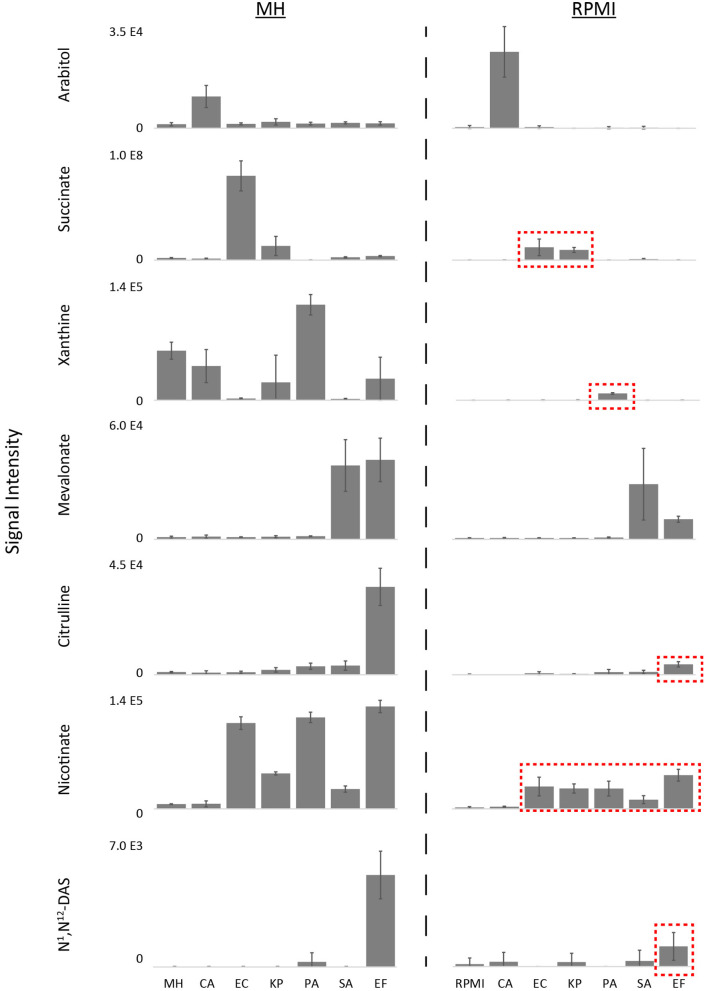
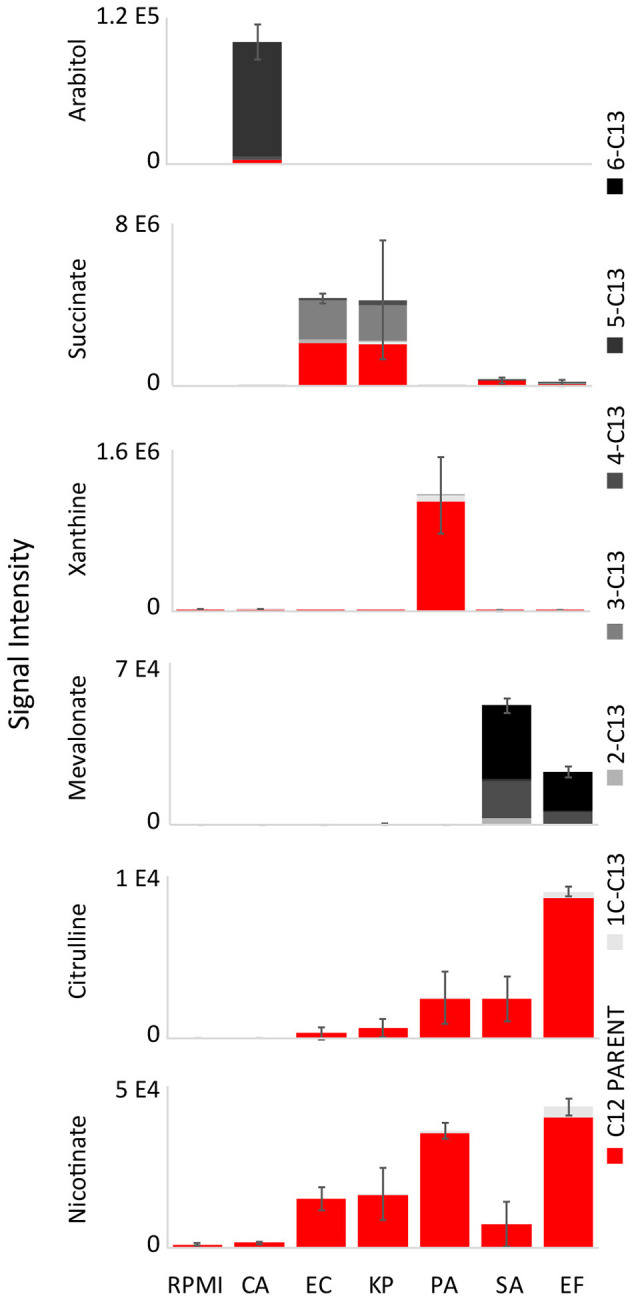
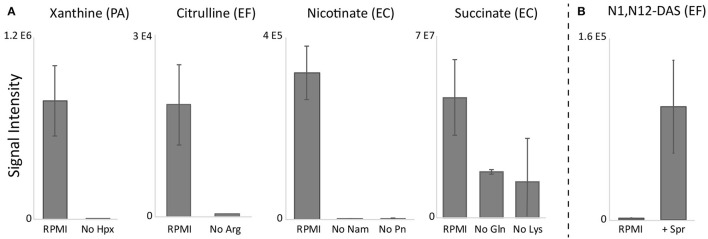
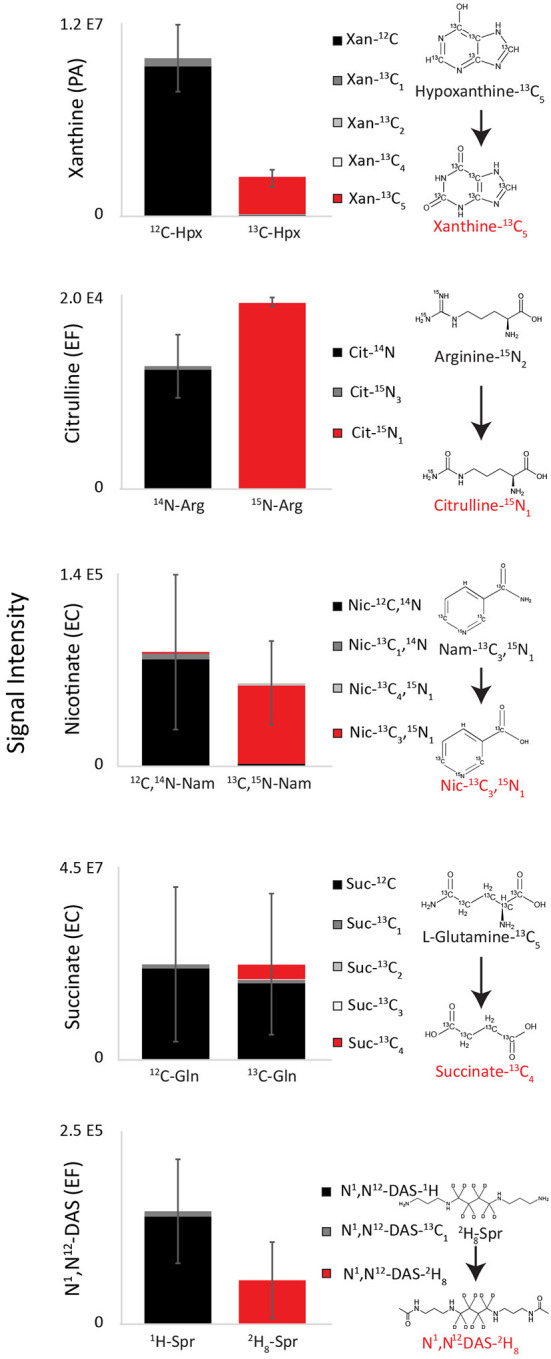
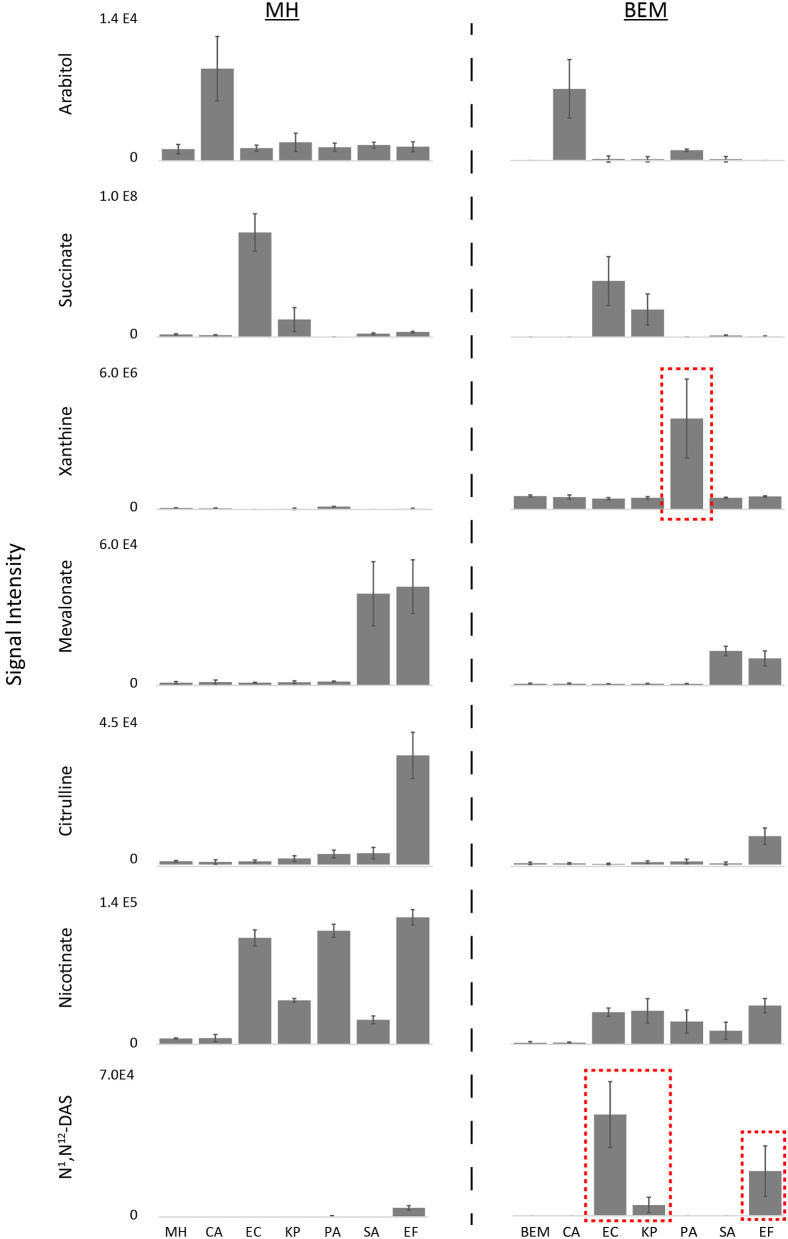
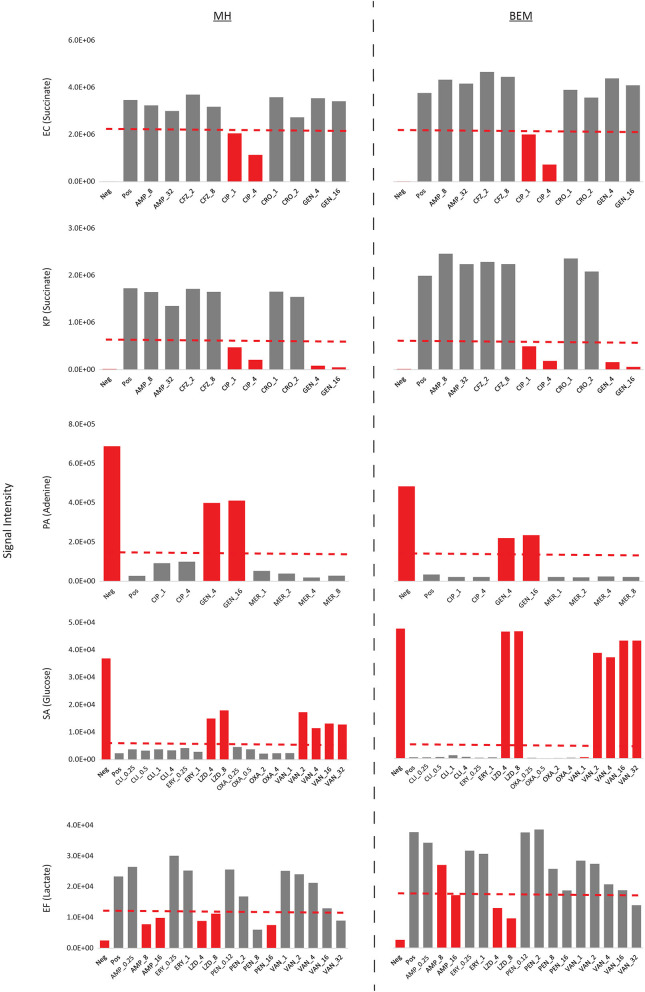
Microbes have diverse metabolic capabilities and differences in these phenotypes are critical for differentiating strains, species, and broader taxa of microorganisms. Recent advances in liquid chromatography-mass spectrometry (LC-MS) allow researchers to track the complex combinations of molecules that are taken up by each cell type and to quantify the rates that individual metabolites enter or exit the cells. This metabolomics-based approach allows complex metabolic phenotypes to be captured in a single assay, enables computational models of microbial metabolism to be constructed, and can serve as a diagnostic approach for clinical microbiology. Unfortunately, metabolic phenotypes are directly affected by the molecular composition of the culture medium and many traditional media are subject to molecular-level heterogeneity. Herein, we show that commercially sourced Mueller Hinton (MH) medium, a Clinical and Laboratory Standards Institute (CLSI) approved medium for clinical microbiology, has significant lot-to-lot and supplier-to-supplier variability in the concentrations of individual nutrients. We show that this variability does not affect microbial growth rates but does affect the metabolic phenotypes observed in vitro-including metabolic phenotypes that distinguish six common pathogens. To address this, we used a combination of isotope-labeling, substrate exclusion, and nutritional supplementation experiments using Roswell Park Memorial Institute (RPMI) medium to identify the specific nutrients used by the microbes to produce diagnostic biomarkers, and to formulate a Biomarker Enrichment Medium (BEM) as an alternative to complex undefined media for metabolomics research, clinical diagnostics, antibiotic susceptibility testing, and other applications where the analysis of stable microbial metabolic phenotypes is important.

Keywords: LC-MS; Mueller Hinton; biomarker enrichment medium; biomarkers; metabolomics.


Figures

Figure 1
Figure 1
Mass spectrometry analysis of different lots and suppliers of Mueller Hinton (MH I) and cation adjusted Mueller Hinton (MH II) medium. (A) Untargeted analysis identified significant differences (p < 1 × 10⁻⁵) in 359 features were observed in at least one lot of medium (n = 3). (B) Targeted UHPLC-MS analysis identified variability in concentrations of many common microbial nutrients, including various amino acids, nucleotides, and sugars. Signal intensities are shown as z-scores (i.e., mean centered, variance stabilized signal intensities). See Source Data File 1.
Figure 2
Figure 2
Differential biomarker production used to differentiate the six common species responsible for bloodstream infections incubated in different batches of MH medium. Three of the eight batches studies (BD Lot 3, and Fluka Lots 1 and 2) showed greatest inconsistencies with regards to species-specific production of xanthine, nicotinate, and mevalonate (Fluka Lot 2 only), and initial medium levels of unassigned marker with m/z 134.0166 (Source Data File 2). Key biomarkers that are affected by certain lots of media have been highlighted in red boxes. MH, Mueller Hinton medium; CA, Candida albicans; KP, Klebsiella pneumoniae; EC, Escherichia coli; PA, Pseudomonas aeruginosa; SA, Staphylococcus aureus; EF, Enterococcus faecalis. Data represents n = 9 biological replicates.
Figure 3
Figure 3
Differential biomarker production of pathogens incubated in MH vs.RPMI medium. While most production biomarkers were observed on MH and RPMI, levels of succinate, xanthine, citrulline, and nicotinate were significantly lower on RPMI, and N1,N12-diacetylspermine production on RPMI did not meet diagnostic thresholds (Source Data File 3). Key biomarkers that are affected by medium have been highlighted in red boxes. MH, Mueller Hinton medium; RPMI, Roswell Park Memorial Institute medium; CA, Candida albicans; KP, Klebsiella pneumoniae; EC, Escherichia coli; PA, Pseudomonas aeruginosa; SA, Staphylococcus aureus; EF, Enterococcus faecalis. Data are presented as mean values +/− SD of n = 4 replicates.
Figure 4
Figure 4
13C isotope labeling patterns of top diagnostic biomarkers when isolates were grown on RPMI supplemented with [U-13C]glucose. Labeling patterns show that glucose is the primary precursor for arabitol and mevalonate, and partially responsible for succinate production (Source Data File 4). Urocanate, xanthine, citrulline, and nicotinate are fully unlabeled, and thus must be derived from other carbon sources present in the medium. RPMI, Roswell Park Memorial Institute medium; CA, Candida albicans; KP, Klebsiella pneumoniae; EC, Escherichia coli; PA, Pseudomonas aeruginosa; SA, Staphylococcus aureus; EF, Enterococcus faecalis. Data are presented as mean values +/− SD of total signal of n = 3 replicates.
Figure 5
Figure 5
RPMI precursor exclusion (A) and supplementation (B) results. Exclusion of hypoxanthine (Hpx), arginine (Arg), and nicotinamide (Nam) or pyridoxine (Pn) in RPMI eliminated species-specific production of xanthine, citrulline, and nicotinate, respectively, while exclusion of glutamine (Gln) and lysine (Lys) decreased EC succinate production. Supplementation of RPMI with spermine restored N1,N12-diacetylspermine (N1,N12-DAS) production. RPMI, Roswell Park Memorial Institute medium; PA, Pseudomonas aeruginosa; EF, Enterococcus faecalis; EC, Escherichia coli. Data are presented as mean values +/− SD of n = 3 replicates.
Figure 6
Figure 6
Labeling patterns of top diagnostic biomarkers when isolates were grown on RPMI supplemented with putative precursors. Species-specific xanthine, citrulline, nicotinate, and N1,N12-diacetylspermine were all >95% labeled when labeled substrates were used, demonstrating that that hypoxanthine, arginine, nicotinamide, and spermine are direct medium precursors for xanthine, citrulline, nicotinate, and N1,N12-diacetylspermine (Source Data File 6). EC cultured in RPMI with unlabeled glucose and uniformly labeled L-glutamine-13C5 was 80% fully 12C labeled and 15% fully 13C4 labeled, demonstrating that it is mostly synthesized from glucose, although glutamine partially contributes to its production as well. Hpx, Hypoxanthine; Arg, arginine; Nam, nicotinamide; Gln, glutamine; Spr, spermine; PA, Pseudomonas aeruginosa; EF, Enterococcus faecalis; EC, Escherichia coli. Data are presented as mean values +/− SD of n = 3 replicates.
Figure 7
Figure 7
Differential biomarker production of pathogens incubated in MH vs. defined BEM medium. Metabolic phenotypes of MH were reproduced in BEM. Notably, supplementation of hypoxanthine in BEM improved PA xanthine levels and addition of spermine resulted in improved N1,N12-diacetylspermine production by EF, as well as EC and KP (Source Data File 3). Key biomarkers that are affected by medium have been highlighted in red boxes. MH, Mueller Hinton medium; BEM, Biomarker Enrichment Medium; CA, Candida albicans; KP, Klebsiella pneumoniae; EC, Escherichia coli; PA, Pseudomonas aeruginosa; SA, Staphylococcus aureus; EF, Enterococcus faecalis. Data are presented as mean values +/− SD of n = 3 replicates.
Figure 8
Figure 8
Antibiotic susceptibility validation on BEM and MH II using metabolic inhibition profiles. Metabolic inhibition of select biomarkers in response to antibiotics were tested on bacterial isolates with known microdilution or Vitek2 AST profiles. Inhibition of biomarker production/consumption were in general agreement with microbroth dilution/Vitek2 calls, correctly identifying sensitive (gray bars) and resistant strains (red bars). Furthermore, changes in biomarker levels in both media were comparable. Sensitive vs. resistant threshold cutoffs are indicated in dashed red lines. Concentrations in antibiotics are provided as μg/mL. Neg, uninoculated medium control; Pos, inoculated control with no added antibiotics; AMP, ampicillin; CFZ, cefazolin; CIP, ciprofloxacin; CRO, ceftriaxone; GEN, gentamicin; MER, meropenem; CLI, clindamycin; ERY, erythromycin; LZD, linezolid; OXA, oxacillin; VAN, vancomycin; PEN, benzylpenicillin.

Similar articles

Cited by

References

    1. Basile A., Campanaro S., Kovalovszki A., Zampieri G., Rossi A., Angelidaki I., et al. . (2020). Revealing metabolic mechanisms of interaction in the anaerobic digestion microbiome by flux balance analysis. Metab. Eng. 62, 138–149. 10.1016/j.ymben.2020.08.013 - DOI - PubMed
    1. Berger F., Ramirez-Hernández M. A. H., Ziegler M. (2004). The new life of a centenarian: signalling functions of NAD (P). Trends Biochem. Sci. 29, 111–118. 10.1016/j.tibs.2004.01.007 - DOI - PubMed
    1. Bortolotti M., Polito L., Battelli M. G., Bolognesi A. (2021). Xanthine oxidoreductase: One enzyme for multiple physiological tasks. Redox Biology 41, 101882. 10.1016/j.redox.2021.101882 - DOI - PMC - PubMed
    1. Clinical and Laboratory Standards Institute . (2022). M100: Performance Standards for Antimicrobial Susceptibility Testing, 32nd Edn. p. 1–362.
    1. Cocaign-Bousquet M., Garrigues C., Novak L., Lindley N., Loublere P. (1995). Rational development of a simple synthetic medium for the sustained growth of Lactococcus lactis. J. Appl. Bacteriol. 79, 108–116. 10.1111/j.1365-2672.1995.tb03131.x - DOI

LinkOut - more resources