

Differential gene expression analysis after DAPK1 knockout in hepatocellular carcinoma cells
- PMID: 35935258
- PMCID: PMC9354754
- DOI: 10.7717/peerj.13711
Differential gene expression analysis after DAPK1 knockout in hepatocellular carcinoma cells
Abstract
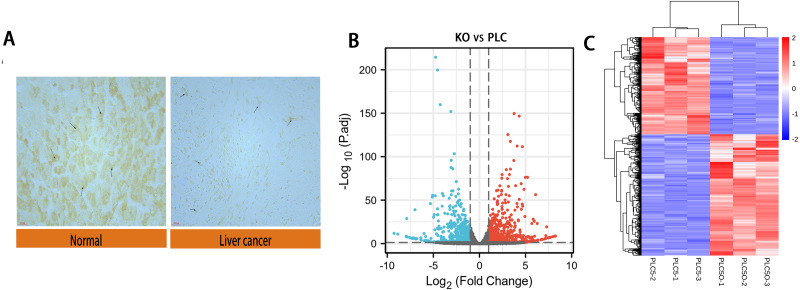
Background: The mechanism through which death-associated protein kinase 1 (DAPK1) causes hepatocellular carcinoma (HCC) progression remains unclear. In this study, we aimed to identify key proteins that were altered after DAPK1 knockout.
Methods: Stable DAPK1 knockout HCC cell lines were established, then the differentially expressed genes (DEGs) of HCC were screened using the NetworkAnalyst database and enriched using the Metascape software. Protein-protein interaction networks (PPIs) were analyzed and visualized using the STRING database expansion.
Results: In total, 732 differentially expressed genes were identified, including 415 upregulated genes and 317 downregulated genes. Through Cytoscape software scoring, 10 pivotal genes were found to be closely related to changes in DAPK1 expression; Kininogen-1 (KNG1), Complement C3 (C3), Metalloproteinase inhibitor 1 (TIMP1), and Alpha-2-HS-glycoprotein (AHSG) were the most strongly associated with DAPK1 expression changes. Moreover, western blot analysis results revealed that changes in the levels of proteins encoded by the four key genes after DAPK1 knockout were consistent with those seen in the database screening.
Conclusions: These results provide a direction for further studies on the DAPK1 gene and on the mechanism through which DAPK1 leads to hepatocellular carcinoma development.
Keywords: Bioinformatics analysis; DAPK1; Differential gene; Hepatocellular carcinoma; Related gene.
©2022 Li et al.
Conflict of interest statement
The authors declare there are no competing interests.
Figures


Similar articles
-
Identifying hepatocellular carcinoma-related hub genes by bioinformatics analysis and CYP2C8 is a potential prognostic biomarker.Gene. 2019 May 25;698:9-18. doi: 10.1016/j.gene.2019.02.062. Epub 2019 Feb 27. Gene. 2019. PMID: 30825595
-
The identification of key genes and pathways in hepatocellular carcinoma by bioinformatics analysis of high-throughput data.Med Oncol. 2017 Jun;34(6):101. doi: 10.1007/s12032-017-0963-9. Epub 2017 Apr 21. Med Oncol. 2017. PMID: 28432618 Free PMC article.
-
In Silico Identification of Crucial Genes and Specific Pathways in Hepatocellular Cancer.Genet Test Mol Biomarkers. 2020 May;24(5):296-308. doi: 10.1089/gtmb.2019.0242. Genet Test Mol Biomarkers. 2020. PMID: 32384023
-
Screening and Functional Prediction of Key Candidate Genes in Hepatitis B Virus-Associated Hepatocellular Carcinoma.Biomed Res Int. 2020 Oct 9;2020:7653506. doi: 10.1155/2020/7653506. eCollection 2020. Biomed Res Int. 2020. PMID: 33102593 Free PMC article.
-
Identification of core genes and outcomes in hepatocellular carcinoma by bioinformatics analysis.J Cell Biochem. 2019 Jun;120(6):10069-10081. doi: 10.1002/jcb.28290. Epub 2018 Dec 7. J Cell Biochem. 2019. PMID: 30525236
Cited by
-
Pathogenesis of Hepatocellular Carcinoma: The Interplay of Apoptosis and Autophagy.Biomedicines. 2023 Apr 13;11(4):1166. doi: 10.3390/biomedicines11041166. Biomedicines. 2023. PMID: 37189787 Free PMC article. Review.
-
Alpha-fetoprotein, glypican-3, and kininogen-1 as biomarkers for the diagnosis of hepatocellular carcinoma.Int J Clin Exp Pathol. 2024 Nov 15;17(11):383-395. doi: 10.62347/QSII4050. eCollection 2024. Int J Clin Exp Pathol. 2024. PMID: 39660335 Free PMC article. Review.
-
Pathophysiological dynamics in the contact, coagulation, and complement systems during sepsis: Potential targets for nafamostat mesilate.J Intensive Med. 2024 Apr 10;4(4):453-467. doi: 10.1016/j.jointm.2024.02.003. eCollection 2024 Oct. J Intensive Med. 2024. PMID: 39310056 Free PMC article. Review.
References
-
- Ali OS, Abo-Shadi MA, Hammad LN. The biological significance of serum complements C3 and C4 in HCV-related chronic liver diseases and hepatocellular carcinoma. Egyptian journal of Immunology. 2005;12:91–99. - PubMed
-
- Bodoor K, Haddad Y, Alkhateeb A, Al-Abbadi A, Dowairi M, Magableh A, Bsoul N, Ghabkari A. DNA hypermethylation of cell cycle (p15 and p16) and apoptotic (p14, p53, DAPK and TMS1) genes in peripheral blood of leukemia patients. Asian Pacific Journal of Cancer Prevention. 2014;15:75–84. doi: 10.7314/apjcp.2014.15.1.75. - DOI - PubMed
-
- Chen J, Wu W, Chen L, Ma X, Zhao Y, Zhou H, Yang R, Hu L. Expression and clinical significance of AHSG and complement C3 in pancreatic ductal adenocarcinoma. Zhonghua Yi Xue Za Zhi. 2014;94:2175–2179. - PubMed
Publication types
MeSH terms
Substances
LinkOut - more resources
Full Text Sources
Medical
Research Materials
Miscellaneous
