. 2022 Jul 28:2022:1345971.
doi: 10.1155/2022/1345971. eCollection 2022.

Intratumoral IL-28B Gene Delivery Elicits Antitumor Effects by Remodeling of the Tumor Microenvironment in H22-Bearing Mice

Affiliations

Intratumoral IL-28B Gene Delivery Elicits Antitumor Effects by Remodeling of the Tumor Microenvironment in H22-Bearing Mice

Zhi Li et al. J Immunol Res. .

Abstract

IL-28B, belonging to type III interferons (IFN-λs), exhibits a potent antitumor activity with reduced regulated T cells (Tregs) population, yet the effect of IL-28B on the tumor microenvironment (TME) and if IL-28B can downregulate Tregs directly in vitro are still unknown. In this study, we investigated the effects of IL-28B on Tregs in the spleen and TME in H22 tumor-bearing mice and verified the downregulation of IL-28B on Tregs in vitro. We found that rAd-mIL-28B significantly inhibited tumor growth and reduced the frequency of splenic CD4+Foxp3+ T cells. The levels of CXCL13, ICAM-1, MCP-5, and IL-7 in the serum, and the levels of IL-15 and sFasL in the tumor tissue decreased significantly after rAd-mIL-28B treatment relative to rAd-EGFP. Furthermore, the percentage of CD8+ cells in the TME was significantly increased in the rAd-mIL-28B group compared with the untreated group. In vitro, splenocytes were stimulated with anti-CD3/CD28 and IL-2 in the presence of TGF-β with or without IL-28B for three days and followed by flow cytometric, RT-PCR, and IL-10 production analysis. The results showed that IL-28B significantly reduced the proportion of induced Foxp3+ cells. It demonstrated that IL-28B may be used as a promising immunotherapy strategy against cancer.


Conflict of interest statement

The authors declare no potential conflicts of interest.

Figures

Figure 1
Figure 1
Intratumoral IL-28B gene transfer reduced tumor growth in a subcutaneous H22 hepatoma model. (a) Schema of the experiment was shown. (b) Tumor growth measurements. Data were shown as mean ± standard deviation (SD). P < 0.05 for rAd-mIL-28B vs. rAd-EGFP. (c) Representative image of detached tumors. Data from one experiment, each performed with nine mice, are shown.
Figure 2
Figure 2
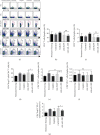
Intratumoral IL-28B gene transfer decreased the frequency of Tregs in the spleen. Spleens were harvested; processed into single-cell suspension; stained with FITC-conjugated anti-CD4, PerCP-conjugated anti-CD8, PE-conjugated anti-PD-1, and APC-conjugated anti-Foxp3; and analyzed by flow cytometry. (a) Representative dot plots and percentages of cells bounded by each region are shown in panels. (b) Statistical analysis of the percentages of CD4+ T cells, CD8+ T cells, and CD4+Foxp3+ cells among CD4+ T cells, CD4+PD-1+ T cells, CD8+PD-1+ T cells, and CD4+ Foxp3+ PD-1+ T cells in the spleens were shown. Data from one experiment, each performed with three mice, are shown. P < 0.05, ∗∗P < 0.01; and ns indicated P > 0.05.
Figure 3
Figure 3
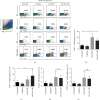
Intratumoral IL-28B gene transfer did not change the tumor-infiltrating regulatory T cells. The frequencies of CD4+, CD8+, Foxp3+, and CD4+Foxp3+ cells in TME. (a) Representative dot plots and percentages of cells bounded by each region are shown in panels. (b) Statistical analysis of the percentages of CD4+, CD8+, Foxp3+, and CD4+Foxp3+ cells in TME were shown (below panels). Data from one experiment, each performed with three mice, are shown. P < 0.05; ns indicated P > 0.05.
Figure 4
Figure 4
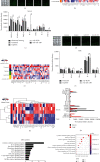
The peripheral and local cytokines production altered by IL-28B in vivo. Serum and tumor tissues were harvested and analyzed the cytokines by use of a commercial quantibody mouse cytokine array 5. The array images (a), a heat map of cytokine expression (b), and the mean signals strength of CXCL13, ICAM-1, MCP-5, IL-7 IFN-γ, IL-2, and TNF-α in the serum (c) were shown. The array images (d), a heat map of cytokine expression (e), and the mean signals strength of IL-15, sFasL, IFN-γ, IL-2, and TNF-α in TME (f) were shown. The mean signals strength derived from quadruplicate samples (n = 3). The hierarchical cluster analysis are used to analyze dissimilarities between serum and tumor tissues of rAd-mIL-28B (g). The moderated t-statistic was used for significance analysis to screen the differential proteins, which were defined as those with adjusted P < 0.05 and fold change > 1.2 or fold change < 1.2. Red indicates higher expressions and green indicates lower expressions. The levels of cytokines which changed more than twofold in serum and tumor tissues were shown (h). The KEGG pathway analysis (i) and Gene Ontology- (GO-) based biological process annotation of the differentially expressed proteins (j) were shown. Data from one experiment, each performed with three mice, are shown. TME: tumor microenvironment. P < 0.05; ns indicated P > 0.05.
Figure 5
Figure 5
IL-28B inhibited the proportion of Foxp3+-producing cells in a dose-dependent manner concomitant with a reduction in IL-10 production and Foxp3 mRNA expression. Splenocytes isolated from normal BALB/C mice were stimulated with anti-CD3/CD28 mAbs supplemented with IL-2 in the presence of TGF-β±IL-28B (5, 50, and 400 ng/ml). Splenocytes cultured in complete RPMI 1640 medium were used as the control. Cells stimulated with 500 ng/ml anti-CD3/CD28 mAbs, 5 ng/ml IL-2, and 1.25 ng/ml TGF-β were defined as the stimulation group. After three days, cells were harvested for flow cytometry and RT-PCR analysis, and cell-free culture was collected for IL-10 assay. (a) The percentages of Foxp3+ T cells were shown in bar graphs. Data were from six independent experiments. (b, c) The Foxp3 mRNA expression and IL-10 level were shown. Data from one experiment, each performed with three samples, are shown. P < 0.05; ∗∗P < 0.01.

Similar articles

References

    1. Nardone V., Botta C., Caraglia M., et al. Tumor infiltrating T lymphocytes expressing FoxP3, CCR7 or PD-1 predict the outcome of prostate cancer patients subjected to salvage radiotherapy after biochemical relapse. Cancer Biology & Therapy . 2016;17(11):1213–1220. doi: 10.1080/15384047.2016.1235666. - DOI - PMC - PubMed
    1. Togashi Y., Shitara K., Nishikawa H. Regulatory T cells in cancer immunosuppression -- implications for anticancer therapy. Nature Reviews Clinical Oncology . 2019;16(6):356–371. doi: 10.1038/s41571-019-0175-7. - DOI - PubMed
    1. Nishikawa H., Sakaguchi S. Regulatory T cells in cancer immunotherapy. Current opinion in immunology . 2014;27:1–7. doi: 10.1016/j.coi.2013.12.005. - DOI - PubMed
    1. Hashimoto H., Ueda R., Narumi K., Heike Y., Yoshida T., Aoki K. Type I IFN gene delivery suppresses regulatory T cells within tumors. Cancer Gene Therapy . 2014;21(12):532–541. doi: 10.1038/cgt.2014.60. - DOI - PubMed
    1. Farhood B., Najafi M., Mortezaee K. CD8(+) cytotoxic T lymphocytes in cancer immunotherapy: a review. Journal of Cellular Physiology . 2019;234(6):8509–8521. doi: 10.1002/jcp.27782. - DOI - PubMed

Substances