

doi: 10.1097/HS9.0000000000000758.
eCollection 2022 Aug.
Retrospective Longitudinal Monitoring of Multiple Myeloma Patients by Mass Spectrometry Using Archived Serum Protein Electrophoresis Gels and De Novo Sequence Analysis
Affiliations
- PMID: 35935609
- PMCID: PMC9348860
- DOI: 10.1097/HS9.0000000000000758
Item in Clipboard
Retrospective Longitudinal Monitoring of Multiple Myeloma Patients by Mass Spectrometry Using Archived Serum Protein Electrophoresis Gels and De Novo Sequence Analysis
Hemasphere.
.
No abstract available
Figures
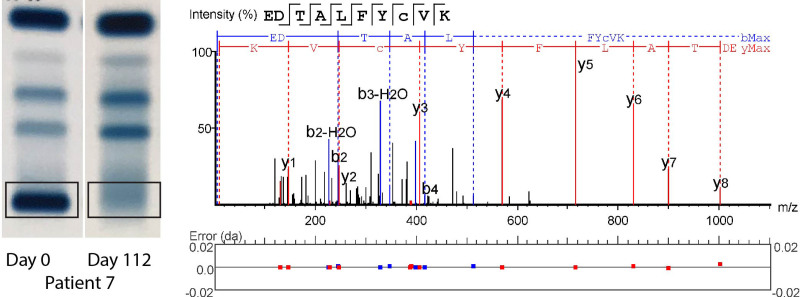
SPEP gels and de novo sequencing. Two representative SPEP gels are shown from patient 7, 1 positive for M-protein, the other negative. The gel band that was excised for mass spectrometry analysis has been indicated. The result of de novo sequence analysis on the first gel sample is shown, indicating fragment ion peaks associated with the amino acid sequence of the peptide and mass errors. Other peptides in Suppl. Figure S1 . SPEP = serum protein electrophoresis.
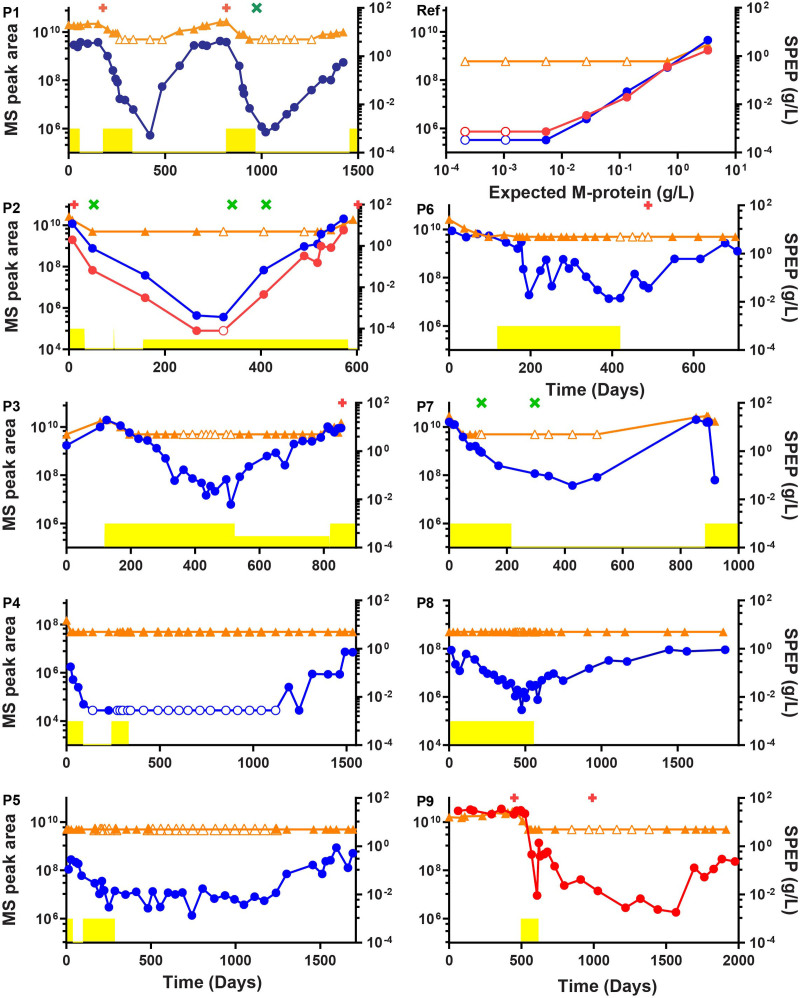
Comparison of M-protein monitoring by routine electrophoretic techniques (serum protein electrophoresis and immunofixation electrophoresis) and the mass spectrometry assay. Routine M-protein monitoring is shown in orange. M-protein concentration ≤5 g/L is plotted at 5 g/L, SPEP data for patient 1 includes interference from the β region. MS signals are indicated in arbitrary units and shown in blue for heavy chain peptides, and in red for the light chain. Empty symbols indicate that the M-protein/M-protein peptide was not detectable and were plotted at the level of the lowest positive sample. Patient treatment periods are shown in yellow, maintenance periods are plotted at a lower height. Bone marrow flow cytometry data are plotted as a green cross (MRD negative) or as a red plus (MRD positive). Panels P1–P9 shows the 9 patients and the panel marked Ref represents a dilution series based on the reference patient sample. MRD = minimal residual disease.
Similar articles
-
Integrating Serum Protein Electrophoresis with Mass Spectrometry, A New Workflow for M-Protein Detection and Quantification.J Proteome Res. 2020 Jul 2;19(7):2845-2853. doi: 10.1021/acs.jproteome.9b00705. Epub 2020 Jan 14. J Proteome Res. 2020. PMID: 31895568
-
Development of novel methods for non-canonical myeloma protein analysis with an innovative adaptation of immunofixation electrophoresis, native top-down mass spectrometry, and middle-down de novo sequencing.Clin Chem Lab Med. 2020 Oct 20;59(4):653-661. doi: 10.1515/cclm-2020-1072. Print 2021 Mar 26. Clin Chem Lab Med. 2020. PMID: 33079696 Free PMC article.
-
Identification of Proteins on Archived 2D Gels.Methods Mol Biol. 2019;1855:287-289. doi: 10.1007/978-1-4939-8793-1_24. Methods Mol Biol. 2019. PMID: 30426425
-
Bringing mass spectrometry into the care of patients with multiple myeloma.Int J Hematol. 2022 Jun;115(6):790-798. doi: 10.1007/s12185-022-03364-2. Epub 2022 Apr 26. Int J Hematol. 2022. PMID: 35471500 Review.
-
Disease proteomics of high-molecular-mass proteins by two-dimensional gel electrophoresis with agarose gels in the first dimension (Agarose 2-DE).J Chromatogr B Analyt Technol Biomed Life Sci. 2007 Apr 15;849(1-2):211-22. doi: 10.1016/j.jchromb.2006.10.064. Epub 2006 Dec 1. J Chromatogr B Analyt Technol Biomed Life Sci. 2007. PMID: 17141588 Review.
Cited by
-
Direct Mass Spectrometry-Based Detection and Antibody Sequencing of Monoclonal Gammopathy of Undetermined Significance from Patient Serum: A Case Study.J Proteome Res. 2023 Sep 1;22(9):3022-3028. doi: 10.1021/acs.jproteome.3c00330. Epub 2023 Jul 27. J Proteome Res. 2023. PMID: 37499263 Free PMC article.
-
M-protein diagnostics in multiple myeloma patients using ultra-sensitive targeted mass spectrometry and an off-the-shelf calibrator.Clin Chem Lab Med. 2023 Oct 12;62(3):540-550. doi: 10.1515/cclm-2023-0781. Print 2024 Feb 26. Clin Chem Lab Med. 2023. PMID: 37823394 Free PMC article.
References
-
- Willrich MAV, Murray DL, Kyle RA. Laboratory testing for monoclonal gammopathies: Focus on monoclonal gammopathy of undetermined significance and smoldering multiple myeloma. Clin Biochem. 2018;51:38–47. - PubMed
-
- Mills JR, Barnidge DR, Murray DL. Detecting monoclonal immunoglobulins in human serum using mass spectrometry. Methods. 2015;81:56–65. - PubMed
-
- Dimopoulos M, Kyle R, Fermand JP, et al. . Consensus recommendations for standard investigative workup: report of the International Myeloma Workshop Consensus Panel 3. Blood. 2011;117:4701–4705. - PubMed
-
- Jacobs JFM, Turner KA, Graziani MS, et al. . An international multi-center serum protein electrophoresis accuracy and M-protein isotyping study. Part II: limit of detection and follow-up of patients with small M-proteins. Clin Chem Lab Med. 2020;58:547–559. - PubMed
-
- Moreau P, Attal M, Facon T. Frontline therapy of multiple myeloma. Blood. 2015;125:3076–3084. - PubMed
LinkOut - more resources
Full Text Sources