. 2022 Jul 22:9:941890.
doi: 10.3389/fcvm.2022.941890. eCollection 2022.

Sex-dependent transcription of cardiac electrophysiology and links to acetylation modifiers based on the GTEx database

Affiliations

Sex-dependent transcription of cardiac electrophysiology and links to acetylation modifiers based on the GTEx database

Michael P Pressler et al. Front Cardiovasc Med. .

Abstract

Development of safer drugs based on epigenetic modifiers, e.g., histone deacetylase inhibitors (HDACi), requires better understanding of their effects on cardiac electrophysiology. Using RNAseq data from the genotype-tissue-expression database (GTEx), we created models that link the abundance of acetylation enzymes (HDAC/SIRT/HATs), and the gene expression of ion channels (IC) via select cardiac transcription factors (TFs) in male and female adult human hearts (left ventricle, LV). Gene expression data (transcripts per million, TPM) from GTEx donors (21-70 y.o.) were filtered, normalized and transformed to Euclidian space to allow quantitative comparisons in 84 female and 158 male LVs. Sex-specific partial least-square (PLS) regression models, linking gene expression data for HDAC/SIRT/HATs to TFs and to ICs gene expression, revealed tight co-regulation of cardiac ion channels by HDAC/SIRT/HATs, with stronger clustering in the male LV. Co-regulation of genes encoding excitatory and inhibitory processes in cardiac tissue by the acetylation modifiers may help explain their predominantly net-neutral effects on cardiac electrophysiology. ATP1A1, encoding for the Na/K pump, represented an outlier-with orthogonal regulation by the acetylation modifiers to most of the ICs. The HDAC/SIRT/HAT effects were mediated by strong (+) TF regulators of ICs, e.g., MEF2A and TBX5, in both sexes. Furthermore, for male hearts, PLS models revealed a stronger (+/-) mediatory role on ICs for NKX25 and TGF1B/KLF4, respectively, while RUNX1 exhibited larger (-) TF effects on ICs in females. Male-trained PLS models of HDAC/SIRT/HAT effects on ICs underestimated the effects on some ICs in females. Insights from the GTEx dataset about the co-expression and transcriptional co-regulation of acetylation-modifying enzymes, transcription factors and key cardiac ion channels in a sex-specific manner can help inform safer drug design.

Keywords: GTEx; PLS; cardiac electrophysiology; epigenetics; histone acetylation; left ventricle; sex differences.


Conflict of interest statement

The authors declare that the research was conducted in the absence of any commercial or financial relationships that could be construed as a potential conflict of interest.

Figures
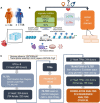
FIGURE 1
FIGURE 1
Study design outline and processing steps. Using the GTEx database to inform PLS regression models of the effects of acetylation modifiers (HDACs, SIRTs, HATs) on cardiac ion channels via key TFs in the adult male and female left ventricle (LV). (A) LV bulk RNAseq data from 84 female and 158 male adults were used from the GTEx dataset. (B) The performed analysis examines how the balance of HDACs, SIRTs, and HATs may affect cardiac ion channel transcription in a sex-dependent manner. HDACs and SIRTs counter the action of HATs, which acetylate chromatin thus increasing its accessibility for key cardiac TFs to act on genes of interest; they also have non-histone actions, including acetylation of cytoplasmic proteins, direct binding to, acetylation of transcription factors, effects on oxidative stress, anti-viral action etc. HDACs, SIRTs, and HATs negatively or positively regulate the effects of TFs and consequently change the expression of cardiac ion channels. (C) Parts of panel B were generated using Biorender.com. Processing pipeline: Starting with 689 donors in the GTEx v.8 dataset, after filtering and transformations, 242 donors were used for correlation and PLS regression analysis. The processing steps include TPM filtering based on GAPDH levels to yield similar normal distributions and a log-ratio transformation from simplex to Euclidian space.
FIGURE 2
FIGURE 2
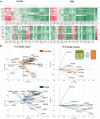
Analysis of links between acetylation modifiers (HDACs, SIRTs, and HATs) and key cardiac ion channels based on transcription. (A) Pearson’s correlation of ion channels with HDACs, SIRTs, and HATs for female (left) and male (right) LV heart samples. Positive/negative correlations are coded in green/red and shaded by their strength. The top correlation matrices are grouped using agglomerative clustering which generates the linkages. The unorganized correlation coefficients are on the bottom (B). PLS regression models for female (orange) and male (blue) samples. Inset in (B) shows the models being investigated. The results are presented in biplots for the PLS model inputs (left) and model outputs (right). The biplots are projections of the model parameters onto the space of the first two latent variables of the constructed 4-latent-variable PLS models; shown are also the % variance explained for each latent variable. All biplots represent the average results from 1,000 Monte Carlo PLS runs with random selection of training and testing samples (with the testing samples representing 10%). Proximity in angle between the lines for the model variables indicates co-regulation/similarity of action; the size of the lines signifies the importance of the variable in the shown projection. For example, ATP2A2 is strongly influenced by the histone modifiers and is mainly represented in component 1 in the male and the female models (right panels). Positive co-regulation by SIRT 3, 4, and 5 and negative co-regulation of SIRT 6 and 7 on cardiac ion channels are strong in both the female and male models (left panels) (see text for more interpretations).
FIGURE 3
FIGURE 3
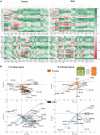
Analysis of links between acetylation modifiers (HDACs, SIRTs, and HATs) and key cardiac TFs. (A) Pearson’s correlation of TFs with HDACs, SIRTs, and HATs for female (top) and male (bottom) LV heart samples. Positive/negative correlations are coded in green/red and shaded by their strength. The linkages in the top clustering’s were created using agglomerative clustering. (B) PLS regression models for female (orange) and male (blue) samples. Inset in B shows the models being investigated. Shown are biplots for the PLS models—constructed as described in Figure 2.
FIGURE 4
FIGURE 4
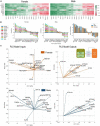
Analysis of links between cardiac TFs and key cardiac ion channels. (A) Pearson’s correlation of key ion channels with cardiac TFs for female (left) and male (right) LV heart samples. The ranking of the TFs is done based on sum of correlations (from predominantly positive to predominantly negative) from left to right. These ranking yields slightly different order for female and male samples. (B) Bar plots show the cumulative correlation of individual ion channels with each TF for female, male samples, and the final plot shows the overlaid impacts of TFs on ion channels for female and male samples to reveal any differences. (C) PLS regression models trained with the TFs predicting ion channels for female (orange) and male (blue) samples. Inset in B shows the models being investigated. Shown are biplots for the PLS models—constructed as described in Figure 2.
FIGURE 5
FIGURE 5
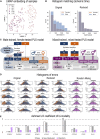
Monte Carlo (MC) simulations to examine the predictive power of male-trained PLS models when applied to female data. (A) UMAP embedding (dimension reduction) was used to visualize the samples in 2D space, when considering all HDACs, SIRTs, HATs, TFs, and Ion Channels. This representation showed strong role for the total ischemic time (SMTSISCH, colored) in the separation of samples. (B) To eliminate the effects of SMTSISCH as a confounder in the sex-difference analysis, a histogram matching was performed—the histograms show the before and after reduction of the set of male samples to match the female samples based on total ischemic time. (C) (Left) Details on the MC model runs and estimation of errors for male-trained, female-tested PLS models linking histone acetylation modifiers to cardiac ion channels in the LV. Two types of male models (matching the sample size of the female set, 84) were constructed—“original” with randomly selected 84 male samples and “reduced” (with histogram matching for SMTSISCH). (Right) Details on the construction of MC mixed models—trained on mixed data and tested on mixed female-male data. By mixing male and female, the model will have seen both samples and predict both well, assuming that the training samples represent the actual distribution of male and female samples. (D) From the 1,000 runs, the total errors were stored and displayed in histograms for the three types of models depicted in D, respectively. Note systematic shifts in errors in D from the zero-mean center. Left shift (to more negative error values) indicates underestimation of effects by the created PLS model for the respective variable. (E) Ashman’s D coefficient (measure of bimodality, or how distinct the two populations of errors are) was calculated for each of the model results and displayed on the bar plot; higher Ashman’s D values indicate better separability.
FIGURE 6
FIGURE 6
Control of key genes defining cardiac electrophysiology by HDACs, SIRTs, HATs, and TFs. Using the results from the PLS beta matrix, the effects of the HDACs, SIRTs, HATs, and TFs were summed to quantify the effect on the electrophysiology of cardiomyocytes. The 6 groupings examined were Depolarization (SCN5A, CACNA1C, SLC8A1), Repolarization (KCNH2, KCNQ1, KCNJ2, ATP1A1), Net (Depolarization—Repolarization), Resting (KCNJ2, ATP1A1), Calcium Handling (ATP2A2, RYR2, SLC8A1, CACNA1C), and Coupling (GJA1). This analysis was done for both female (top) and male (bottom) samples separately.
FIGURE 7
FIGURE 7
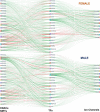
Integrated (Sankey) flow diagrams of how HDACs and SIRTs influence ion channels via cardiac TFs. PLS regression models (for female samples on top and male samples on bottom) were trained using HDACs and SIRTs to predict TFs and then using TFs to predict cardiac ion channels. The resulting B-matrix coefficients were utilized to create the plots. The width and color intensity of the lines correspond to the strength of the B-matrix coefficients, and the color distinguishes between positive (green) and negative (red) coefficients. Note that in some cases, double negative regulation (e.g., SIRT3 - > RUNX1 - > RYR2) results in positive input-output relationships.

Similar articles

Cited by

References

    1. GTEx Consortium. The GTEx Consortium atlas of genetic regulatory effects across human tissues. Science. (2020) 369:1318–30. 10.1126/science.aaz1776 - DOI - PMC - PubMed
    1. GTEx Consortium. Human genomics. the Genotype-Tissue Expression (GTEx) pilot analysis: multitissue gene regulation in humans. Science. (2015) 348:648–60. 10.1126/science.1262110 - DOI - PMC - PubMed
    1. Aguet F, Brown AA, Castel SE, Davis JR, He Y, Jo B, et al. Genetic effects on gene expression across human tissues. Nature. (2017) 550:204–13. - PMC - PubMed
    1. Duffy A, Verbanck M, Dobbyn A, Won HH, Rein JL, Forrest IS, et al. Tissue-specific genetic features inform prediction of drug side effects in clinical trials. Sci Adv. (2020) 6:eabb6242. 10.1126/sciadv.abb6242 - DOI - PMC - PubMed
    1. Nguyen PA, Born DA, Deaton AM, Nioi P, Ward LD. Phenotypes associated with genes encoding drug targets are predictive of clinical trial side effects. Nat Commun. (2019) 10:1579. - PMC - PubMed